NATIONAL COMMUNITY PHARMACISTS ASSOCIATION
NATIONAL COMMUNITY PHARMACISTS ASSOCIATION
NATIONAL COMMUNITY PHARMACISTS ASSOCIATION
- No tags were found...

You also want an ePaper? Increase the reach of your titles
YUMPU automatically turns print PDFs into web optimized ePapers that Google loves.
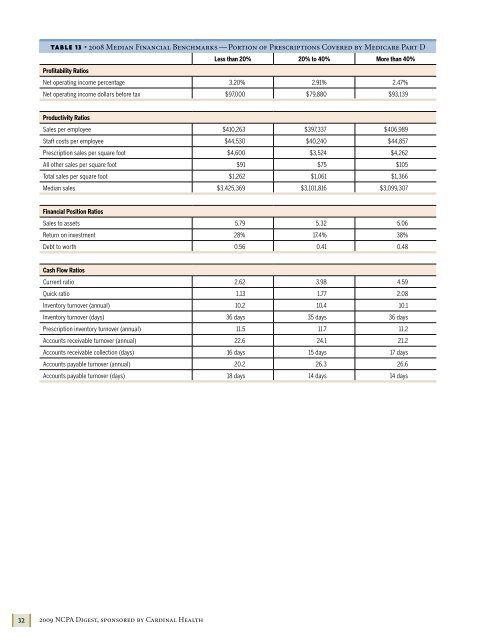
TABLE 13 • 2008 Median Financial Benchmarks — Portion of Prescriptions Covered by Medicare Part DLess than 20% 20% to 40% More than 40%Profitability RatiosNet operating income percentage 3.20% 2.91% 2.47%Net operating income dollars before tax $97,000 $79,880 $93,139Productivity RatiosSales per employee $410,263 $397,337 $406,989Staff costs per employee $44,530 $40,240 $44,857Prescription sales per square foot $4,600 $3,524 $4,262All other sales per square foot $91 $75 $105Total sales per square foot $1,262 $1,061 $1,366Median sales $3,425,369 $3,101,816 $3,099,307Financial Position RatiosSales to assets 5.79 5.32 5.06Return on investment 28% 17.4% 38%Debt to worth 0.56 0.41 0.48Cash Flow RatiosCurrent ratio 2.62 3.98 4.59Quick ratio 1.13 1.77 2.08Inventory turnover (annual) 10.2 10.4 10.1Inventory turnover (days) 36 days 35 days 36 daysPrescription inventory turnover (annual) 11.5 11.7 11.2Accounts receivable turnover (annual) 22.6 24.1 21.2Accounts receivable collection (days) 16 days 15 days 17 daysAccounts payable turnover (annual) 20.2 26.3 26.6Accounts payable turnover (days) 18 days 14 days 14 days322009 NCPA Digest, sponsored by Cardinal Health