NATIONAL COMMUNITY PHARMACISTS ASSOCIATION
NATIONAL COMMUNITY PHARMACISTS ASSOCIATION
NATIONAL COMMUNITY PHARMACISTS ASSOCIATION
- No tags were found...

Create successful ePaper yourself
Turn your PDF publications into a flip-book with our unique Google optimized e-Paper software.
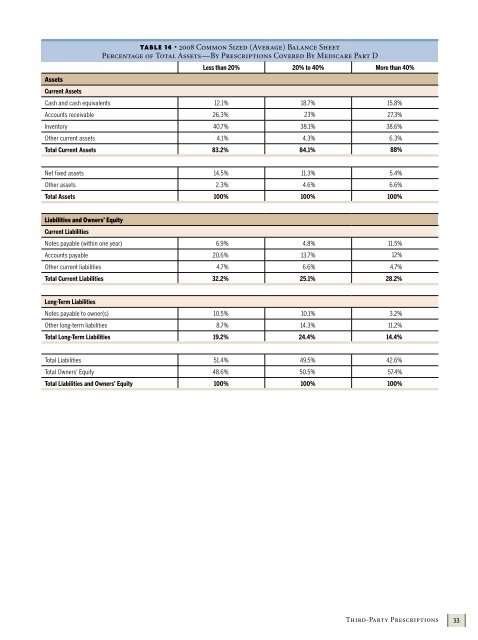
AssetsTABLE 14 • 2008 Common Sized (Average) Balance SheetPercentage of Total Assets—By Prescriptions Covered By Medicare Part DLess than 20% 20% to 40% More than 40%Current AssetsCash and cash equivalents 12.1% 18.7% 15.8%Accounts receivable 26.3% 23% 27.3%Inventory 40.7% 38.1% 38.6%Other current assets 4.1% 4.3% 6.3%Total Current Assets 83.2% 84.1% 88%Net fixed assets 14.5% 11.3% 5.4%Other assets 2.3% 4.6% 6.6%Total Assets 100% 100% 100%Liabilities and Owners’ EquityCurrent LiabilitiesNotes payable (within one year) 6.9% 4.8% 11.5%Accounts payable 20.6% 13.7% 12%Other current liabilities 4.7% 6.6% 4.7%Total Current Liabilities 32.2% 25.1% 28.2%Long-Term LiabilitiesNotes payable to owner(s) 10.5% 10.1% 3.2%Other long-term liabilities 8.7% 14.3% 11.2%Total Long-Term Liabilities 19.2% 24.4% 14.4%Total Liabilities 51.4% 49.5% 42.6%Total Owners’ Equity 48.6% 50.5% 57.4%Total Liabilities and Owners’ Equity 100% 100% 100%Third-Party Prescriptions33