From Ageism to Age Equality: Addressing the Challenges ...
From Ageism to Age Equality: Addressing the Challenges ...
From Ageism to Age Equality: Addressing the Challenges ...

You also want an ePaper? Increase the reach of your titles
YUMPU automatically turns print PDFs into web optimized ePapers that Google loves.
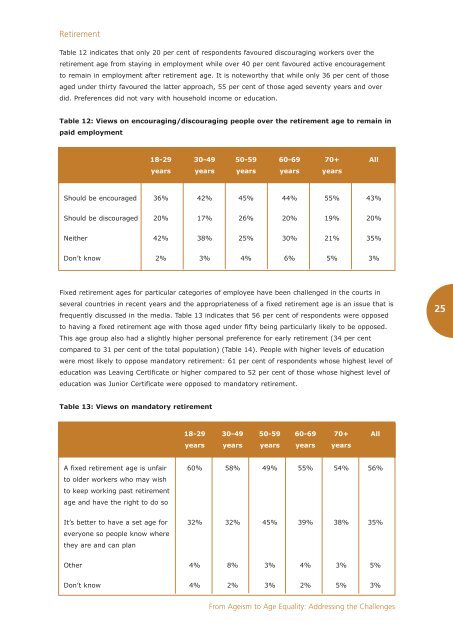
RetirementTable 12 indicates that only 20 per cent of respondents favoured discouraging workers over <strong>the</strong>retirement age from staying in employment while over 40 per cent favoured active encouragement<strong>to</strong> remain in employment after retirement age. It is noteworthy that while only 36 per cent of thoseaged under thirty favoured <strong>the</strong> latter approach, 55 per cent of those aged seventy years and overdid. Preferences did not vary with household income or education.Table 12: Views on encouraging/discouraging people over <strong>the</strong> retirement age <strong>to</strong> remain inpaid employment18-29 30-49 50-59 60-69 70+ Allyears years years years yearsShould be encouraged 36% 42% 45% 44% 55% 43%Should be discouraged 20% 17% 26% 20% 19% 20%Nei<strong>the</strong>r 42% 38% 25% 30% 21% 35%Don’t know 2% 3% 4% 6% 5% 3%Fixed retirement ages for particular categories of employee have been challenged in <strong>the</strong> courts inseveral countries in recent years and <strong>the</strong> appropriateness of a fixed retirement age is an issue that isfrequently discussed in <strong>the</strong> media. Table 13 indicates that 56 per cent of respondents were opposed<strong>to</strong> having a fixed retirement age with those aged under fifty being particularly likely <strong>to</strong> be opposed.This age group also had a slightly higher personal preference for early retirement (34 per centcompared <strong>to</strong> 31 per cent of <strong>the</strong> <strong>to</strong>tal population) (Table 14). People with higher levels of educationwere most likely <strong>to</strong> oppose manda<strong>to</strong>ry retirement: 61 per cent of respondents whose highest level ofeducation was Leaving Certificate or higher compared <strong>to</strong> 52 per cent of those whose highest level ofeducation was Junior Certificate were opposed <strong>to</strong> manda<strong>to</strong>ry retirement.25Table 13: Views on manda<strong>to</strong>ry retirement18-29 30-49 50-59 60-69 70+ Allyears years years years yearsA fixed retirement age is unfair 60% 58% 49% 55% 54% 56%<strong>to</strong> older workers who may wish<strong>to</strong> keep working past retirementage and have <strong>the</strong> right <strong>to</strong> do soIt’s better <strong>to</strong> have a set age for 32% 32% 45% 39% 38% 35%everyone so people know where<strong>the</strong>y are and can planO<strong>the</strong>r 4% 8% 3% 4% 3% 5%Don’t know 4% 2% 3% 2% 5% 3%<strong>From</strong> <strong><strong>Age</strong>ism</strong> <strong>to</strong> <strong>Age</strong> <strong>Equality</strong>: <strong>Addressing</strong> <strong>the</strong> <strong>Challenges</strong>