Changing Glaciers and Hydrology in Asia - Environmental Health at ...
Changing Glaciers and Hydrology in Asia - Environmental Health at ...
Changing Glaciers and Hydrology in Asia - Environmental Health at ...
- No tags were found...

You also want an ePaper? Increase the reach of your titles
YUMPU automatically turns print PDFs into web optimized ePapers that Google loves.
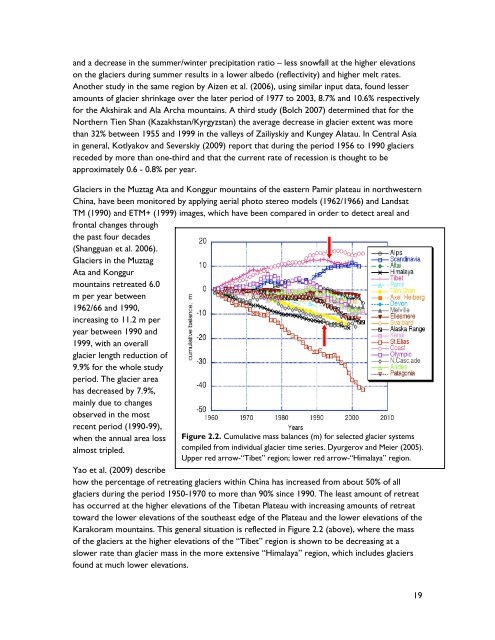
<strong>and</strong> a decrease <strong>in</strong> the summer/w<strong>in</strong>ter precipit<strong>at</strong>ion r<strong>at</strong>io – less snowfall <strong>at</strong> the higher elev<strong>at</strong>ionson the glaciers dur<strong>in</strong>g summer results <strong>in</strong> a lower albedo (reflectivity) <strong>and</strong> higher melt r<strong>at</strong>es.Another study <strong>in</strong> the same region by Aizen et al. (2006), us<strong>in</strong>g similar <strong>in</strong>put d<strong>at</strong>a, found lesseramounts of glacier shr<strong>in</strong>kage over the l<strong>at</strong>er period of 1977 to 2003, 8.7% <strong>and</strong> 10.6% respectivelyfor the Akshirak <strong>and</strong> Ala Archa mounta<strong>in</strong>s. A third study (Bolch 2007) determ<strong>in</strong>ed th<strong>at</strong> for theNorthern Tien Shan (Kazakhstan/Kyrgyzstan) the average decrease <strong>in</strong> glacier extent was morethan 32% between 1955 <strong>and</strong> 1999 <strong>in</strong> the valleys of Zailiyskiy <strong>and</strong> Kungey Al<strong>at</strong>au. In Central <strong>Asia</strong><strong>in</strong> general, Kotlyakov <strong>and</strong> Severskiy (2009) report th<strong>at</strong> dur<strong>in</strong>g the period 1956 to 1990 glaciersreceded by more than one-third <strong>and</strong> th<strong>at</strong> the current r<strong>at</strong>e of recession is thought to beapproxim<strong>at</strong>ely 0.6 - 0.8% per year.<strong>Glaciers</strong> <strong>in</strong> the Muztag Ata <strong>and</strong> Konggur mounta<strong>in</strong>s of the eastern Pamir pl<strong>at</strong>eau <strong>in</strong> northwesternCh<strong>in</strong>a, have been monitored by apply<strong>in</strong>g aerial photo stereo models (1962/1966) <strong>and</strong> L<strong>and</strong>s<strong>at</strong>TM (1990) <strong>and</strong> ETM+ (1999) images, which have been compared <strong>in</strong> order to detect areal <strong>and</strong>frontal changes throughthe past four decades(Shangguan et al. 2006).<strong>Glaciers</strong> <strong>in</strong> the MuztagAta <strong>and</strong> Konggurmounta<strong>in</strong>s retre<strong>at</strong>ed 6.0m per year between1962/66 <strong>and</strong> 1990,<strong>in</strong>creas<strong>in</strong>g to 11.2 m peryear between 1990 <strong>and</strong>1999, with an overallglacier length reduction of9.9% for the whole studyperiod. The glacier areahas decreased by 7.9%,ma<strong>in</strong>ly due to changesobserved <strong>in</strong> the mostrecent period (1990-99),when the annual area lossalmost tripled.Figure 2.2. Cumul<strong>at</strong>ive mass balances (m) for selected glacier systemscompiled from <strong>in</strong>dividual glacier time series. Dyurgerov <strong>and</strong> Meier (2005).Upper red arrow-“Tibet” region; lower red arrow-“Himalaya” region.Yao et al. (2009) describehow the percentage of retre<strong>at</strong><strong>in</strong>g glaciers with<strong>in</strong> Ch<strong>in</strong>a has <strong>in</strong>creased from about 50% of allglaciers dur<strong>in</strong>g the period 1950-1970 to more than 90% s<strong>in</strong>ce 1990. The least amount of retre<strong>at</strong>has occurred <strong>at</strong> the higher elev<strong>at</strong>ions of the Tibetan Pl<strong>at</strong>eau with <strong>in</strong>creas<strong>in</strong>g amounts of retre<strong>at</strong>toward the lower elev<strong>at</strong>ions of the southeast edge of the Pl<strong>at</strong>eau <strong>and</strong> the lower elev<strong>at</strong>ions of theKarakoram mounta<strong>in</strong>s. This general situ<strong>at</strong>ion is reflected <strong>in</strong> Figure 2.2 (above), where the massof the glaciers <strong>at</strong> the higher elev<strong>at</strong>ions of the “Tibet” region is shown to be decreas<strong>in</strong>g <strong>at</strong> aslower r<strong>at</strong>e than glacier mass <strong>in</strong> the more extensive “Himalaya” region, which <strong>in</strong>cludes glaciersfound <strong>at</strong> much lower elev<strong>at</strong>ions.19