Changing Glaciers and Hydrology in Asia - Environmental Health at ...
Changing Glaciers and Hydrology in Asia - Environmental Health at ...
Changing Glaciers and Hydrology in Asia - Environmental Health at ...
- No tags were found...

Create successful ePaper yourself
Turn your PDF publications into a flip-book with our unique Google optimized e-Paper software.
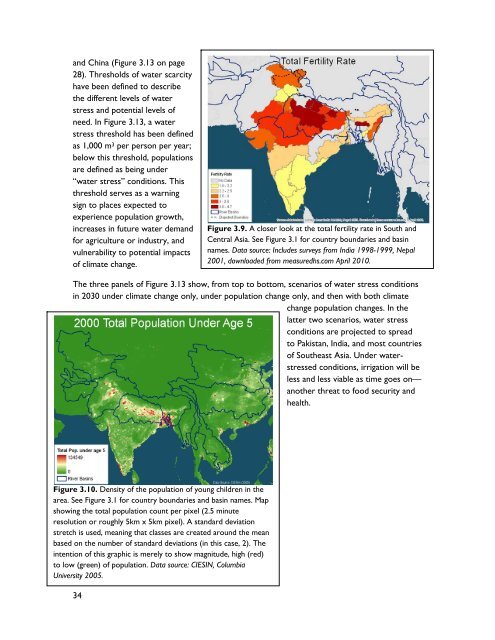
<strong>and</strong> Ch<strong>in</strong>a (Figure 3.13 on page28). Thresholds of w<strong>at</strong>er scarcityhave been def<strong>in</strong>ed to describethe different levels of w<strong>at</strong>erstress <strong>and</strong> potential levels ofneed. In Figure 3.13, a w<strong>at</strong>erstress threshold has been def<strong>in</strong>edas 1,000 m 3 per person per year;below this threshold, popul<strong>at</strong>ionsare def<strong>in</strong>ed as be<strong>in</strong>g under“w<strong>at</strong>er stress” conditions. Thisthreshold serves as a warn<strong>in</strong>gsign to places expected toexperience popul<strong>at</strong>ion growth,<strong>in</strong>creases <strong>in</strong> future w<strong>at</strong>er dem<strong>and</strong>for agriculture or <strong>in</strong>dustry, <strong>and</strong>vulnerability to potential impactsof clim<strong>at</strong>e change.Figure 3.9. A closer look <strong>at</strong> the total fertility r<strong>at</strong>e <strong>in</strong> South <strong>and</strong>Central <strong>Asia</strong>. See Figure 3.1 for country boundaries <strong>and</strong> bas<strong>in</strong>names. D<strong>at</strong>a source: Includes surveys from India 1998-1999, Nepal2001, downloaded from measuredhs.com April 2010.The three panels of Figure 3.13 show, from top to bottom, scenarios of w<strong>at</strong>er stress conditions<strong>in</strong> 2030 under clim<strong>at</strong>e change only, under popul<strong>at</strong>ion change only, <strong>and</strong> then with both clim<strong>at</strong>echange popul<strong>at</strong>ion changes. In thel<strong>at</strong>ter two scenarios, w<strong>at</strong>er stressconditions are projected to spreadto Pakistan, India, <strong>and</strong> most countriesof Southeast <strong>Asia</strong>. Under w<strong>at</strong>erstressedconditions, irrig<strong>at</strong>ion will beless <strong>and</strong> less viable as time goes on—another thre<strong>at</strong> to food security <strong>and</strong>health.Figure 3.10. Density of the popul<strong>at</strong>ion of young children <strong>in</strong> thearea. See Figure 3.1 for country boundaries <strong>and</strong> bas<strong>in</strong> names. Mapshow<strong>in</strong>g the total popul<strong>at</strong>ion count per pixel (2.5 m<strong>in</strong>uteresolution or roughly 5km x 5km pixel). A st<strong>and</strong>ard devi<strong>at</strong>ionstretch is used, mean<strong>in</strong>g th<strong>at</strong> classes are cre<strong>at</strong>ed around the meanbased on the number of st<strong>and</strong>ard devi<strong>at</strong>ions (<strong>in</strong> this case, 2). The<strong>in</strong>tention of this graphic is merely to show magnitude, high (red)to low (green) of popul<strong>at</strong>ion. D<strong>at</strong>a source: CIESIN, ColumbiaUniversity 2005.34