Materials Science and Engineering Laboratory FY 2004 ... - NIST
Materials Science and Engineering Laboratory FY 2004 ... - NIST
Materials Science and Engineering Laboratory FY 2004 ... - NIST

You also want an ePaper? Increase the reach of your titles
YUMPU automatically turns print PDFs into web optimized ePapers that Google loves.
This rate is directly proportional to interfacial tension σ.<br />
Specifically, the drop relaxation time τ is:<br />
τ =<br />
( 2ηˆ<br />
+ 3)(<br />
19ηˆ<br />
+ 16)<br />
ηca<br />
40(<br />
ηˆ<br />
+ 1)<br />
σ<br />
where a o is the undeformed drop radius, h c is the<br />
continuous phase viscosity, ε& is the shear rate, <strong>and</strong><br />
ηˆ is the relative viscosity of the drop.<br />
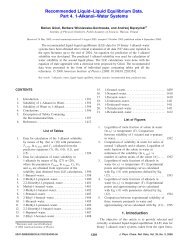
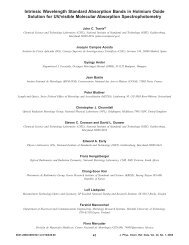
Figure 2: Freeze-frame image of drops flowing left to right in an<br />
extensional flow gradient. When the drops leave the constriction<br />
(the channel walls appear as slanted lines in the left half of the<br />
image), the flow decelerates in proportion to the change in<br />
cross-sectional area. The drops, which are generated periodically<br />
in time, therefore, become closer together. This deceleration<br />
corresponds to a stretching in the transverse direction; note that<br />
the drops at the left side are stretched vertically, <strong>and</strong> their<br />
deformation decays as they pass to the right.<br />
The current measurement rate may exceed 100 data<br />
points/s <strong>and</strong> is dependent on drop formation <strong>and</strong> image<br />
acquisition rates.<br />
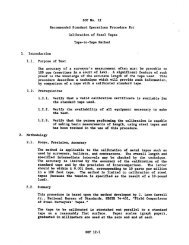
Figure 3: LabVIEW interface used to control the instrument<br />
<strong>and</strong> record data.<br />
o<br />
Technical Highlights<br />
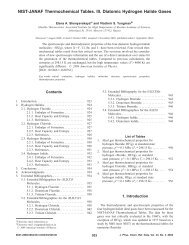
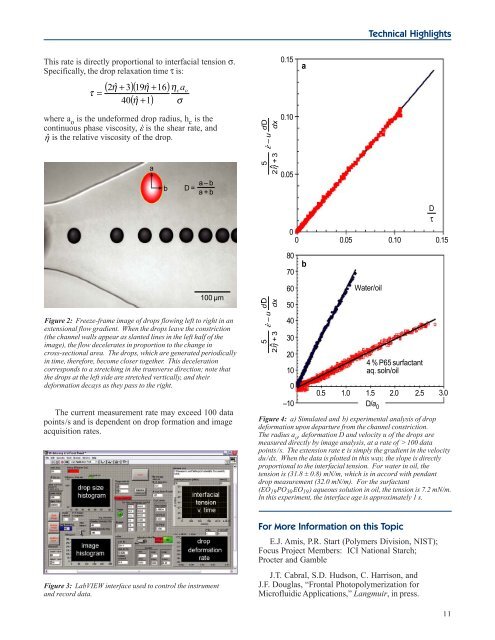
Figure 4: a) Simulated <strong>and</strong> b) experimental analysis of drop<br />
deformation upon departure from the channel constriction.<br />
The radius a o , deformation D <strong>and</strong> velocity u of the drops are<br />
measured directly by image analysis, at a rate of > 100 data<br />
points/s. The extension rate ε is simply the gradient in the velocity<br />
du/dx. When the data is plotted in this way, the slope is directly<br />
proportional to the interfacial tension. For water in oil, the<br />
tension is (31.8 ± 0.8) mN/m, which is in accord with pendant<br />
drop measurement (32.0 mN/m). For the surfactant<br />
(EO 19PO 30EO 19) aqueous solution in oil, the tension is 7.2 mN/m.<br />
In this experiment, the interface age is approximately 1 s.<br />
For More Information on this Topic<br />
E.J. Amis, P.R. Start (Polymers Division, <strong>NIST</strong>);<br />
Focus Project Members: ICI National Starch;<br />
Procter <strong>and</strong> Gamble<br />
J.T. Cabral, S.D. Hudson, C. Harrison, <strong>and</strong><br />
J.F. Douglas, “Frontal Photopolymerization for<br />
Microfluidic Applications,” Langmuir, in press.<br />
11