Materials Science and Engineering Laboratory FY 2004 ... - NIST
Materials Science and Engineering Laboratory FY 2004 ... - NIST
Materials Science and Engineering Laboratory FY 2004 ... - NIST

You also want an ePaper? Increase the reach of your titles
YUMPU automatically turns print PDFs into web optimized ePapers that Google loves.
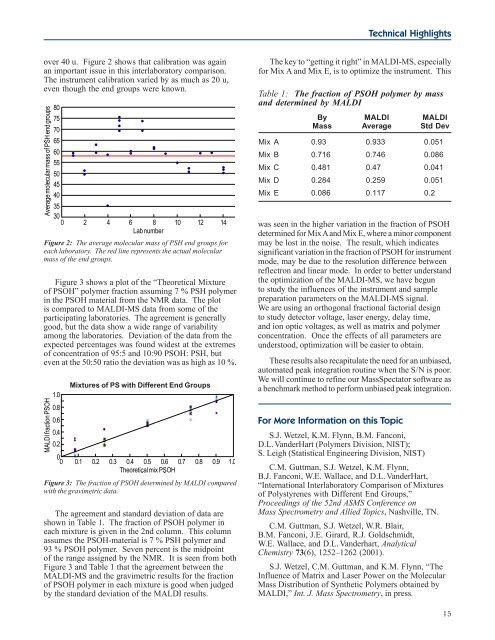
over 40 u. Figure 2 shows that calibration was again<br />
an important issue in this interlaboratory comparison.<br />
The instrument calibration varied by as much as 20 u,<br />
even though the end groups were known.<br />
Figure 2: The average molecular mass of PSH end groups for<br />
each laboratory. The red line represents the actual molecular<br />
mass of the end groups.<br />
Figure 3 shows a plot of the “Theoretical Mixture<br />
of PSOH” polymer fraction assuming 7 % PSH polymer<br />
in the PSOH material from the NMR data. The plot<br />
is compared to MALDI-MS data from some of the<br />
participating laboratories. The agreement is generally<br />
good, but the data show a wide range of variability<br />
among the laboratories. Deviation of the data from the<br />
expected percentages was found widest at the extremes<br />
of concentration of 95:5 <strong>and</strong> 10:90 PSOH: PSH, but<br />
even at the 50:50 ratio the deviation was as high as 10 %.<br />
Mixtures of PS with Different End Groups<br />
Figure 3: The fraction of PSOH determined by MALDI compared<br />
with the gravimetric data.<br />
The agreement <strong>and</strong> st<strong>and</strong>ard deviation of data are<br />
shown in Table 1. The fraction of PSOH polymer in<br />
each mixture is given in the 2nd column. This column<br />
assumes the PSOH-material is 7 % PSH polymer <strong>and</strong><br />
93 % PSOH polymer. Seven percent is the midpoint<br />
of the range assigned by the NMR. It is seen from both<br />
Figure 3 <strong>and</strong> Table 1 that the agreement between the<br />
MALDI-MS <strong>and</strong> the gravimetric results for the fraction<br />
of PSOH polymer in each mixture is good when judged<br />
by the st<strong>and</strong>ard deviation of the MALDI results.<br />
Technical Highlights<br />
The key to “getting it right” in MALDI-MS, especially<br />
for Mix A <strong>and</strong> Mix E, is to optimize the instrument. This<br />
Table 1: The fraction of PSOH polymer by mass<br />
<strong>and</strong> determined by MALDI<br />
By MALDI MALDI<br />
Mass Average Std Dev<br />
Mix A 0.93 0.933 0.051<br />
Mix B 0.716 0.746 0.086<br />
Mix C 0.481 0.47 0.041<br />
Mix D 0.284 0.259 0.051<br />
Mix E 0.086 0.117 0.2<br />
was seen in the higher variation in the fraction of PSOH<br />
determined for Mix A <strong>and</strong> Mix E, where a minor component<br />
may be lost in the noise. The result, which indicates<br />
significant variation in the fraction of PSOH for instrument<br />
mode, may be due to the resolution difference between<br />
reflectron <strong>and</strong> linear mode. In order to better underst<strong>and</strong><br />
the optimization of the MALDI-MS, we have begun<br />
to study the influences of the instrument <strong>and</strong> sample<br />
preparation parameters on the MALDI-MS signal.<br />
We are using an orthogonal fractional factorial design<br />
to study detector voltage, laser energy, delay time,<br />
<strong>and</strong> ion optic voltages, as well as matrix <strong>and</strong> polymer<br />
concentration. Once the effects of all parameters are<br />
understood, optimization will be easier to obtain.<br />
These results also recapitulate the need for an unbiased,<br />
automated peak integration routine when the S/N is poor.<br />
We will continue to refine our MassSpectator software as<br />
a benchmark method to perform unbiased peak integration.<br />
For More Information on this Topic<br />
S.J. Wetzel, K.M. Flynn, B.M. Fanconi,<br />
D.L. V<strong>and</strong>erHart (Polymers Division, <strong>NIST</strong>);<br />
S. Leigh (Statistical <strong>Engineering</strong> Division, <strong>NIST</strong>)<br />
C.M. Guttman, S.J. Wetzel, K.M. Flynn,<br />
B.J. Fanconi, W.E. Wallace, <strong>and</strong> D.L. V<strong>and</strong>erHart,<br />
“International Interlaboratory Comparison of Mixtures<br />
of Polystyrenes with Different End Groups,”<br />
Proceedings of the 52nd ASMS Conference on<br />
Mass Spectrometry <strong>and</strong> Allied Topics, Nashville, TN.<br />
C.M. Guttman, S.J. Wetzel, W.R. Blair,<br />
B.M. Fanconi, J.E. Girard, R.J. Goldschmidt,<br />
W.E. Wallace, <strong>and</strong> D.L. V<strong>and</strong>erhart, Analytical<br />
Chemistry 73(6), 1252–1262 (2001).<br />
S.J. Wetzel, C.M. Guttman, <strong>and</strong> K.M. Flynn, “The<br />
Influence of Matrix <strong>and</strong> Laser Power on the Molecular<br />
Mass Distribution of Synthetic Polymers obtained by<br />
MALDI,” Int. J. Mass Spectrometry, in press.<br />
15