WEB engleska verzija end.indd - UNDP Croatia
WEB engleska verzija end.indd - UNDP Croatia
WEB engleska verzija end.indd - UNDP Croatia
- No tags were found...

Create successful ePaper yourself
Turn your PDF publications into a flip-book with our unique Google optimized e-Paper software.
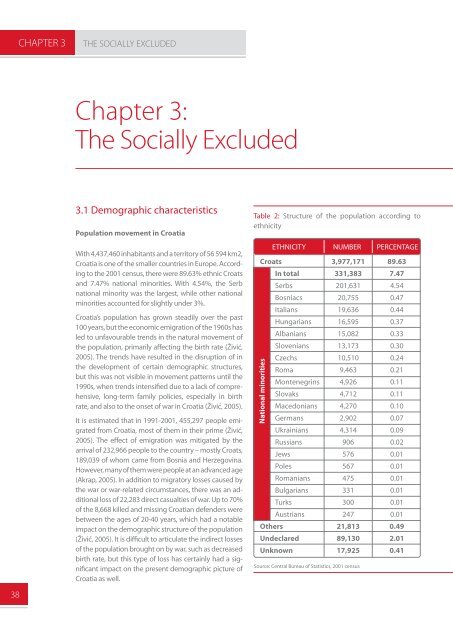
CHAPTER 3THE SOCIALLY EXCLUDEDChapter 3:The Socially Excluded383.1 Demographic characteristicsPopulation movement in <strong>Croatia</strong>With 4,437,460 inhabitants and a territory of 56 594 km2,<strong>Croatia</strong> is one of the smaller countries in Europe. Accordingto the 2001 census, there were 89.63% ethnic Croatsand 7.47% national minorities. With 4.54%, the Serbnational minority was the largest, while other nationalminorities accounted for slightly under 3%.<strong>Croatia</strong>’s population has grown steadily over the past100 years, but the economic emigration of the 1960s hasled to unfavourable tr<strong>end</strong>s in the natural movement ofthe population, primarily affecting the birth rate (Živić,2005). The tr<strong>end</strong>s have resulted in the disruption of inthe development of certain demographic structures,but this was not visible in movement patterns until the1990s, when tr<strong>end</strong>s intensified due to a lack of comprehensive,long-term family policies, especially in birthrate, and also to the onset of war in <strong>Croatia</strong> (Živić, 2005).It is estimated that in 1991-2001, 455,297 people emigratedfrom <strong>Croatia</strong>, most of them in their prime (Živić,2005). The effect of emigration was mitigated by thearrival of 232,966 people to the country – mostly Croats,189,039 of whom came from Bosnia and Herzegovina.However, many of them were people at an advanced age(Akrap, 2005). In addition to migratory losses caused bythe war or war-related circumstances, there was an additionalloss of 22,283 direct casualties of war. Up to 70%of the 8,668 killed and missing <strong>Croatia</strong>n def<strong>end</strong>ers werebetween the ages of 20-40 years, which had a notableimpact on the demographic structure of the population(Živić, 2005). It is difficult to articulate the indirect lossesof the population brought on by war, such as decreasedbirth rate, but this type of loss has certainly had a significantimpact on the present demographic picture of<strong>Croatia</strong> as well.Table 2: Structure of the population according toethnicityETHNICITYCroatsIn totalSerbsBosniacsItaliansHungariansAlbaniansSloveniansCzechsRomaMontenegrinsSlovaksMacedoniansGermansUkrainiansRussiansJewsPolesRomaniansBulgariansTurksAustriansOthersUndeclaredUnknownNational minoritiesNUMBER3,977,171331,383201,63120,75519,63616,59515,08213,17310,5109,4634,9264,7124,2702,9024,31490657656747533130024721,81389,13017,925Source: Central Bureau of Statistics, 2001 censusPERCENTAGE89.637.474.540.470.440.370.330.300.240.210.110.110.100.070.090.020.010.010.010.010.010.010.492.010.41