WEB engleska verzija end.indd - UNDP Croatia
WEB engleska verzija end.indd - UNDP Croatia
WEB engleska verzija end.indd - UNDP Croatia
- No tags were found...

You also want an ePaper? Increase the reach of your titles
YUMPU automatically turns print PDFs into web optimized ePapers that Google loves.
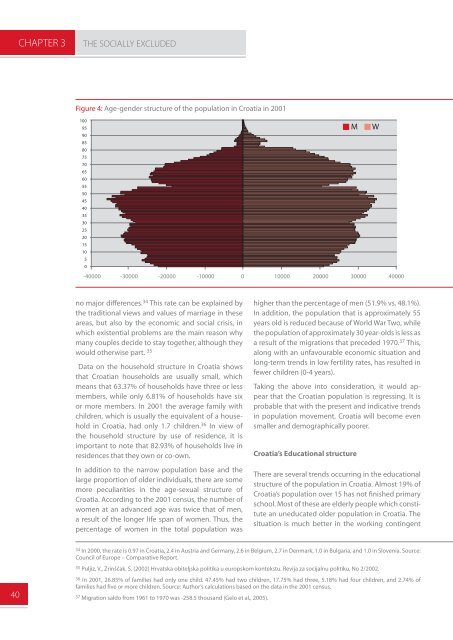
CHAPTER 3THE SOCIALLY EXCLUDEDFigure 4: Age-g<strong>end</strong>er structure of the population in <strong>Croatia</strong> in 200110095M W908580757065605550454035302520151050-40000 -30000 -20000 -10000 0 10000 20000 30000 40000no major differences. 34 This rate can be explained bythe traditional views and values of marriage in theseareas, but also by the economic and social crisis, inwhich existential problems are the main reason whymany couples decide to stay together, although theywould otherwise part. 35Data on the household structure in <strong>Croatia</strong> showsthat <strong>Croatia</strong>n households are usually small, whichmeans that 63.37% of households have three or lessmembers, while only 6.81% of households have sixor more members. In 2001 the average family withchildren, which is usually the equivalent of a householdin <strong>Croatia</strong>, had only 1.7 children. 36 In view ofthe household structure by use of residence, it isimportant to note that 82.93% of households live inresidences that they own or co-own.In addition to the narrow population base and thelarge proportion of older individuals, there are somemore peculiarities in the age-sexual structure of<strong>Croatia</strong>. According to the 2001 census, the number ofwomen at an advanced age was twice that of men,a result of the longer life span of women. Thus, thepercentage of women in the total population washigher than the percentage of men (51.9% vs. 48.1%).In addition, the population that is approximately 55years old is reduced because of World War Two, whilethe population of approximately 30 year-olds is less asa result of the migrations that preceded 1970. 37 This,along with an unfavourable economic situation andlong-term tr<strong>end</strong>s in low fertility rates, has resulted infewer children (0-4 years).Taking the above into consideration, it would appearthat the <strong>Croatia</strong>n population is regressing. It isprobable that with the present and indicative tr<strong>end</strong>sin population movement, <strong>Croatia</strong> will become evensmaller and demographically poorer.<strong>Croatia</strong>’s Educational structureThere are several tr<strong>end</strong>s occurring in the educationalstructure of the population in <strong>Croatia</strong>. Almost 19% of<strong>Croatia</strong>’s population over 15 has not finished primaryschool. Most of these are elderly people which constitutean uneducated older population in <strong>Croatia</strong>. Thesituation is much better in the working contingent34 In 2000, the rate is 0.97 in <strong>Croatia</strong>, 2.4 in Austria and Germany, 2.6 in Belgium, 2.7 in Denmark, 1.0 in Bulgaria, and 1.0 in Slovenia. Source:Council of Europe – Comparative Report.35 Puljiz, V., Zrinščak, S. (2002) Hrvatska obiteljska politika u europskom kontekstu. Revija za socijalnu politiku, No 2/2002.4036 In 2001, 26.85% of families had only one child. 47.45% had two children, 17.75% had three, 5.18% had four children, and 2.74% offamilies had five or more children. Source: Author’s calculations based on the data in the 2001 census.37 Migration saldo from 1961 to 1970 was -258.5 thousand (Gelo et al., 2005).