Biomechanikstudy_MRI_AKT-O_EN.pd - VACOped
Biomechanikstudy_MRI_AKT-O_EN.pd - VACOped
Biomechanikstudy_MRI_AKT-O_EN.pd - VACOped
- No tags were found...

Create successful ePaper yourself
Turn your PDF publications into a flip-book with our unique Google optimized e-Paper software.
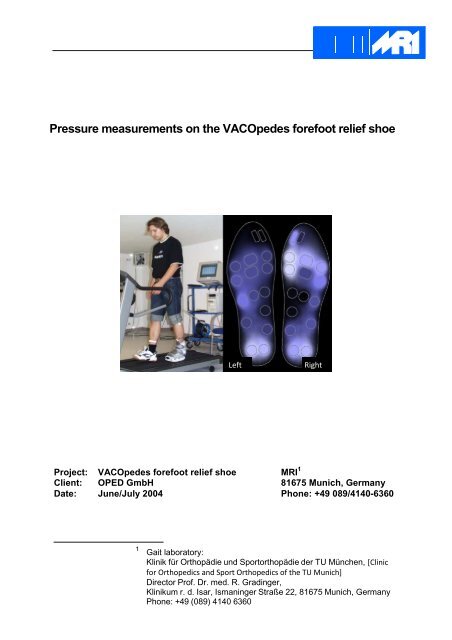
Pressure measurements on the <strong>VACOped</strong>es forefoot relief shoeLeftRightProject: <strong>VACOped</strong>es forefoot relief shoe <strong>MRI</strong> 1Client: OPED GmbH 81675 Munich, GermanyDate: June/July 2004 Phone: +49 089/4140-63601Gait laboratory:Klinik für Orthopädie und Sportorthopädie der TU München, [Clinicfor Orthopedics and Sport Orthopedics of the TU Munich]Director Prof. Dr. med. R. Gradinger,Klinikum r. d. Isar, Ismaninger Straße 22, 81675 Munich, GermanyPhone: +49 (089) 4140 6360
Pressure distribution measurement vacopedes 2004Table of ContentsPage1. Introduction............................................................................................ 3Plantar pressure distribution measurement............................................ 3Pressure distribution measurements in the shoe................................... 5Time series ...................... ..................................................................... 6Maximum pressure analysis.................................................................. 8Load analysis....................................................................................... 9Mathematical summary of load analysis.............................................. 122. Measurement results........................................................................... 143. Summary.............................................................................................. 194. List of measurements.......................................................................... 22Note:The most important results are summarized in thechapter Summary on pages 19 to 22.The previous chapters serve mainly to explain the measurement andevaluation procedure for the reader interested in the details.Page 2
Pressure distribution measurement vacopedes 20041 IntroductionIn this study, the load on the foot when walking at normal speed was examined,along with what change in the distribution of the load between the back foot and theforefoot different forefoot relief shoes cause. As measuring instruments, pressuremeasurement soles for insertion into the shoe were used. The load in these areascan be determined from the plantar pressure distribution on the sole of the footthrough integration across partial areas of the foot.Measurements were performed on a treadmill, with a measurement duration of 40seconds each. In this time, the test person took about 28 double steps, which werethen averaged out in the evaluation.Apart from normal walking, measurements were also taken walking half steps,walking up stairs and walking up stairs with half steps. These are not evaluatedfurther in this report, however.The forefoot relief shoes to be compared were:- <strong>VACOped</strong>es- <strong>VACOped</strong>es TC- Darco- Bledsoe diabetic boot- SneakersFor the measurements, the test person always wore a therapeutic shoe on onefoot and a sneaker on the other foot.Apart from forefoot relief, the use of such relief shoes for diabetics also requiresoptimal uniform pressure distribution.Plantar pressure distribution measurementThe entire gravity F (generated by the weight of the testperson and by inertia forces) is spread over the contactsurface of the foot sole to the floor. If you imagine thiscontact surface to be divided into small square segments,for example, then a small part of the full ground reactionforce is exerted on each of these segments.The value of the vertical force componentsper surface elementp = F ⊥is referred to as the pressure and specified in N/cm² 2 .AThe current force application point issimply the focal point of all partial forces.2Conversion factors for frequent pressure units:10 4 Pa = 0.1 bar = 1 N/cm 2 = 75.006 mmHg = 75.006 torrThe SI unit of pressure is the Pascal (Pa). N/cm 2 or mmHg are frequently used in the medical field.Fig. 1, schematic:Local distribution of forces onthe sole of the foot, theresulting total force and theforce application pointPage 3
Pressure distribution measurement vacopedes 2004The pressure distribution over the surface can be made visible with pressuredistribution measurement systems. In biomechanics, comprehensive measurementof the pressure distribution beneath the foot sole is common using measurementplatforms built into the floor and with inlay measurement soles. In the example inFig. 2, the patient walks over the platform barefoot.The pedogram of the test person in thisstudy is a typical pressure distributionpattern for an adult test person. (Evenwith completely healthy test persons,however, the pressure distributionpatterns can vary significantly.)Typical:• Course of the gait line starting at themiddle of the heel, with a slightlateral bend, ending between D1and D2, no break in the gait line(markings in Fig. 2bwalking forward smoothly)• Plane pressure distribution in theball area, individual metatarsalheads not visible, all toes visible• Pressure maxima on the heel,forefoot balls and big toe of similarintensity, values up to approx.40 N/cm² (pressure scale in thefigures), but dependent on the gaitspeed, low pressure values betweenheel and balls, no support in themedial middle foot area.Representation of pressure maximaFig. 2a, Pedogram, plantar pressure distribution when walking;Left: Pressure maxima,; Right: Derived parameter curves,pay special attention to the vertical force in the middle diagramFig. 2b, interpolated presentationPage 4
Pressure distribution measurement vacopedes 2004• Straight line from thecenter of the heel –ball of big toe – big toeFig. 2c, rolling of the foot picture by picture,measurement rate is 72 / full pressure distributionimages per secondPressure distribution measurements in the shoeFor the provision with orthopedic shoes, insoles etc., the measurement of thepressure distribution in the shoe is of course of crucial significance. In this study,pressure distribution measurements in the shoe were performed with Parotecpressure measurement insoles. These measurement soles are only equipped withpressure sensors in those areas corresponding to particularly loaded parts of the footsole. The two pressure measurement soles of the left and right foot each contain 16of these integrated hydrocells. The actual pressure sensors are piezoresistivesensors in the hydrocells. Fig. 3 shows the positions and sizes of the measurementcells in the soles. An obvious problem in these individual sensor systems is that theyare shaped for an average normal foot. If the foot shape is different, anatomicalstructures of the foot will possibly lie beyond or just between sensors and not beregistered by the measuring device. Systems with sensors covering a full area and asufficiently high number of individual sensors would be more suitable. For themeasurements for this study on the same test person, this does not present as manyproblems. To prevent the soles from shifting between measurements, these wereglued to the foot sole of the test person.The results of the first measurement (OPED01, cf. chapter Results), in which the testperson wears sneakers on both feet, show high symmetry between left and right, sothat a sufficient reproducibility of measurements in the same test person can beexpected.Page 5
Pressure distribution measurement vacopedes 2004LeftRightFig. 3, to scale: Size and position of the individual pressuresensors on pressure measurement soles. The sensors areconnected to a controller and a computer by wire. This way,the signals from the sensors can be read out in real timeover a practically unlimited period. The time resolution ofthe sensors is 1000 measurements per second.Fig. 4, pressure measurements with measurementinsoles in both shoes and wire connection to themeasurement computer.Fig. 5, single hydrocell with piezoresistive microsensor,wire connectionTime seriesFig. 6a shows the pressure profile for all 32 sensors over a measurement duration of40 seconds when walking up stairs. In Fig. 6b, a 5-second time frame from a differentmeasurement is enlarged. Now, the time sequence in the pressure profiles ofindividual sensors can be followed. In the course of ground contact, typically thesensors on the heels are loaded first, and then the sensors on the forefoot at the endof the ground contact. The highest pressure values occur at the heel, and on the ballsof the forefoot. In the middle foot area, the pressure values are in part very low.Page 6
Pressure distribution measurement vacopedes 2004Pressure [N/cm 2 ]Pressure [N/cm 2 ]SecondsSecondsLeft soleRight soleFig. 6a, pressure profile for all 32 sensors over a measurement duration of 40 seconds, walking up and down stairs.Sensors 1 to 16 (red) on the left measurement sole, sensors 17 to 32 on the right sole.0 to 5 seconds walking upstairs, turning, up to 11 seconds walking downstairs, turning, etc.Fig. 6b, 5-second time frame from a 40-second measurement on the treadmill.Page 7
Pressure distribution measurement vacopedes 2004Pressure [N/cm 2 ]Pressure [N/cm 2 ]10.0 seconds10.0 secondsLeft soleRight soleFig. 7, separation of measurement data into step sequences: When the heel makes contact with the floor,the floor contact phase begins (green marking) when the toes lift off from the floor, it ends again (red marking).Average values can subsequently be determined via individual floor contact phases.Maximum pressure analysisA method of data analysis (which can be applied in a similar manner for quitedifferent problems and measurement procedures, e.g. EMG measurements): thepressure curves are examined for the frequency of all pressure values that occur.During the 40-second measurement period, each pressure sensor is recorded40·400=16000 times: All measurement values are entered in a frequency registerwith a resolution of 0.1 N/cm² printing width. The larger the pressure variations, thewider and flatter the distribution (e.g. Fig. 8). The more constant the pressure, thenarrower and the more linear the distribution. The frequency distribution itself is thenexamined at its maximum points (blue and red markings in Fig. 8). To avoid theeffects of individual measurement ‘outliers’, not the absolute pressure maximum ofthe distribution is sought, but rather the value at which a certain percentage (1percent) of all measured values lies above the limit (cf. Fig. 9). Alternatively, thevalue could be chosen as the limit at which the distribution exceeds a certainpercentage of the overall maximum of the distribution.Page 8
Pressure distribution measurement vacopedes 2004Pressure area sensor 27Pressure area sensor 11Pressure [N/cm 2 ]FrequencyPressure [N/cm 2 ]Left soleRight soleSecondsFig. 8, to determine the frequency distribution of the pressure values of a measurement, each of the 16,000 measured pressurevalues (right) is entered in a count register (left). The upper limit is defined in the distribution. The frequency distribution isstandardized so that the surface lies below curve 1.Minimum of pressure distributionSurfaceUpper limitFig. 9, to determine the upper limit of the frequencydistribution for the measured pressure values of a sensor.m = 1The pressure range upper limits determined in this way are compared between theleft foot (test shoe) and the right foot (normal shoe) and between differenttherapeutic solutions for the left foot. These pressure values are reproduced aspressure distributions in Fig. 10 on the left. Fig. 7 on the right shows the plantarpressure distribution pattern of the test person for the measurements walkingbarefoot.Fig. 10, measured pressurevalues represented aspressure distribution pattern.Here: normal shoe on leftand right foot(measurement OPED01).Higher pressure values areshown as lighter shades.Far right: high-resolutionpressure distribution patternunder the sole of the footwhen walking barefoot,pressure maxima pattern(pressure scale on the right)Representation of pressure maximaPage 9
Pressure distribution measurement vacopedes 2004Load analysisCrucial for the further evaluation is the research problem at hand. In our case, weare interested in the suitability of various means of forefoot relief. The distribution ofthe overall load over the different areas of the foot is concentrated on the heel area,to provide relief to the forefoot.For the analysis, the pressure sensors are divided into four groups - the heel,middle foot, balls of the forefoot, big toe (cf. Fig. 11), and simplified further into twogroups, the back foot and forefoot (Fig. 12).Fig. 11, summary of pressure sensors for four groups, heel, middle foot,balls of forefoot, big toe.LeftRightFig. 12, summary of pressure sensors for two groups, back footand forefoot.LeftRightIf you rewind the sequence from Fig. 1 and the pressure distribution is againintegrated across individual areas of the foot, then you obtain the gravity exerted onthese selected areas (to be precise, the vertical component of the force, which is byfar the predominant part). In the case of a punctual measurement with individualpressure sensors, integration must take place not only across the area of the sensorsthemselves, but also over the blind areas between the sensors with an unknownamount of pressure. To simplify matters, you could consider each individual sensor tobe representative for its surroundings and assume that the pressure in this arearemains constant and is the same as the measured pressure of the sensor (Fig. 13).Page 10
Pressure distribution measurement vacopedes 2004Fig. 13, allocation of representativesurfaces to individual pressuresensors.LeftSensor Area (%)1 8.42 7.03 5.94 8.75 6.06 5.67 4.78 5.59 4.910 5.811 4.712 4.513 5.214 4.215 2.916 2.4in percentage of the overallsurface of a soleThis allocation of representative surfaces may be influenced by random factors,so that the gravity determined is probably not completely reliable. Because thepressure sensor lies in the center of its represented area, the actual averagepressure will in reality usually be less. Because of this, there is a tendency tooverestimate the gravity.To improve this procedure, an additional scaling factor is obtained from the graph forthe total force across all surface segments recorded for each foot. It is taken intoaccount here that the total force in the middle section of the ground contact phasecorresponds roughly to the known body weight of the test person. The test person forthe measurement in Fig. 14 has a body weight of 78 kg (780 N), the measurementon the other hand results in a weight of 1500 Nm, the corrective scaling factor istherefore 780 N / 1500 N = 0.52.Vertical force [N]RightAverage gravity =body weightFig. 14a, in the middle standing phase,the entire gravity in the middle shouldcorrespond to the body weight exactly. Ifthere is no weight standardization, thisresults in a weight that is too large by afactor of about 2 and a calibration factorof about 0.5.Phase with one leg on the ground onlyVertical force [N]SecondsAverage groundforce =body weightFig. 14b, gravity standardizedto the body weightSecondsPage 11
Pressure distribution measurement vacopedes 2004Mathematical summary of load analysis1. The sensor i measures the pressure p i (t) at each point in time t in thecourse of rolling the foot,2. Each individual pressure sensor i, is geometrically assigned a representativearea a i (cf. Fig. 13), pressure p i (t) times area a i results in the force exerted onthis partial area,3. The total force F total in the standing phase is determined by the body weightM of the test person (in kg)F total= M · g ,g = 9.8msec 24. The summation of the pressure values of all sensors multiplied by theirrepresented area must also result, in the middle part of the standing phase,in the body weight (cf. Fig. 14), and a scaling factor s is introduced for thispurpose so that:all _ sensorsF total= M · g = s · ∑ a i · p i(t)iand.:all _ sensorss = (M · g )/(∑a i · p i(t))i(since the total force also varies somewhat in the middle standing phase, anaverage value is formed),5. So that the load on partial areas of the foot sole can now be calculated foreach point in time t:Sensors in the partial areaF part(t ) = s · ∑ a i · p i (t )i6. If the partial force F part is integrated over the period of time of the groundcontact, this results in the overall load (the impulse K) in this area:Lifingt footK part= ∫ F part · dtt = Putting foot down7. The overall measurement time is divided into individual step cycles. Anaverage step cycle is formed from these individual sequences. This averagingout can in principle be performed at almost any point in the entire procedure:If it is for example performed straight after point 1, you will obtain averagepressure profiles for individual sensors.Page 12
Pressure distribution measurement vacopedes 2004Fig. 15, partial forces in the four foot areas from Fig. 11 in thecourse of rolling the foot.Vertical force [N]By means of the representative sensor areas described in Fig. 13,forces are first assigned to the pressure values of individualsensors and then added, via the groups, to the local gravity andvia the sole total area to the ‘total‘ vertical force.In the upper diagram, all individual step cycles are overlaid, andaverage force curves are formed in the four groups. In thesecond diagram, only the average curves are reproduced.The grayscale selection in the force curves is as follows: From theheel group to the toes, the gray value gradually becomes lighter,the total force curve is black.The total force curve corresponds roughly to the normal twin-peakprofile of the vertical force in the gait analysis, and the averagemaximum level corresponds to the body weight of the test person.Vertical force [N]SecondsVertical force [N]SecondsIn the third diagram, only two groups, the forefoot and the rearfoot, are defined as shown in Fig. 12, as well as the total forcecurve.To make things clearer, in the fourth diagram the areas below thecurves are colored in for the forefoot and rear foot(green = rear foot, pink = forefoot).In the red box at the top right, the sizes of the colored curve areasare listed (in force x time units, these are physical impulses inNewton seconds).Vertical force [N]SecondsIntegral values:272.2 Nsec286.9 NsecTotal559.2 NsecGreen areas therefore represent rear foot load,red areas represent forefoot load.Vertical force [N]SecondsIntegral values:373.8 Nsec111.7 NsecThe final diagram shows a corresponding measurement on aforefoot relief shoe: compared to the normal shoe in the previousdiagram, the load has clearly shifted towards the heel.Total495.5 NsecVACOPEDESSecondsPage 13
Pressure distribution measurement vacopedes 20042 Measurement resultsWalking on the treadmill, 3 km/hMeasurementOPED01, sneakers(left and right sole)Vertical force [N]Integral values:169.9 Nsec102.3 Nsec257.8 Nsec29.1 NsecTotal559.2 NsecVertical force [N]SecondsLeftRightIntegral values:272.2 NsecLeft286.9 Nsec243.2 NsecRight324.9 NsecTotalLeft 559.2 NsecRight 568.1 NsecPressure distribution pattern:High symmetry between theright and left sole, pressure onheel and forefoot of similarintensity, low pressure in middlefoot area (cf. Fig. 10).SecondsTop diagram: Only left sole, four sensor groups (heel, middle foot,balls of forefoot, big toe and the overall curve).Bottom diagram: Only two sensor groups (rear foot and forefoot),with the representation of the two feet superimposed. Only slightdeviations in the curves between left and right. Proportion of rearfoot load to forefoot load on average at approx.: 45% to 55%(The grayscale selection in the diagrams is as following: from the heel group tothe toes, the gray value gradually becomes lighter, the total curve is black.)The high symmetry of the measurement results of both pressure distribution and load analysisbetween the left and right foot shows that the measurement method, despite misgivings in terms ofmeasurement precision, is quite sufficient for the requirements of the research problem of this study.Page 14
Pressure distribution measurement vacopedes 2004OPED05, <strong>VACOped</strong>es(left sole, normal shoe on the right)Vertical force [N]Integral values:211.0 Nsec162.7 Nsec110.9 Nsec0.8 NsecTotal:485.5 NsecVertical force [N]SecondsIntegral values:373.8 Nsec111.7 NsecTotal:485.5 NsecLeftRightThe pressure distribution on the leftis more equally spread than with thenormal shoe on the right; no pressureon the big toe; the pressure focalpoint is on the heel.The pressure distribution with thenormal shoe (on the right) ismaintained, with increased medialload on the balls of the forefoot.SecondsThe proportion of the rear footload to the forefoot load is at: 77% to 23%OPED09, Darco(left sole, right normal shoe)Vertical force [N]Integral values:219.4 Nsec73.7 Nsec176.2 Nsec3.4 NsecTotal:472.7 NsecVertical force [N]SecondsIntegral values:293.4 Nsec179.8 NsecTotal:473.2 NsecLeftRightThe pressure distribution on theforefoot on the left is more equallyspread than with the normal shoe onthe right; no pressure on the big toe;considerably increased pressurefocal point on heel.Difference from the <strong>VACOped</strong>: thereis no medial ground contact of thefoot in the middle of the foot.The pressure distribution with thenormal shoe (on the right) ismaintained, as is on the balls of theforefoot with increased medial load.SecondsWith the Darco, the shift to the rear foot is smaller than with the<strong>VACOped</strong>es, the proportion of the rear foot load to forefoot loadlies at 62% to 38%Page 15
Pressure distribution measurement vacopedes 2004OPED13, <strong>VACOped</strong> TC(left sole, right normal shoe)Vertical force [N]Integral values:220.7 Nsec145.4 Nsec110.3 Nsec0.5 NsecTotal:476.9 NsecVertical force [N]SecondsIntegral values:366.2 Nsec110.8 NsecLeftRightTotal:476.9 NsecThe pressure distribution on theleft is even more equally spreadthan in the <strong>VACOped</strong>; nopressure on the big toe; pressurefocal point on heel.The pressure distribution in thenormal shoe (on the right) ismaintained, the medial load on theballs of the forefoot increased.SecondsWith the <strong>VACOped</strong>es TC the proportion of rear foot load to forefootload is exactly the same as with the <strong>VACOped</strong>: 77% to 23%OPED17, Bledsoe diabetic boot(right sole, normal shoe on the left)Vertical force [N]Integral values:239.0 Nsec121.8 Nsec101.4 Nsec11.3 NsecTotal:473.6 NsecVertical force [N]SecondsIntegral values:360.8 Nsec112.8 NsecTotal:473.6 NsecVery low pressure maxima on theright, not quite as evenly distributedas with the <strong>VACOped</strong> TC.Normal shoe on the left again witha slightly increased medial ballload; slight distal increase ofpressure in the forefoot area.SecondsBledsoeDiabetics bootWith the Bledsoe diabetic boot, the proportion of rear foot load toforefoot load is almost the same as with the <strong>VACOped</strong>es and the<strong>VACOped</strong>es TC: 76% t o 24%Page 16
Pressure distribution measurement vacopedes 2004OPED02, sneaker + tapeAs a comparison:(left sole)Measurement OPED01LeftRightLeftRight(the two defectiveheel sensors on theleft were set to 0!)No clear change because ofthe tape.OPED25, <strong>VACOped</strong>es + tape(left sole)As a comparisonMeasurement OPED05, <strong>VACOped</strong>es without tapeLeft Right Left Right(the two defectiveheel sensors on theleft were set to 0!)Only small changes in pressuredistribution because of the tape.Page 17
Pressure distribution measurement vacopedes 2004OPED31, Darco + tape(left sole)Vertical force [N]Integral values:202.2 Nsec79.0 Nsec165.8 Nsec6.1 NsecTotal:453.1 NsecSecondsVertical force [N]Integral values:281.2 Nsec171.9 NsecTotal:453.1 NsecLeftRightWithout tape:SecondsThe proportion of the rear foot load to the forefoot load remains at:62% to 38%There is also practically no change to the curve progression.LeftRightpractically no changes inpressure distribution becauseof the tape.Page 18
Pressure distribution measurement vacopedes 20043. SummaryWith pressure measurement soles for insertioninto the shoe, the pressure distribution at the footsole was examined during normal walking. Fromthis, the load was calculated in selected areas ofthe foot, defined as the product from the amountof the force (in Newton [N]) times the duration(in seconds [sec]) of the force (this is in eachcase the area under the curves shown in thesubsequent diagrams in [Nsec], in a physicalsense, this is a so-called impulse). All curves areaveraged out over a measurement time of40 seconds (about 28 double steps).Below, the foot surface is always divided intotwo parts, as shown in the figure on the right,forefoot (assigned color: purple) and rear foot(assigned color: green).LeftRightDividing the pressure sensors into two groups:rear foot and forefoot sensors.The following diagrams each show the profile of the force on the rear foot andforefoot and the total force from the first contact with the ground (t = 0 seconds) untilthe toes lift off the ground.For all therapeutic shoes, the duration of ground contact is shorter than fornormal shoes, probably due to the reduced plantar flexion possibility in the heelduring the push-off phase.In the normal shoe, theproportion of the rear footload to forefoot load onaverage lies at approx.45% to 55%.Vertical force [N]Healthy testpersonStandard shoeIntegral values:left 272.2 Nsec286.9 Nsecright 243.2 Nsec324.9 NsecTotal:left 559.2 Nsecright 568.1 NsecThe forefoot load isconsequently higher thanthe rear foot load.(In the diagram on theright, the proportions arereproduced for both feet).SecondsPage 19
Pressure distribution measurement vacopedes 2004With the <strong>VACOped</strong>es, theload considerably shifts tothe rear foot, the proportionof the rear foot load toforefoot load lies at77% to 23%.Vertical force [N]Integral values:373.8 Nsec111.7 NsecTotal:485.5 NsecWith the Darco, the shiftto the rear foot is smallerthan with the <strong>VACOped</strong>es,the proportion of the rearfoot load to forefoot loadlies at 62% to 38%.Vertical force [N]SecondsIntegral values:293.4 Nsec179.8 NsecTotal:473.2 NsecIn a series of experiments,the ankle of the testperson was additionallytaped. The loadproportions were notmeasurably changed bythis. In the example withthe Darco, the proportionof the rear foot load to theforefoot load remains at62% to 38%.Vertical force [N]SecondsSecondsIntegral values:281.2 Nsec171.9 NsecTotal:453.1 NsecThere is practically no changeto the curve progression.With the <strong>VACOped</strong>es TC,the proportion of the rearfoot load to forefoot load isexactly the same as withthe <strong>VACOped</strong>es:77% to 23%.Vertical force [N]Integral values:366.2 Nsec110.8 NsecTotal:476.9 NsecEven until the very end ofcontact with the ground, theload in the rear foot area isalways higher than that in theforefoot here.SecondsPage 20
Pressure distribution measurement vacopedes 2004With the Bledsoe diabeticboot, the proportion of therear foot load to forefootload is almost the same aswith the <strong>VACOped</strong>es andthe <strong>VACOped</strong>es TC:76% to 24%.Vertical force [N]Integral values:360.8 Nsec112.8 NsecTotal:473.6 NsecBledsoeDiabetic bootThe following diagrams again present the numerical results in an overview:Load proportions when dividing the foot into 4 areas:SecondsPercentagePercentage2818Load proportions rear foot to forefoot4964346 46163730HeelMetatarsal (%)Fore foot ball (%)Big toe5026Percentage Prozentanteil100%90%80%70%60%50%40%30%20%10%0%Load proportions rear foot to forefootHeel middle foot balls of forefoot big toeLoad proportions when dividing the foot into two areas (rear foot and forefoot).The proportion of the rear foot in the total load is shown in green,that of the forefoot in red:100908070605040302010010090807060504030201004555Load proportions rear foot to forefoot77623823 23 247776Rear footForefoot100%90%80%70%60%50%40%30%20%10%0%Load proportions rear foot to forefootRear footForefootOf the four therapeutic shoes, only the Darco falls slightly out of line, since it allowsless load to be taken up in the middle foot, which also means less relief for theforefoot.Page 21
Pressure distribution measurement vacopedes 20044. List of measurementsOn the left foot (with a sneaker worn on the right foot in each case)FileSneakerSneakerSneakerSneakerNormal walkingWalking half stepsStairsStairs, half steps3 km/h2 km/hOPED01OPED02OPED03OPED04<strong>VACOped</strong>es<strong>VACOped</strong>es<strong>VACOped</strong>eDarcoDarcoDarcoDarcoNormal walkingWalking half stepsStairsStairs, half stepsNormal walkingWalking half stepsStairsStairs, half steps3 km/h2 km/h3 km/h2 km/hOPED05OPED06OPED07OPED08OPED09OPED10OPED11OPED12<strong>VACOped</strong>TC<strong>VACOped</strong>TC<strong>VACOped</strong>Bledsoe diabetic bootBledsoe diabetic bootBledsoe diabetic bootBledsoe diabetic bootNormal walkingWalking half stepsStairsStairs, half stepsNormal walkingWalking half stepsStairsStairs, half steps3 km/h2 km/h3 km/h2 km/hOPED13OPED14OPED15OPED16OPED17OPED18OPED19OPED20Sneaker + tapeSneaker + tapeSneaker + tapeSneaker + tapeNormal walkingWalking half stepsStairsStairs, half steps3 km/h2 km/hOPED21OPED22OPED23OPED24<strong>VACOped</strong>es +tape <strong>VACOped</strong>es+ tape<strong>VACOped</strong>es +tape <strong>VACOped</strong>esNormal walkingWalking half stepsStairsStairs, half steps3 km/h2 km/hOPED25OPED26OPED27OPED28<strong>VACOped</strong>es + tape + vented Normal walking 3 km/h OPED29<strong>VACOped</strong>es + tape + vented Walking half steps 2 km/h OPED30Darco + tapeDarco + tapeNormal walkingWalking half steps3 km/h2 km/hOPED31OPED32Dipl. Phys. Jürgen MitternachtOrthopädische Abteilung des Klinikums r. d. Isar der Technischen Universität München[Clinic for Orthopedics and Sport Orthopedics of the TU Munich]-Gait laboratory-Ismaninger Str. 22, 81675, Munich, GermanyPhone: + 49 (089) 4140-6360E-mail: Juergen.Mitternacht@lrz.tu-muenchen.dePage 22