Biomechanikstudy_MRI_AKT-O_EN.pd - VACOped
Biomechanikstudy_MRI_AKT-O_EN.pd - VACOped
Biomechanikstudy_MRI_AKT-O_EN.pd - VACOped
- No tags were found...

Create successful ePaper yourself
Turn your PDF publications into a flip-book with our unique Google optimized e-Paper software.
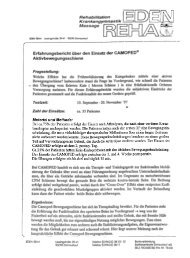
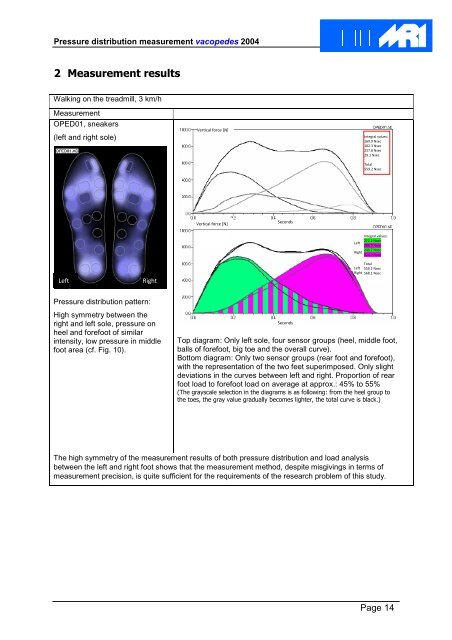
Pressure distribution measurement vacopedes 20042 Measurement resultsWalking on the treadmill, 3 km/hMeasurementOPED01, sneakers(left and right sole)Vertical force [N]Integral values:169.9 Nsec102.3 Nsec257.8 Nsec29.1 NsecTotal559.2 NsecVertical force [N]SecondsLeftRightIntegral values:272.2 NsecLeft286.9 Nsec243.2 NsecRight324.9 NsecTotalLeft 559.2 NsecRight 568.1 NsecPressure distribution pattern:High symmetry between theright and left sole, pressure onheel and forefoot of similarintensity, low pressure in middlefoot area (cf. Fig. 10).SecondsTop diagram: Only left sole, four sensor groups (heel, middle foot,balls of forefoot, big toe and the overall curve).Bottom diagram: Only two sensor groups (rear foot and forefoot),with the representation of the two feet superimposed. Only slightdeviations in the curves between left and right. Proportion of rearfoot load to forefoot load on average at approx.: 45% to 55%(The grayscale selection in the diagrams is as following: from the heel group tothe toes, the gray value gradually becomes lighter, the total curve is black.)The high symmetry of the measurement results of both pressure distribution and load analysisbetween the left and right foot shows that the measurement method, despite misgivings in terms ofmeasurement precision, is quite sufficient for the requirements of the research problem of this study.Page 14