Biomechanikstudy_MRI_AKT-O_EN.pd - VACOped
Biomechanikstudy_MRI_AKT-O_EN.pd - VACOped
Biomechanikstudy_MRI_AKT-O_EN.pd - VACOped
- No tags were found...

Create successful ePaper yourself
Turn your PDF publications into a flip-book with our unique Google optimized e-Paper software.
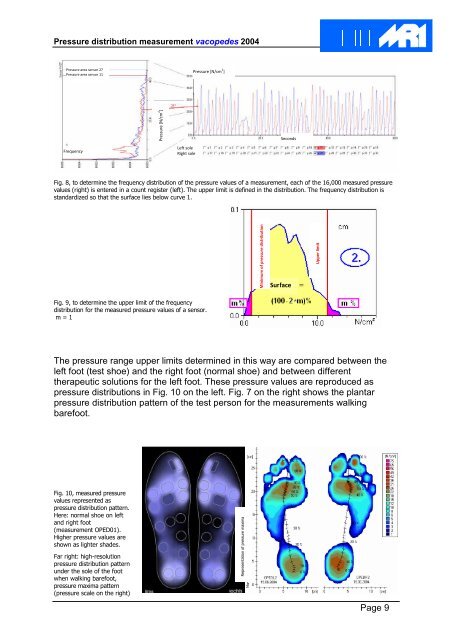
Pressure distribution measurement vacopedes 2004Pressure area sensor 27Pressure area sensor 11Pressure [N/cm 2 ]FrequencyPressure [N/cm 2 ]Left soleRight soleSecondsFig. 8, to determine the frequency distribution of the pressure values of a measurement, each of the 16,000 measured pressurevalues (right) is entered in a count register (left). The upper limit is defined in the distribution. The frequency distribution isstandardized so that the surface lies below curve 1.Minimum of pressure distributionSurfaceUpper limitFig. 9, to determine the upper limit of the frequencydistribution for the measured pressure values of a sensor.m = 1The pressure range upper limits determined in this way are compared between theleft foot (test shoe) and the right foot (normal shoe) and between differenttherapeutic solutions for the left foot. These pressure values are reproduced aspressure distributions in Fig. 10 on the left. Fig. 7 on the right shows the plantarpressure distribution pattern of the test person for the measurements walkingbarefoot.Fig. 10, measured pressurevalues represented aspressure distribution pattern.Here: normal shoe on leftand right foot(measurement OPED01).Higher pressure values areshown as lighter shades.Far right: high-resolutionpressure distribution patternunder the sole of the footwhen walking barefoot,pressure maxima pattern(pressure scale on the right)Representation of pressure maximaPage 9