Biomechanikstudy_MRI_AKT-O_EN.pd - VACOped
Biomechanikstudy_MRI_AKT-O_EN.pd - VACOped
Biomechanikstudy_MRI_AKT-O_EN.pd - VACOped
- No tags were found...

You also want an ePaper? Increase the reach of your titles
YUMPU automatically turns print PDFs into web optimized ePapers that Google loves.
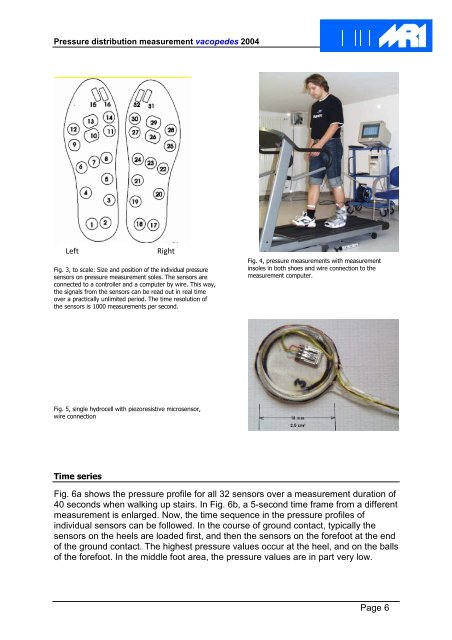
Pressure distribution measurement vacopedes 2004LeftRightFig. 3, to scale: Size and position of the individual pressuresensors on pressure measurement soles. The sensors areconnected to a controller and a computer by wire. This way,the signals from the sensors can be read out in real timeover a practically unlimited period. The time resolution ofthe sensors is 1000 measurements per second.Fig. 4, pressure measurements with measurementinsoles in both shoes and wire connection to themeasurement computer.Fig. 5, single hydrocell with piezoresistive microsensor,wire connectionTime seriesFig. 6a shows the pressure profile for all 32 sensors over a measurement duration of40 seconds when walking up stairs. In Fig. 6b, a 5-second time frame from a differentmeasurement is enlarged. Now, the time sequence in the pressure profiles ofindividual sensors can be followed. In the course of ground contact, typically thesensors on the heels are loaded first, and then the sensors on the forefoot at the endof the ground contact. The highest pressure values occur at the heel, and on the ballsof the forefoot. In the middle foot area, the pressure values are in part very low.Page 6