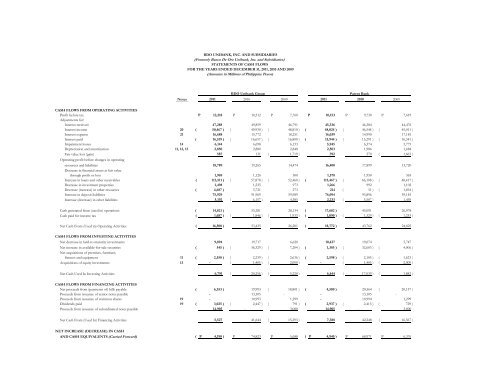
<strong>BDO</strong> UNIBANK, INC. AND SUBSIDIARIES(Formerly Banco De Oro Unibank, Inc. and Subsidiaries)STATEMENTS OF CASH FLOWSFOR THE YEARS ENDED DECEMBER 31, 2011, 2010 AND 2009(Amounts in Millions of Philippine Pesos)<strong>BDO</strong> Unibank GroupParent BankNotes 2011 2010 2009 2011 20102009CASH FLOWS FROM OPERATING ACTIVITIESProfit before tax P 12,218 P 10,512 P 7,760 P 10,153 P 9,730 P7,619Adjustments for:Interest received 47,288 49,859 46,791 45,336 46,384 44,476Interest income 20 ( 50,467 ) ( 49,930 ) ( 48,810 ) ( 48,024 ) ( 46,544 ) (45,011 )Interest expense 21 16,688 15,772 18,251 16,039 14,990 17,181Interest paid ( 16,519 ) ( 16,657 ) ( 16,800 ) ( 15,944 ) ( 15,291 ) (16,341 )Impairment losses 14 6,144 6,698 6,153 5,945 6,374 5,775Depreciation and amortization 11, 12, 13 2,850 2,880 2,848 2,503 1,986 1,684Fair value loss (gain) 587 131 ( 1,719 )392 270 (1,663 )Operating profit before changes in operatingresources and liabilities 18,789 19,265 14,474 16,400 17,899 13,720Decrease in financial assets at fair valuethrough profit or loss 1,969 1,126 300 1,578 1,950 563Increase in loans and other receivables ( 113,511 ) ( 57,878 ) ( 52,460 ) ( 115,467 ) ( 66,108 ) (48,417 )Decrease in investment properties 1,498 1,235 973 1,266 992 1,102Decrease (increase) in other resources ( 4,687 )5,721 273 214 ( 31 ) (1,494 )Increase in deposit liabilities 75,929 91,969 59,989 76,094 95,896 59,145Increase (decrease) in other liabilities 5,192 ( 6,157 )4,585 2,233 ( 5,507 )1,459Cash generated from (used in) operations ( 14,821 )55,281 28,134 ( 17,682 )45,091 26,078Cash paid for income tax ( 1,687 ) ( 1,846 ) ( 1,933 ) ( 1,090 ) ( 1,329 ) (1,253 )Net Cash From (Used in) Operating Activities ( 16,508 )53,435 26,201 ( 18,772 )43,762 24,825CASH FLOWS FROM INVESTING ACTIVITIESNet decrease in held-to-maturity investments 9,894 19,717 6,620 10,427 19,074 5,747Net increase in available-for-sale securities ( 545 ) ( 36,329 ) ( 7,204 ) ( 1,385 ) ( 32,603 ) (4,006 )Net acquisitions of premises, furniture,fixtures and equipment 11 ( 2,558 ) ( 2,239 ) ( 2,636 ) ( 2,598 ) ( 2,105 ) (1,623 )Acquisitions of equity investments 13 - ( 1,405 ) ( 2,000 )- ( 1,405 ) (2,000 )Net Cash Used In Investing Activities 6,791 ( 20,256 ) ( 5,<strong>22</strong>0 )6,444 ( 17,039 ) (1,882 )CASH FLOWS FROM FINANCING ACTIVITIESNet proceeds from (payments of) bills payable ( 6,353 )19,993 ( 18,801 ) ( 4,580 )20,564 (20,137 )Proceeds from issuance of senior notes payable - 13,105 - - 13,105 -Proceeds from issuance of common shares 19 - 10,993 1,299 - 10,994 1,299Dividends paid 19 ( 3,025 ) ( 2,447 ) ( 791 ) ( 2,937 ) ( 2,415 ) (729 )Proceeds from issuance of subordinated notes payable 14,905 - 3,000 14,905 - 3,000Net Cash From (Used In) Financing Activities 5,527 41,644 ( 15,293 )7,388 42,248 (16,567 )NET INCREASE (DECREASE) IN CASHAND CASH EQUIVALENTS (Carried Forward) ( P 4,190 ) P 74,823 P 5,688 ( P 4,940 ) P 68,971 P6,376
- 2 -<strong>BDO</strong> Unibank GroupParent BankNotes 2011 2010 2009 2011 2010 2009NET INCREASE (DECREASE) IN CASHAND CASH EQUIVALENTS (Brought Forward) ( P 4,190 ) P 74,823 P 5,688 ( P 4,940 ) P 68,971 P6,376CASH AND CASH EQUIVALENTS AT BEGINNING OF YEARCash and other cash items 7 26,673 30,544 21,770 26,660 30,365 21,763Due from Bangko Sentral ng Pilipinas 7 138,482 64,833 62,669 129,718 62,864 59,940Due from other banks 8 21,777 16,732 17,102 20,433 14,611 14,881Interbank call loans receivable - - 4,880 - - 4,880186,932 112,109 106,421 176,811 107,840 101,464CASH AND CASH EQUIVALENTS AT END OF YEARCash and other cash items 7 33,129 26,673 30,544 33,102 26,660 30,365Due from Bangko Sentral ng Pilipinas 7 124,894 138,482 64,833 115,992 129,718 62,864Due from other banks 8 24,719 21,777 16,732 <strong>22</strong>,777 20,433 14,611P 182,742 P 186,932 P 112,109 P 171,871 P 176,811 P 107,840Supplemental Information on Noncash Financing and Investing ActivitiesThe following are the significant noncash transactions:a. In 2011, the Parent Bank agreed to transfer, cede, and convey absolutely to SM Keppel Land, Inc. (SM Keppel)the outstanding advances totalling P364 recognized as part of Other receivables from customers under Loans andOther Receivables in exchange for 36,401,500 preferred shares for a subscription price of P364 (see Notes 10 and 13).b. On April 30, 2011, the Board of Directors approved the five-way merger (the Merger) of wholly-owned subsidiaries:<strong>BDO</strong> Strategic Holdings, Inc. (<strong>BDO</strong>SHI), Equitable Card Network, Inc., EBC Strategic Holdings Corporation (ESHC),<strong>BDO</strong> Technology Center, Inc. and Strategic Property Holdings, Inc. with <strong>BDO</strong>SHI as the surviving corporation. The Mergerwas approved by the BSP and the SEC on November 29, 2011 and on December 29, 2011, respectively. As a considerationfor the Merger, the Bank invested additional P4,580 in <strong>BDO</strong>SHI through dacion en pago by ESHC of its 3,621,159 preferredshares and 2,000,001 common shares and conversion of advances to the subsidiaries (see Note 13).c. In 2010, the <strong>BDO</strong> Unibank Group and the Parent Bank participated in the Global Bond Exchange by exchangingRepublic of the Philippines (ROP) bonds booked under Financial Assets at Fair Value through Profit or Loss (FVTPL)amounting to US$1.3 million of the Parent Bank (see Note 9.01) and Held-to-maturity (HTM) Investments amounting toUS$111.5 million and US$75.4 million of the <strong>BDO</strong> Unibank Group and Parent Bank, respectively (see Note 9.3). Thisresulted to a gain of P1 for FVTPL shown as part of Trading gain - net under Other Operating Income (see Note <strong>22</strong>)and P824 and P728 for HTM by the <strong>BDO</strong> Unibank Group and Parent Bank, respectively, shown as part of UnearnedIncome under Other Liabilities (see Note 18).See Notes to Financial Statements.
- Page 1 and 2:
Via ODiSyMarch 22, 2012PHILIPPINE S
- Page 3:
SEC FORM 17-A
- Page 6 and 7:
TABLE OF CONTENTSPage No.PART I- BU
- Page 8 and 9:
Philippine Subsidiaries% Interest H
- Page 10 and 11:
sophisticated investors. The Bank
- Page 12:
(v)Transactions with and/or Depende
- Page 16 and 17:
BDO BANK-OWNED PROPERTIES UTILIZED
- Page 18 and 19:
BDO BANK-OWNED PROPERTIES UTILIZED
- Page 20 and 21:
2) Leased PropertiesThe Group lease
- Page 22 and 23:
Branch Address Lease Lease ExpiryEf
- Page 24 and 25:
Branch Address Lease Lease ExpiryEf
- Page 26 and 27:
Branch Address Lease Lease ExpiryEf
- Page 28 and 29:
Branch Address Lease Lease ExpiryEf
- Page 30 and 31:
Branch Address Lease Lease ExpiryEf
- Page 32 and 33:
Branch Address Lease Lease ExpiryEf
- Page 34 and 35:
Branch Address Lease Lease ExpiryEf
- Page 36 and 37:
Branch Address Lease Lease ExpiryEf
- Page 38 and 39:
Branch Address Lease Lease ExpiryEf
- Page 40 and 41:
Branch Address Lease Lease ExpiryEf
- Page 42 and 43:
Item 4. Submission of Matters to a
- Page 44 and 45:
On 29 January 2011, the Board of th
- Page 46 and 47: Total Equity grew by 9% to P97.0 bi
- Page 48 and 49: Balance Sheet - 2010 vs. 2009Total
- Page 50 and 51: Comprehensive Income - For the year
- Page 52 and 53: Item 7. Financial StatementsThe con
- Page 54 and 55: UOB Singapore. He was formerly the
- Page 56 and 57: Director of the Philippine Global C
- Page 58 and 59: Name Age PositionInvestments GroupG
- Page 60 and 61: Antonio N. Cotoco, 63, is Senior Ex
- Page 62 and 63: Bienvenido M. Juat, Jr., 58, is Exe
- Page 64 and 65: Ma. Ophelia Ll. Camiña, 58, is Sen
- Page 66 and 67: Corporation; a Trustee of PCI Bank
- Page 68 and 69: Dalmacio D. Martin, 50, is Senior V
- Page 70 and 71: Luis S. Reyes, Jr., 54, is Senior V
- Page 72 and 73: Equitable Banking Corporation in Ju
- Page 74 and 75: The above compensation includes the
- Page 76 and 77: Title ofClassName of BeneficialOwne
- Page 78 and 79: esponsible for the setting up of th
- Page 80 and 81: 2 May 2011 Retirement of Ms. Nenita
- Page 82: Setting the annual shareholders’
- Page 87: AUDITED FINANCIAL STATEMENTSDECEMBE
- Page 93 and 94: BDO UNIBANK, INC. AND SUBSIDIARIES(
- Page 95: - 2 -Net UnrealizedFair ValueGains
- Page 99 and 100: 1.02 Approval of Financial Statemen
- Page 101 and 102: - 4 -Parent BankFRSP Difference PFR
- Page 103 and 104: - 6 -(ii) Philippine Interpretation
- Page 105 and 106: - 8 -• PFRS 7 (Amendment), Financ
- Page 107 and 108: - 10 -(v) PFRS 9, Financial Instrum
- Page 109 and 110: - 12 -The financial statements of s
- Page 111 and 112: - 14 -2.06 Financial AssetsFinancia
- Page 113 and 114: - 16 -HTM investments consist of go
- Page 115 and 116: - 18 -The value produced by a model
- Page 117 and 118: - 20 -2.12 Premises, Furniture, Fix
- Page 119 and 120: - 22 -Deposit liabilities and other
- Page 121 and 122: - 24 -2.20 Revenue and Expense Reco
- Page 123 and 124: - 26 -Provisions are measured at th
- Page 125 and 126: - 28 -Future cash flows in a group
- Page 127 and 128: - 30 -Foreign exchange gains and lo
- Page 129 and 130: - 32 -(e)Executive Stock Option Pla
- Page 131 and 132: - 34 -3.01 Critical Management Judg
- Page 133 and 134: - 36 -3.02 Key Sources of Estimatio
- Page 135 and 136: - 38 -(iv) Loans and Other Receivab
- Page 137 and 138: - 40 -Parent BankNotes Level 1 Leve
- Page 139 and 140: - 42 -The retirement benefit asset
- Page 141 and 142: - 44 -• It then disseminates the
- Page 143 and 144: - 46 -2010MoreOne to than three Mor
- Page 145 and 146: - 48 -2010MoreOne to than three Mor
- Page 147 and 148:
- 50 -Parent Bank2011 2010ForeignFo
- Page 149 and 150:
- 52 -BDO Unibank Group2010More Mor
- Page 151 and 152:
- 54 -Parent Bank2010More MoreOne t
- Page 153 and 154:
- 56 -A summary of the VaR position
- Page 155 and 156:
- 58 -Parent BankImpact onImpact on
- Page 157 and 158:
- 60 -b. SubstandardAccounts classi
- Page 159 and 160:
- 62 -BDO Unibank Group2010Loans an
- Page 161 and 162:
- 64 -Parent Bank2010Loans andTradi
- Page 163 and 164:
- 66 -4.02.04.03 Concentrations of
- Page 165 and 166:
- 68 -5. SEGMENT REPORTINGThe BDO U
- Page 167 and 168:
- 70 -Commercial Investment Private
- Page 169 and 170:
- 72 -At Amortized Carrying FairCos
- Page 171 and 172:
- 74 -8. DUE FROM OTHER BANKSThe ba
- Page 173 and 174:
- 76 -The aggregate contractual or
- Page 175 and 176:
- 78 -The fair values of government
- Page 177 and 178:
- 80 -The fair values are determine
- Page 179 and 180:
- 82 -Reclassification of CLNs from
- Page 181 and 182:
- 84 -Per MORB, non-performing loan
- Page 183 and 184:
- 86 -Leasehold Furniture,Rights an
- Page 185 and 186:
- 88 -Land Buildings TotalJanuary 1
- Page 187 and 188:
- 90 -Real and other properties acq
- Page 189 and 190:
- 92 -The BDO Unibank Group’s sub
- Page 191 and 192:
- 94 -Full allowance for impairment
- Page 193 and 194:
- 96 -This account is composed of t
- Page 195 and 196:
- 98 -The breakdown of this account
- Page 197 and 198:
- 100 -On October 19, 2009, the pre
- Page 199 and 200:
- 102 -On December 29, 2009, BSP is
- Page 201 and 202:
- 104 -19.02 Capital AllocationThe
- Page 203 and 204:
- 106 -annum of the par value. Subs
- Page 205 and 206:
- 108 -20. INTEREST INCOMEInterest
- Page 207 and 208:
- 110 -Other operating expenses con
- Page 209 and 210:
- 112 -The movements in the present
- Page 211 and 212:
- 114 -Parent Bank2011 2010 2009 20
- Page 213 and 214:
- 116 -(c) Other Transactions with
- Page 215 and 216:
- 118 -ii. On January 31, 2008, BDO
- Page 217 and 218:
- 120 -27. TAXES27.01 Current and D
- Page 219 and 220:
- 122 -Movements in net deferred ta
- Page 221 and 222:
- 124 -27.04 Gross Receipts Tax (GR
- Page 223 and 224:
- 126 -28. EARNINGS PER SHAREBasic
- Page 225 and 226:
- 128 -29. SELECTED FINANCIAL PERFO
- Page 227 and 228:
- 130 -Sale of BankardBDO (as succe
- Page 229 and 230:
- 132 -PEACe bondsOn October 18, 20
- Page 231:
- 134 -Following is a summary of BD