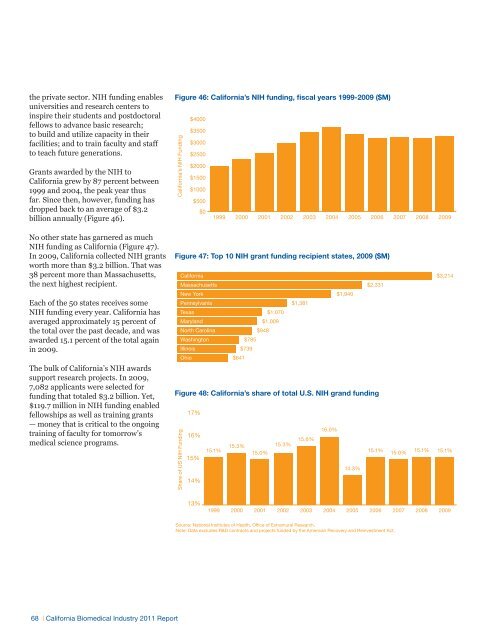
the private sector. NIH funding enablesuniversities and research centers toinspire their students and postdoctoralfellows to advance basic research;to build and utilize capacity in theirfacilities; and to train faculty and staffto teach future generations.Grants awarded by the NIH to<strong>California</strong> grew by 87 percent between1999 and 2004, the peak year thusfar. Since then, however, funding hasdropped back to an average of $3.2billion annually (Figure 46).No other state has garnered as muchNIH funding as <strong>California</strong> (Figure 47).In 2009, <strong>California</strong> collected NIH grantsworth more than $3.2 billion. That was38 percent more than Massachusetts,the next highest recipient.Each of the 50 states receives someNIH funding every year. <strong>California</strong> hasaveraged approximately 15 percent ofthe total over the past decade, and wasawarded 15.1 percent of the total againin 2009.The bulk of <strong>California</strong>’s NIH awardssupport research projects. In 2009,7,082 applicants were selected forfunding that totaled $3.2 billion. Yet,$119.7 million in NIH funding enabledfellowships as well as training grants— money that is critical to the ongoingtraining of faculty for tomorrow’smedical science programs.Figure 46: <strong>California</strong>’s NIH funding, fiscal years 1999-2009 ($M)Figure 25: <strong>California</strong>’s NIH funding, fiscal years 1999–2009 in millions of dollars<strong>California</strong>’s NIH Funding$4000$3500$3000$2500$2000$1500$1000$500$0199819992000 2001 2002 2003 2004 2005 2006 2007 2008 2009Source: National <strong>Institute</strong>s of Health, Office of Extramural Research.Note: Data excludes R&D contracts and projects funded by the American Reinvestment and Recovery Act.Figure 47: Top 10 NIH grant funding recipient states, 2009 ($M)Figure 26: Top 10 NIH grant funding recipient states<strong>California</strong>MassachusettsNew YorkPennsylvaniaTexasMarylandNorth CarolinaWashingtonIllinoisOhio$1,070$1,009$948$785$739$641$1,381$1,940$2,331Source: National <strong>Institute</strong>s of Health, Office of Extramural Research.Note: Data excludes R&D contracts and projects funded by the American Recovery and Reinvestment Act.Figure 48: <strong>California</strong>’s share of total U.S. NIH grand fundingFigure 27: <strong>California</strong>’s share of total US NIH grant funding, fiscal years 1999–2009Share of US NIH Funding17%16%15%14%15.1% 15.3% 15.0%15.3% 15.6% 16.0%14.3%$3,21415.1% 15.0%15.1% 15.1%13%1999 2000 2001 2002 2003 2004 2005 2006 2007 2008 2009Source: National <strong>Institute</strong>s of Health, Office of Extramural Research.Note: Data excludes R&D contracts and projects funded by the American Recovery and Reinvestment Act.68 | <strong>California</strong> <strong>Biomedical</strong> <strong>Industry</strong> 2011 Report
Figure 49: <strong>California</strong>’s NIH grantsby type, 2009Grant TypeDollarAmount(millions)GrantsAwardedTotal $3,213.6 7,082Research grants $3,087.3 6,240Training grants and fellowships $119.7 813Training grants $98.5 305Fellowships $21.2 508Construction grants $1.0 2Other awards $5.5 27Figure 50: NIH Grants, total and training ($M)Figure 29: NIH Grants, total and training ($M)1999 2000 2001 2002 2003 2004 2005 2006 2007 2008 2009United StatesTotal grants$12,804 $14,721 $16,701 $18,947 $21,669 $22,552 $23,117 $20,813 $21,067 $20,876 $21,483Training grants and fellowships$513 $546 $593 $657 $722 $749 $765 $758 $778 $776 $780Training as a percent of U.S. total4.0% 3.7% 3.6% 3.5% 3.3% 3.3% 3.3% 3.6% 3.7% 3.7% 3.6%<strong>California</strong>Total grants$1,933 $2,248 $2,497 $2,905 $3,386 $3,613 $3,301 $3,143 $3,163 $3,151 $3,214Training grants and fellowships$81 $83 $89 $97 $108 $114 $116 $111 $118 $117 $120Training as a percent of <strong>California</strong> total4.2% 3.7% 3.6% 3.3% 3.2% 3.2% 3.5% 3.5% 3.7% 3.7% 3.7%Source: National <strong>Institute</strong>s of Health, Office of ExtramuralResearch.Note: Data excludes R&D contracts and projects fundedby the American Recovery and Reinvestment Act.Training awards can be used to provideresearch training for young scientistswho may seek careers in biomedicaland behavioral sciences, whetherin academia or industry. They alsocan be used to establish or enhancecontinuing education programs foralready established researchers andfaculty. Training grants and fellowshipshave long been a key component in theexcellence of <strong>California</strong>’s biomedicalinstitutions’ programs.Since 1999, such funding has accountedfor an average of 3.6 percent of theoverall NIH funding. Nationally, thefunding in 2009 of 3.6 percent of thetotal was only a tenth of a percent lowerthan the previous two years and thesame as in 2006. In <strong>California</strong>, traininggrants and fellowships have made up anaverage of 3.5 percent of the state’s totalshare of NIH funding over the past 11years. In 2009, such grants comprised3.7 percent of the total, continuing athree-year streak at that level.Source: National <strong>Institute</strong>s of Health, Office of Extramural Research.Note: Data excludes R&D contracts and projects funded by the American Recovery and Reinvestment Act.Nine of the top 15 <strong>California</strong> institutions receiving NIH grants in 2009 wereuniversities — including seven of the 10 UC campuses. Stanford University wasamong the top five recipients. Of the top 10 recipients in 2009, three are in ornear San Diego. Those three (UC San Diego, the Scripps Research <strong>Institute</strong> andthe Burnham <strong>Institute</strong> for Medical Research, now the Sanford Burnham MedicalResearch <strong>Institute</strong>) make the 53rd Congressional District the largest beneficiary ofNIH funding in the state (Figure 51).Figure 30: 51: Organizations in <strong>California</strong> in <strong>California</strong> that recieve that NIH receive funding NIH (by Congressional funding (by District) congressional ($M)district), 2009 ($M)UC San Francisco (CD 12)UC Los Angeles (CD 30)UC San Diego (CD 53)Stanford University (CD 14)The Scripps Research <strong>Institute</strong> (CD 53)USC (CD 33)UC Davis (CD 1)UC Berkeley (CD 9)UC Irvine (CD 48)BIMR (CD 53)$67$114$112$175$172$206$306Source: National <strong>Institute</strong>s of Health, Office of Extramural ResearchNote: Data excludes R&D contracts and projects funded by the American Recovery and Reinvestment Act.$367$384$463<strong>California</strong> <strong>Biomedical</strong> <strong>Industry</strong> 2011 Report | 69