acta 2_2015
acta 2_2015
acta 2_2015
- No tags were found...

You also want an ePaper? Increase the reach of your titles
YUMPU automatically turns print PDFs into web optimized ePapers that Google loves.
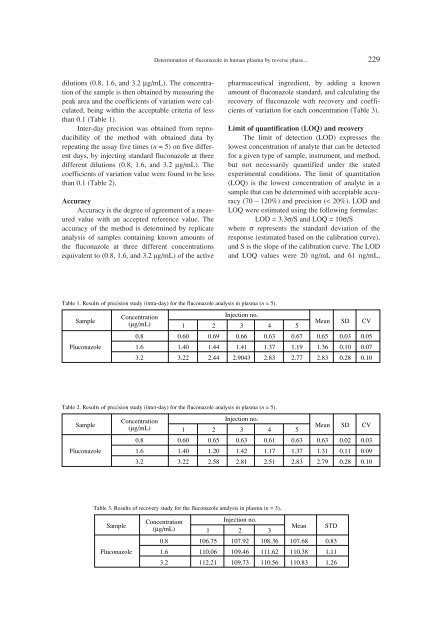
Determination of fluconazole in human plasma by reverse phase... 229dilutions (0.8, 1.6, and 3.2 µg/mL). The concentrationof the sample is then obtained by measuring thepeak area and the coefficients of variation were calculated,being within the acceptable criteria of lessthan 0.1 (Table 1).Inter-day precision was obtained from reproducibilityof the method with obtained data byrepeating the assay five times (n = 5) on five differentdays, by injecting standard fluconazole at threedifferent dilutions (0.8, 1.6, and 3.2 µg/mL). Thecoefficients of variation value were found to be lessthan 0.1 (Table 2).AccuracyAccuracy is the degree of agreement of a measuredvalue with an accepted reference value. Theaccuracy of the method is determined by replicateanalysis of samples containing known amounts ofthe fluconazole at three different concentrationsequivalent to (0.8, 1.6, and 3.2 µg/mL) of the activepharmaceutical ingredient, by adding a knownamount of fluconazole standard, and calculating therecovery of fluconazole with recovery and coefficientsof variation for each concentration (Table 3).Limit of quantification (LOQ) and recoveryThe limit of detection (LOD) expresses thelowest concentration of analyte that can be detectedfor a given type of sample, instrument, and method,but not necessarily quantified under the statedexperimental conditions. The limit of quantitation(LOQ) is the lowest concentration of analyte in asample that can be determined with acceptable accuracy(70 ñ 120%) and precision (< 20%). LOD andLOQ were estimated using the following formulas:LOD = 3.3σ/S and LOQ = 10σ/Swhere σ represents the standard deviation of theresponse (estimated based on the calibration curve),and S is the slope of the calibration curve. The LODand LOQ values were 20 ng/mL and 61 ng/mL,Table 1. Results of precision study (intra-day) for the fluconazole analysis in plasma (n = 5).SampleConcentrationInjection no.(µg/mL) 1 2 3 4 5Mean SD CV0.8 0.60 0.69 0.66 0.63 0.67 0.65 0.03 0.05Fluconazole 1.6 1.40 1.44 1.41 1.37 1.19 1.36 0.10 0.073.2 3.22 2.44 2.9043 2.83 2.77 2.83 0.28 0.10Table 2. Results of precision study (inter-day) for the fluconazole analysis in plasma (n = 5).SampleConcentrationInjection no.(µg/mL) 1 2 3 4 5Mean SD CV0.8 0.60 0.65 0.63 0.61 0.63 0.63 0.02 0.03Fluconazole 1.6 1.40 1.20 1.42 1.17 1.37 1.31 0.11 0.093.2 3.22 2.58 2.81 2.51 2.83 2.79 0.28 0.10Table 3. Results of recovery study for the fluconazole analysis in plasma (n = 3).SampleConcentrationInjection no.(µg/mL) 1 2 3Mean STD0.8 106.75 107.92 108.36 107.68 0.83Fluconazole 1.6 110.06 109.46 111.62 110.38 1.113.2 112.21 109.73 110.56 110.83 1.26