- Page 4:
PHARMACEUTICAL TECHNOLOGY347. £uka
- Page 11:
Impact of stress factors on optical
- Page 14 and 15:
228 ZAHRA SAFAEI et al.the determin
- Page 16 and 17:
230 ZAHRA SAFAEI et al.respectively
- Page 18 and 19:
232 ZAHRA SAFAEI et al.Concetration
- Page 21 and 22:
Acta Poloniae Pharmaceutica ñ Drug
- Page 23 and 24:
Lipophilicity assessment of spirono
- Page 25 and 26:
Lipophilicity assessment of spirono
- Page 27 and 28:
Lipophilicity assessment of spirono
- Page 29 and 30:
Lipophilicity assessment of spirono
- Page 31:
Acta Poloniae Pharmaceutica ñ Drug
- Page 34 and 35:
248 ASHFAQ AHMAD et al.Proposed mec
- Page 36 and 37:
250 ASHFAQ AHMAD et al.Figure 5. Re
- Page 38 and 39:
252 ASHFAQ AHMAD et al.4. Ha H., Pa
- Page 40 and 41:
254 PRITESH DEVBHUTI et al.inversel
- Page 42 and 43:
256 PRITESH DEVBHUTI et al.Figure 1
- Page 44 and 45:
258 PRITESH DEVBHUTI et al.received
- Page 46 and 47:
260 PRITESH DEVBHUTI et al.20. Khia
- Page 48 and 49:
262 MARIOLA HERBET et al.The purpos
- Page 50 and 51:
264 MARIOLA HERBET et al.rosuvastat
- Page 53 and 54:
Acta Poloniae Pharmaceutica ñ Drug
- Page 55 and 56:
Influence of cloudy apple juice on
- Page 57 and 58:
Influence of cloudy apple juice on
- Page 59 and 60:
Influence of cloudy apple juice on
- Page 61 and 62:
Influence of cloudy apple juice on
- Page 63 and 64:
Acta Poloniae Pharmaceutica ñ Drug
- Page 65 and 66:
1-[(Imidazolin-2-yl)amino]indoline
- Page 67 and 68:
1-[(Imidazolin-2-yl)amino]indoline
- Page 69 and 70:
1-[(Imidazolin-2-yl)amino]indoline
- Page 71 and 72:
1-[(Imidazolin-2-yl)amino]indoline
- Page 73:
1-[(Imidazolin-2-yl)amino]indoline
- Page 76 and 77:
290 TOMASZ KOSMALSKI et al.the lite
- Page 78 and 79:
292 TOMASZ KOSMALSKI et al.Antibact
- Page 80 and 81:
294 TOMASZ KOSMALSKI et al.66.49(19
- Page 83 and 84:
Acta Poloniae Pharmaceutica ñ Drug
- Page 85 and 86:
Synthesis and in vitro antiprolifer
- Page 87 and 88:
Synthesis and in vitro antiprolifer
- Page 89 and 90:
Synthesis and in vitro antiprolifer
- Page 91:
Synthesis and in vitro antiprolifer
- Page 94 and 95:
308 ASHRAF M. MOHAMED et al.Cevipab
- Page 96 and 97:
310 ASHRAF M. MOHAMED et al.solvent
- Page 98 and 99:
312 ASHRAF M. MOHAMED et al.Table 2
- Page 100 and 101:
314 ASHRAF M. MOHAMED et al.Table 3
- Page 102 and 103:
316 ASHRAF M. MOHAMED et al.teristi
- Page 104 and 105:
318 ASHRAF M. MOHAMED et al.20. Che
- Page 106 and 107:
320 MANSURAH A. ABDULAZEEZ et al.an
- Page 108 and 109:
322 MANSURAH A. ABDULAZEEZ et al.GC
- Page 110 and 111:
324 MANSURAH A. ABDULAZEEZ et al.Ta
- Page 112 and 113:
326 MANSURAH A. ABDULAZEEZ et al.in
- Page 114 and 115: 328 MANSURAH A. ABDULAZEEZ et al.34
- Page 116 and 117: 330 SAMINA AFZAL et al.is used as a
- Page 118 and 119: 332 SAMINA AFZAL et al.Detection of
- Page 120 and 121: 334 SAMINA AFZAL et al.CONCLUSIONAm
- Page 122 and 123: 336 BEATA PASKER et al.inhibitory o
- Page 124 and 125: 338 BEATA PASKER et al.Figure 2. Ef
- Page 126 and 127: 340 BEATA PASKER et al.In conclusio
- Page 128 and 129: 342 NASER VAHED DEHKORDI et al.EXPE
- Page 130 and 131: 344 NASER VAHED DEHKORDI et al.Anti
- Page 133 and 134: Acta Poloniae Pharmaceutica ñ Drug
- Page 135 and 136: Dissolution properties and kinetic
- Page 137 and 138: Dissolution properties and kinetic
- Page 139 and 140: Dissolution properties and kinetic
- Page 141: Dissolution properties and kinetic
- Page 144 and 145: 358 OLADAPO A. ADETUNJI et al.In th
- Page 146 and 147: 360 OLADAPO A. ADETUNJI et al.that
- Page 148 and 149: 362 OLADAPO A. ADETUNJI et al.Figur
- Page 150 and 151: 364 OLADAPO A. ADETUNJI et al.Figur
- Page 153 and 154: Acta Poloniae Pharmaceutica ñ Drug
- Page 155 and 156: In vitro antimicrobial activity of
- Page 157 and 158: In vitro antimicrobial activity of
- Page 159 and 160: In vitro antimicrobial activity of
- Page 161: In vitro antimicrobial activity of
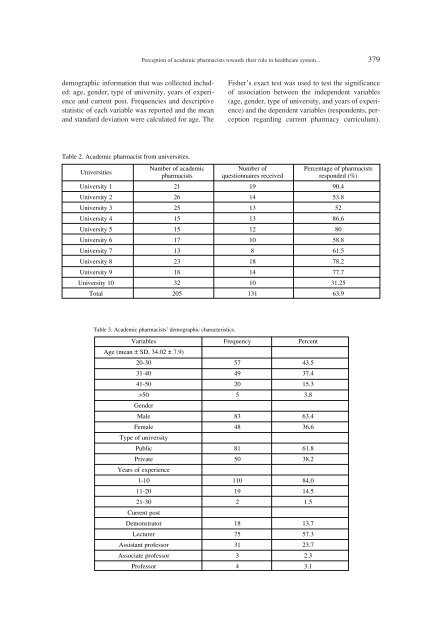
- Page 166 and 167: 380 SHENG LI et al.Fisherís exact
- Page 168 and 169: 382 SHENG LI et al.Arabia and Jorda
- Page 170 and 171: 384 MAGDALENA RATAJCZAK et al.g/mL.
- Page 172 and 173: 386 MAGDALENA RATAJCZAK et al.ing d
- Page 175 and 176: Acta Poloniae Pharmaceutica ñ Drug
- Page 177 and 178: Use of medicines among students of
- Page 179 and 180: Use of medicines among students of
- Page 181 and 182: Use of medicines among students of
- Page 183 and 184: Acta Poloniae Pharmaceutica ñ Drug
- Page 185 and 186: Cytotoxicity and antiglucosidase po
- Page 187: Cytotoxicity and antiglucosidase po
- Page 190 and 191: 404 ANNA CWYNAR et al.was used to r
- Page 192 and 193: 406 ANNA CWYNAR et al.Consequently,