acta 2_2015
acta 2_2015
acta 2_2015
- No tags were found...

You also want an ePaper? Increase the reach of your titles
YUMPU automatically turns print PDFs into web optimized ePapers that Google loves.
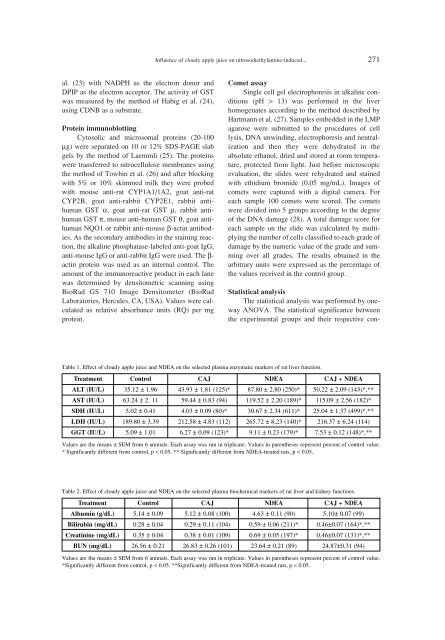
Influence of cloudy apple juice on nitrosodiethylamine-induced... 271al. (23) with NADPH as the electron donor andDPIP as the electron acceptor. The activity of GSTwas measured by the method of Habig et al. (24),using CDNB as a substrate.Protein immunoblottingCytosolic and microsomal proteins (20-100µg) were separated on 10 or 12% SDS-PAGE slabgels by the method of Laemmli (25). The proteinswere transferred to nitrocellulose membranes usingthe method of Towbin et al. (26) and after blockingwith 5% or 10% skimmed milk they were probedwith mouse anti-rat CYP1A1/1A2, goat anti-ratCYP2B, goat anti-rabbit CYP2E1, rabbit antihumanGST α, goat anti-rat GST µ, rabbit antihumanGST π, mouse anti-human GST θ, goat antihumanNQO1 or rabbit anti-mouse β-actin antibodies.As the secondary antibodies in the staining reaction,the alkaline phosphatase-labeled anti-goat IgG,anti-mouse IgG or anti-rabbit IgG were used. The β-actin protein was used as an internal control. Theamount of the immunoreactive product in each lanewas determined by densitometric scanning usingBioRad GS 710 Image Densitometer (BioRadLaboratories, Hercules, CA, USA). Values were calculatedas relative absorbance units (RQ) per mgprotein.Comet assaySingle cell gel electrophoresis in alkaline conditions(pH > 13) was performed in the liverhomogenates according to the method described byHartmann et al. (27). Samples embedded in the LMPagarose were submitted to the procedures of celllysis, DNA unwinding, electrophoresis and neutralizationand then they were dehydrated in theabsolute ethanol, dried and stored at room temperature,protected from light. Just before microscopicevaluation, the slides were rehydrated and stainedwith ethidium bromide (0.05 mg/mL). Images ofcomets were captured with a digital camera. Foreach sample 100 comets were scored. The cometswere divided into 5 groups according to the degreeof the DNA damage (28). A total damage score foreach sample on the slide was calculated by multiplyingthe number of cells classified to each grade ofdamage by the numeric value of the grade and summingover all grades. The results obtained in thearbitrary units were expressed as the percentage ofthe values received in the control group.Statistical analysisThe statistical analysis was performed by onewayANOVA. The statistical significance betweenthe experimental groups and their respective con-Table 1. Effect of cloudy apple juice and NDEA on the selected plasma enzymatic markers of rat liver function.Treatment Control CAJ NDEA CAJ + NDEAALT (IU/L) 35.12 ± 1.96 43.93 ± 1.81 (125)* 87.80 ± 2.80 (250)* 50.22 ± 2.09 (143)*,**AST (IU/L) 63.24 ± 2. 11 59.44 ± 0.83 (94) 119.52 ± 2.20 (189)* 115.09 ± 2.56 (182)*SDH (IU/L) 5.02 ± 0.41 4.03 ± 0.09 (80)* 30.67 ± 2.34 (611)* 25.04 ± 1.37 (499)*,**LDH (IU/L) 189.80 ± 3.39 212.58 ± 4.83 (112) 265.72 ± 8.23 (140)* 216.37 ± 6.24 (114)GGT (IU/L) 5.09 ± 1.01 6.27 ± 0.09 (123)* 9.11 ± 0.23 (179)* 7.53 ± 0.12 (148)*,**Values are the means ± SEM from 6 animals. Each assay was run in triplicate. Values in parentheses represent percent of control value.* Significantly different from control, p < 0.05. ** Significantly different from NDEA-treated rats, p < 0.05.Table 2. Effect of cloudy apple juice and NDEA on the selected plasma biochemical markers of rat liver and kidney functions.Treatment Control CAJ NDEA CAJ + NDEAAlbumin (g/dL) 5.14 ± 0.09 5.12 ± 0.08 (100) 4.63 ± 0.11 (90) 5.10± 0.07 (99)Bilirubin (mg/dL) 0.28 ± 0.04 0.29 ± 0.11 (104) 0.59 ± 0.06 (211)* 0.46±0.07 (164)*,**Creatinine (mg/dL) 0.35 ± 0.04 0.38 ± 0.01 (109) 0.69 ± 0.05 (197)* 0.46±0.07 (131)*,**BUN (mg/dL) 26.56 ± 0.21 26.83 ± 0.26 (101) 23.64 ± 0.21 (89) 24.87±0.31 (94)Values are the means ± SEM from 6 animals. Each assay was run in triplicate. Values in parentheses represent percent of control value.*Significantly different from control, p < 0.05. **Significantly different from NDEA-treated rats, p < 0.05.