Orestimba Creek Hydrology - Stanislaus County
Orestimba Creek Hydrology - Stanislaus County
Orestimba Creek Hydrology - Stanislaus County
- No tags were found...

Create successful ePaper yourself
Turn your PDF publications into a flip-book with our unique Google optimized e-Paper software.
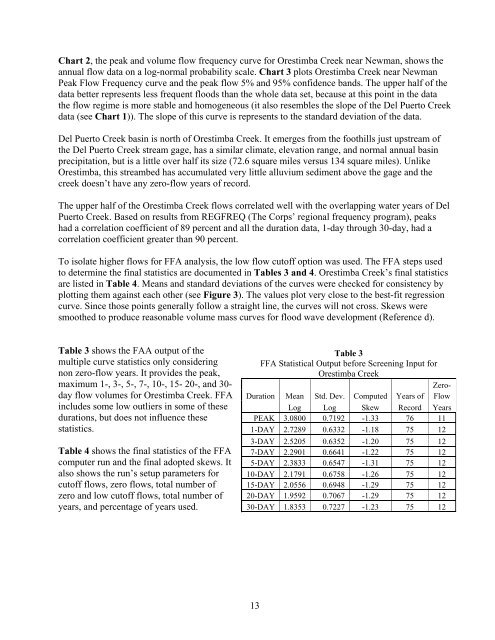
Chart 2, the peak and volume flow frequency curve for <strong>Orestimba</strong> <strong>Creek</strong> near Newman, shows theannual flow data on a log-normal probability scale. Chart 3 plots <strong>Orestimba</strong> <strong>Creek</strong> near NewmanPeak Flow Frequency curve and the peak flow 5% and 95% confidence bands. The upper half of thedata better represents less frequent floods than the whole data set, because at this point in the datathe flow regime is more stable and homogeneous (it also resembles the slope of the Del Puerto <strong>Creek</strong>data (see Chart 1)). The slope of this curve is represents to the standard deviation of the data.Del Puerto <strong>Creek</strong> basin is north of <strong>Orestimba</strong> <strong>Creek</strong>. It emerges from the foothills just upstream ofthe Del Puerto <strong>Creek</strong> stream gage, has a similar climate, elevation range, and normal annual basinprecipitation, but is a little over half its size (72.6 square miles versus 134 square miles). Unlike<strong>Orestimba</strong>, this streambed has accumulated very little alluvium sediment above the gage and thecreek doesn’t have any zero-flow years of record.The upper half of the <strong>Orestimba</strong> <strong>Creek</strong> flows correlated well with the overlapping water years of DelPuerto <strong>Creek</strong>. Based on results from REGFREQ (The Corps’ regional frequency program), peakshad a correlation coefficient of 89 percent and all the duration data, 1-day through 30-day, had acorrelation coefficient greater than 90 percent.To isolate higher flows for FFA analysis, the low flow cutoff option was used. The FFA steps usedto determine the final statistics are documented in Tables 3 and 4. <strong>Orestimba</strong> <strong>Creek</strong>’s final statisticsare listed in Table 4. Means and standard deviations of the curves were checked for consistency byplotting them against each other (see Figure 3). The values plot very close to the best-fit regressioncurve. Since those points generally follow a straight line, the curves will not cross. Skews weresmoothed to produce reasonable volume mass curves for flood wave development (Reference d).Table 3 shows the FAA output of themultiple curve statistics only consideringnon zero-flow years. It provides the peak,maximum 1-, 3-, 5-, 7-, 10-, 15- 20-, and 30-day flow volumes for <strong>Orestimba</strong> <strong>Creek</strong>. FFAincludes some low outliers in some of thesedurations, but does not influence thesestatistics.Table 4 shows the final statistics of the FFAcomputer run and the final adopted skews. Italso shows the run’s setup parameters forcutoff flows, zero flows, total number ofzero and low cutoff flows, total number ofyears, and percentage of years used.Table 3FFA Statistical Output before Screening Input for<strong>Orestimba</strong> <strong>Creek</strong>Zero-Duration Mean Std. Dev. Computed Years of FlowLog Log Skew Record YearsPEAK 3.0800 0.7192 -1.33 76 111-DAY 2.7289 0.6332 -1.18 75 123-DAY 2.5205 0.6352 -1.20 75 127-DAY 2.2901 0.6641 -1.22 75 125-DAY 2.3833 0.6547 -1.31 75 1210-DAY 2.1791 0.6758 -1.26 75 1215-DAY 2.0556 0.6948 -1.29 75 1220-DAY 1.9592 0.7067 -1.29 75 1230-DAY 1.8353 0.7227 -1.23 75 1213