Orestimba Creek Hydrology - Stanislaus County
Orestimba Creek Hydrology - Stanislaus County
Orestimba Creek Hydrology - Stanislaus County
- No tags were found...

You also want an ePaper? Increase the reach of your titles
YUMPU automatically turns print PDFs into web optimized ePapers that Google loves.
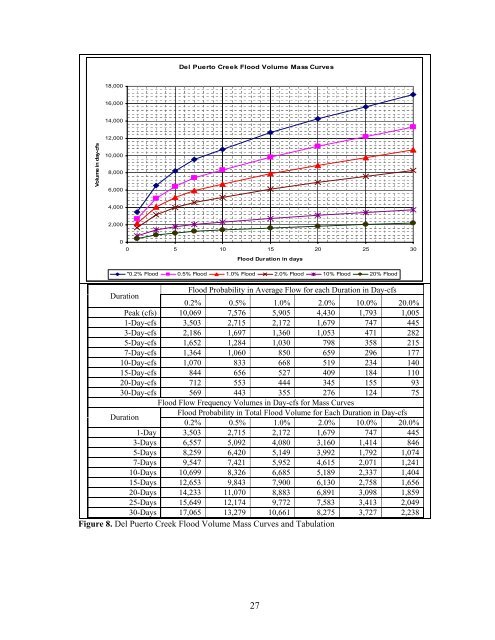
Del Puerto <strong>Creek</strong> Flood Volume Mass Curves18,00016,00014,00012,000Volume in day-cfs10,0008,0006,0004,0002,00000 5 10 15 20 25 30Flood Duration in days"0.2% Flood 0.5% Flood 1.0% Flood 2.0% Flood 10% Flood 20% FloodDurationFlood Probability in Average Flow for each Duration in Day-cfs0.2% 0.5% 1.0% 2.0% 10.0% 20.0%Peak (cfs) 10,069 7,576 5,905 4,430 1,793 1,0051-Day-cfs 3,503 2,715 2,172 1,679 747 4453-Day-cfs 2,186 1,697 1,360 1,053 471 2825-Day-cfs 1,652 1,284 1,030 798 358 2157-Day-cfs 1,364 1,060 850 659 296 17710-Day-cfs 1,070 833 668 519 234 14015-Day-cfs 844 656 527 409 184 11020-Day-cfs 712 553 444 345 155 9330-Day-cfs 569 443 355 276 124 75Flood Flow Frequency Volumes in Day-cfs for Mass CurvesDurationFlood Probability in Total Flood Volume for Each Duration in Day-cfs0.2% 0.5% 1.0% 2.0% 10.0% 20.0%1-Day 3,503 2,715 2,172 1,679 747 4453-Days 6,557 5,092 4,080 3,160 1,414 8465-Days 8,259 6,420 5,149 3,992 1,792 1,0747-Days 9,547 7,421 5,952 4,615 2,071 1,24110-Days 10,699 8,326 6,685 5,189 2,337 1,40415-Days 12,653 9,843 7,900 6,130 2,758 1,65620-Days 14,233 11,070 8,883 6,891 3,098 1,85925-Days 15,649 12,174 9,772 7,583 3,413 2,04930-Days 17,065 13,279 10,661 8,275 3,727 2,238Figure 8. Del Puerto <strong>Creek</strong> Flood Volume Mass Curves and Tabulation27