Orestimba Creek Hydrology - Stanislaus County
Orestimba Creek Hydrology - Stanislaus County
Orestimba Creek Hydrology - Stanislaus County
- No tags were found...

Create successful ePaper yourself
Turn your PDF publications into a flip-book with our unique Google optimized e-Paper software.
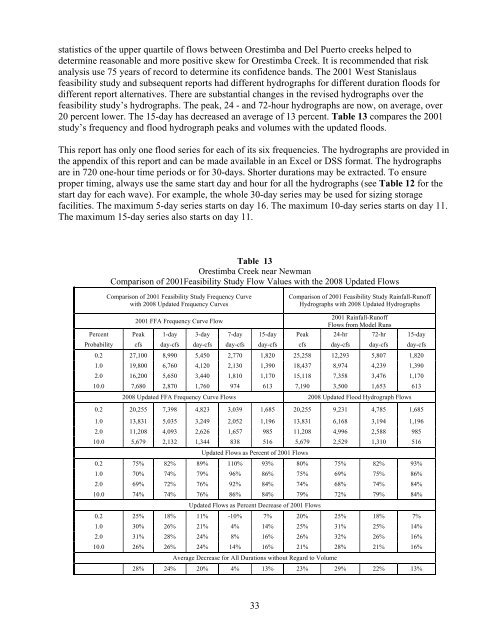
statistics of the upper quartile of flows between <strong>Orestimba</strong> and Del Puerto creeks helped todetermine reasonable and more positive skew for <strong>Orestimba</strong> <strong>Creek</strong>. It is recommended that riskanalysis use 75 years of record to determine its confidence bands. The 2001 West <strong>Stanislaus</strong>feasibility study and subsequent reports had different hydrographs for different duration floods fordifferent report alternatives. There are substantial changes in the revised hydrographs over thefeasibility study’s hydrographs. The peak, 24 - and 72-hour hydrographs are now, on average, over20 percent lower. The 15-day has decreased an average of 13 percent. Table 13 compares the 2001study’s frequency and flood hydrograph peaks and volumes with the updated floods.This report has only one flood series for each of its six frequencies. The hydrographs are provided inthe appendix of this report and can be made available in an Excel or DSS format. The hydrographsare in 720 one-hour time periods or for 30-days. Shorter durations may be extracted. To ensureproper timing, always use the same start day and hour for all the hydrographs (see Table 12 for thestart day for each wave). For example, the whole 30-day series may be used for sizing storagefacilities. The maximum 5-day series starts on day 16. The maximum 10-day series starts on day 11.The maximum 15-day series also starts on day 11.Table 13<strong>Orestimba</strong> <strong>Creek</strong> near NewmanComparison of 2001Feasibility Study Flow Values with the 2008 Updated FlowsComparison of 2001 Feasibility Study Frequency Curvewith 2008 Updated Frequency CurvesComparison of 2001 Feasibility Study Rainfall-RunoffHydrographs with 2008 Updated Hydrographs2001 FFA Frequency Curve Flow2001 Rainfall-RunoffFlows from Model RunsPercent Peak 1-day 3-day 7-day 15-day Peak 24-hr 72-hr 15-dayProbability cfs day-cfs day-cfs day-cfs day-cfs cfs day-cfs day-cfs day-cfs0.2 27,100 8,990 5,450 2,770 1,820 25,258 12,293 5,807 1,8201.0 19,800 6,760 4,120 2,130 1,390 18,437 8,974 4,239 1,3902.0 16,200 5,650 3,440 1,810 1,170 15,118 7,358 3,476 1,17010.0 7,680 2,870 1,760 974 613 7,190 3,500 1,653 6132008 Updated FFA Frequency Curve Flows 2008 Updated Flood Hydrograph Flows0.2 20,255 7,398 4,823 3,039 1,685 20,255 9,231 4,785 1,6851.0 13,831 5,035 3,249 2,052 1,196 13,831 6,168 3,194 1,1962.0 11,208 4,093 2,626 1,657 985 11,208 4,996 2,588 98510.0 5,679 2,132 1,344 838 516 5,679 2,529 1,310 516Updated Flows as Percent of 2001 Flows0.2 75% 82% 89% 110% 93% 80% 75% 82% 93%1.0 70% 74% 79% 96% 86% 75% 69% 75% 86%2.0 69% 72% 76% 92% 84% 74% 68% 74% 84%10.0 74% 74% 76% 86% 84% 79% 72% 79% 84%Updated Flows as Percent Decrease of 2001 Flows0.2 25% 18% 11% -10% 7% 20% 25% 18% 7%1.0 30% 26% 21% 4% 14% 25% 31% 25% 14%2.0 31% 28% 24% 8% 16% 26% 32% 26% 16%10.0 26% 26% 24% 14% 16% 21% 28% 21% 16%Average Decrease for All Durations without Regard to Volume28% 24% 20% 4% 13% 23% 29% 22% 13%33