Orestimba Creek Hydrology - Stanislaus County
Orestimba Creek Hydrology - Stanislaus County
Orestimba Creek Hydrology - Stanislaus County
- No tags were found...

Create successful ePaper yourself
Turn your PDF publications into a flip-book with our unique Google optimized e-Paper software.
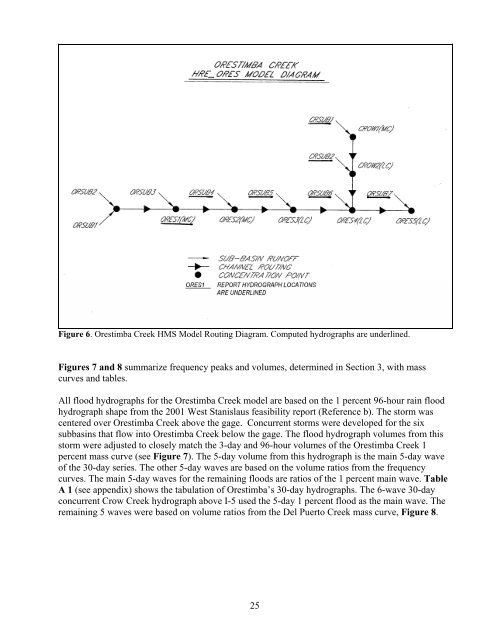
Figure 6. <strong>Orestimba</strong> <strong>Creek</strong> HMS Model Routing Diagram. Computed hydrographs are underlined.Figures 7 and 8 summarize frequency peaks and volumes, determined in Section 3, with masscurves and tables.All flood hydrographs for the <strong>Orestimba</strong> <strong>Creek</strong> model are based on the 1 percent 96-hour rain floodhydrograph shape from the 2001 West <strong>Stanislaus</strong> feasibility report (Reference b). The storm wascentered over <strong>Orestimba</strong> <strong>Creek</strong> above the gage. Concurrent storms were developed for the sixsubbasins that flow into <strong>Orestimba</strong> <strong>Creek</strong> below the gage. The flood hydrograph volumes from thisstorm were adjusted to closely match the 3-day and 96-hour volumes of the <strong>Orestimba</strong> <strong>Creek</strong> 1percent mass curve (see Figure 7). The 5-day volume from this hydrograph is the main 5-day waveof the 30-day series. The other 5-day waves are based on the volume ratios from the frequencycurves. The main 5-day waves for the remaining floods are ratios of the 1 percent main wave. TableA 1 (see appendix) shows the tabulation of <strong>Orestimba</strong>’s 30-day hydrographs. The 6-wave 30-dayconcurrent Crow <strong>Creek</strong> hydrograph above I-5 used the 5-day 1 percent flood as the main wave. Theremaining 5 waves were based on volume ratios from the Del Puerto <strong>Creek</strong> mass curve, Figure 8.25