Orestimba Creek Hydrology - Stanislaus County
Orestimba Creek Hydrology - Stanislaus County
Orestimba Creek Hydrology - Stanislaus County
- No tags were found...

Create successful ePaper yourself
Turn your PDF publications into a flip-book with our unique Google optimized e-Paper software.
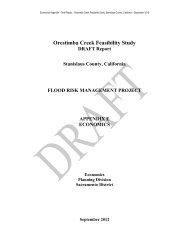
<strong>Orestimba</strong> <strong>Creek</strong> Flood Volume Duration CurvesThousands353025Volume in Day-cfs2015`10500 5 10 15 20 25 30Duration in days0.2% Flood 0.5% Flood 1% Flood 2% Flood 10% Flood 20% FloodFlood Probability in Average Flow for each Duration in Day-cfsDuration 0.2%500 yr0.5%200 yr1.0%100 yr2.0%50 yr10.0%10 yr20.0%5 YrPeak (cfs) 20,255 16,553 13,831 11,208 5,679 3,6341-Day-cfs 7,398 6,026 5,035 4,093 2,132 1,4053-Day-cfs 4,825 3,908 3,250 2,627 1,344 8765-Day-cfs 3,743 3,017 2,498 2,010 1,013 6547-Day-cfs 3,039 2,467 2,052 1,657 838 53910-Day-cfs 2,316 1,899 1,591 1,293 662 42615-Day-cfs 1,685 1,408 1,196 985 516 33420-Day-cfs 1,421 1,182 1,001 821 425 27230-Day-cfs 1,128 936 790 646 330 210Flood Flow Frequency Volumes in Day-cfs for Mass CurvesDurationFlood Probability in Total Flood Volume for Each Duration in Day-cfs0.2% 0.5% 1.0% 2.0% 10.0% 20.0%1-Day 7,398 6,026 5,035 4,093 2,132 1,4053-Days 14,474 11,724 9,750 7,881 4,033 2,6285-Days 18,714 15,086 12,492 10,049 5,064 3,2687-Days 21,270 17,266 14,363 11,598 5,864 3,77010-Days 23,164 18,988 15,908 12,932 6,619 4,26415-Days 25,279 21,117 17,939 14,774 7,743 5,00320-Days 28,414 23,649 20,024 16,427 8,497 5,44325-Days 31,133 25,865 21,863 17,900 9,198 5,86530-Days 33,853 28,080 23,702 19,373 9,899 6,288Figure 7. <strong>Orestimba</strong> <strong>Creek</strong> Flood Volume Mass Curves and Tabulation26