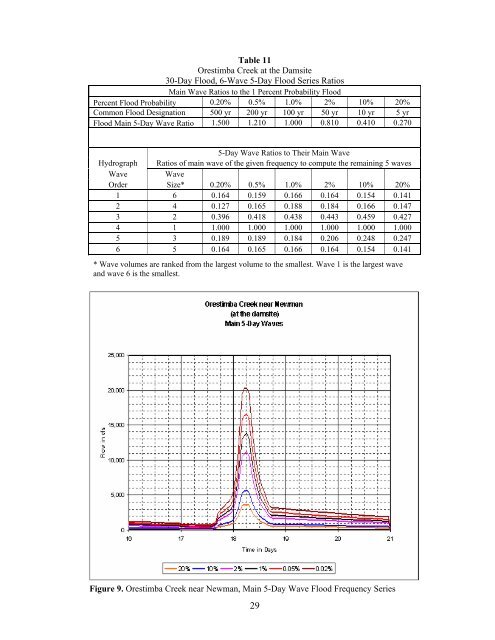
Table 9 shows the ratios of <strong>Orestimba</strong> <strong>Creek</strong>’s(ORES1) and Crow <strong>Creek</strong>’s (CROW1 andCRSUB2) 5-day main wave used to produce the 1percent 30-day series. <strong>Orestimba</strong> <strong>Creek</strong>’s 5-dayvolume was a little less than the frequency curve’s5-day volume, so the second 5-day wave ratio wasincreased to make the 10-day volume match thefrequency 10-day event. The same was done on theremainder of the main wave ratios so that theresulting volumes matched the <strong>Orestimba</strong>frequency curve. <strong>Orestimba</strong> <strong>Creek</strong>’s ratios to themain wave are listed in Table 10. Crow <strong>Creek</strong>’smain wave is the product of a concurrent 1 percentstorm over its basin. The main wave is less than aspecific centering over the same area. Ratios inTable 9 are derived from Del Puerto <strong>Creek</strong>’svolume flow frequency curves without any furtheradjustment.StartDayTable 91 Percent 30-Day Flood Seriesfor <strong>Orestimba</strong> and Crow <strong>Creek</strong>sRatios of Main WavesUsed to Develop 30-Day SeriesRelative WaveSizeORES1LocationCROW1 &CRSUB21 6 0.166 0.1736 4 0.188 0.19111 2 0.438 0.29816 1 1.000 1.00021 3 0.184 0.23626 5 0.166 0.173Note: Wave 1, the largest wave, occurs as the fourthwave. Wave 6 is the smallest wave.The main 5-day wave for each of the additional five floods, 0.2, 0.5, 2.0, 10, and 20 percent, areratios of their 5-day volumes to that of the 1 percent (100-year) 5-day volume, as shown below, andat the top of Table 11 as the “Main Wave Ratios to the 1 Percent Probability Flood.”The main wave for each frequency floodis computed first and then ratios of thatmain wave are computed to fill in theremaining 5 of the six waves. Table 11shows the entire <strong>Orestimba</strong> <strong>Creek</strong> 30-day flood, 6-wave 5-day flood seriesratios. Figure 9, <strong>Orestimba</strong> <strong>Creek</strong> nearNewman, CA, (at the damsite) showsthe main 5-day waves for the 20, 10,2.0, 1.0, 0.5, and 0.2 percent probabilityflood. An example of the six 5-daywaves (the <strong>Orestimba</strong> <strong>Creek</strong> nearNewman (ORES2) 1 percent 30-dayflood series) is shown in Figure 10. Thesame floods for Crow <strong>Creek</strong> (CROW1)are shown in Figures 11 and 12,respectively.Table 10<strong>Orestimba</strong> <strong>Creek</strong> 1 Percent Flood Hydrograph FlowsDurationUnitsFrequencyCurveFlowsAdjustedHydrographFlowsPercent ofFrequencyValuesPeak cfs 13,831 13,831 1003-day (72-hr) day-cfs 3,250 3,194 984-day (96-hr) day-cfs 2,498 2,586 1045-day (120-hr) day-cfs 2,498 2,213 897-day day-cfs 2,052 1,962 9610-day day-cfs 1,591 1,591 10015-day day-cfs 1,196 1,199 10020-day day-cfs 1,001 1,001 10025-day day-cfs 875 875 10030-day day-cfs 790 790 10028
Table 11<strong>Orestimba</strong> <strong>Creek</strong> at the Damsite30-Day Flood, 6-Wave 5-Day Flood Series RatiosMain Wave Ratios to the 1 Percent Probability FloodPercent Flood Probability 0.20% 0.5% 1.0% 2% 10% 20%Common Flood Designation 500 yr 200 yr 100 yr 50 yr 10 yr 5 yrFlood Main 5-Day Wave Ratio 1.500 1.210 1.000 0.810 0.410 0.2705-Day Wave Ratios to Their Main WaveHydrograph Ratios of main wave of the given frequency to compute the remaining 5 wavesWave WaveOrder Size* 0.20% 0.5% 1.0% 2% 10% 20%1 6 0.164 0.159 0.166 0.164 0.154 0.1412 4 0.127 0.165 0.188 0.184 0.166 0.1473 2 0.396 0.418 0.438 0.443 0.459 0.4274 1 1.000 1.000 1.000 1.000 1.000 1.0005 3 0.189 0.189 0.184 0.206 0.248 0.2476 5 0.164 0.165 0.166 0.164 0.154 0.141* Wave volumes are ranked from the largest volume to the smallest. Wave 1 is the largest waveand wave 6 is the smallest.Figure 9. <strong>Orestimba</strong> <strong>Creek</strong> near Newman, Main 5-Day Wave Flood Frequency Series29