Acquisition Lesson Planning Form - Ciclt.net
Acquisition Lesson Planning Form - Ciclt.net
Acquisition Lesson Planning Form - Ciclt.net
- No tags were found...

Create successful ePaper yourself
Turn your PDF publications into a flip-book with our unique Google optimized e-Paper software.
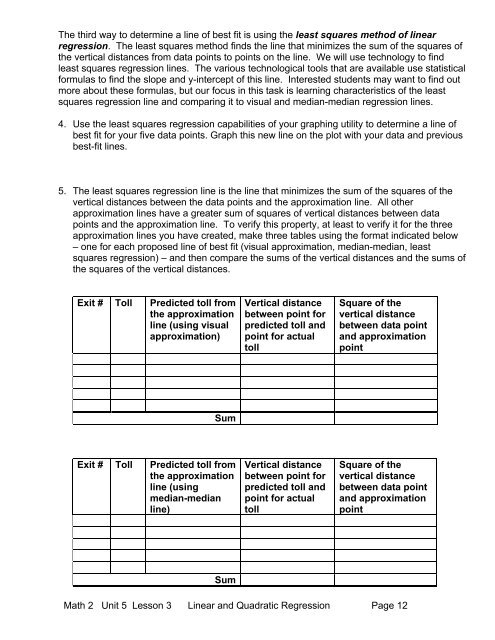
The third way to determine a line of best fit is using the least squares method of linearregression. The least squares method finds the line that minimizes the sum of the squares ofthe vertical distances from data points to points on the line. We will use technology to findleast squares regression lines. The various technological tools that are available use statisticalformulas to find the slope and y-intercept of this line. Interested students may want to find outmore about these formulas, but our focus in this task is learning characteristics of the leastsquares regression line and comparing it to visual and median-median regression lines.4. Use the least squares regression capabilities of your graphing utility to determine a line ofbest fit for your five data points. Graph this new line on the plot with your data and previousbest-fit lines.5. The least squares regression line is the line that minimizes the sum of the squares of thevertical distances between the data points and the approximation line. All otherapproximation lines have a greater sum of squares of vertical distances between datapoints and the approximation line. To verify this property, at least to verify it for the threeapproximation lines you have created, make three tables using the format indicated below– one for each proposed line of best fit (visual approximation, median-median, leastsquares regression) – and then compare the sums of the vertical distances and the sums ofthe squares of the vertical distances.Exit # Toll Predicted toll fromthe approximationline (using visualapproximation)Vertical distancebetween point forpredicted toll andpoint for actualtollSquare of thevertical distancebetween data pointand approximationpointSumExit # Toll Predicted toll fromthe approximationline (usingmedian-medianline)Vertical distancebetween point forpredicted toll andpoint for actualtollSquare of thevertical distancebetween data pointand approximationpointSumMath 2 Unit 5 <strong>Lesson</strong> 3 Linear and Quadratic Regression Page 12