Acquisition Lesson Planning Form - Ciclt.net
Acquisition Lesson Planning Form - Ciclt.net
Acquisition Lesson Planning Form - Ciclt.net
- No tags were found...

Create successful ePaper yourself
Turn your PDF publications into a flip-book with our unique Google optimized e-Paper software.
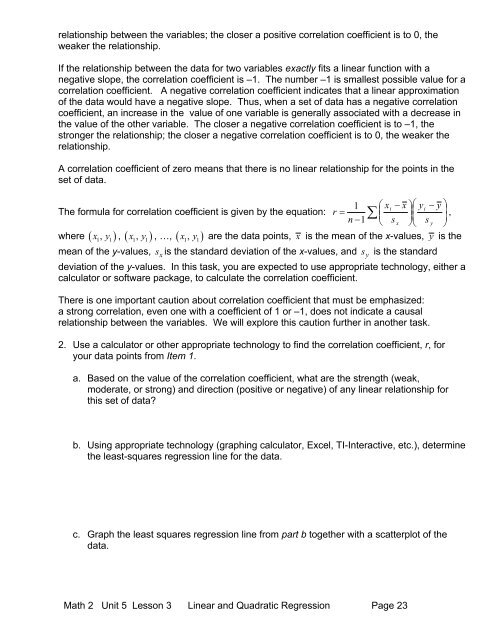
elationship between the variables; the closer a positive correlation coefficient is to 0, theweaker the relationship.If the relationship between the data for two variables exactly fits a linear function with anegative slope, the correlation coefficient is –1. The number –1 is smallest possible value for acorrelation coefficient. A negative correlation coefficient indicates that a linear approximationof the data would have a negative slope. Thus, when a set of data has a negative correlationcoefficient, an increase in the value of one variable is generally associated with a decrease inthe value of the other variable. The closer a negative correlation coefficient is to –1, thestronger the relationship; the closer a negative correlation coefficient is to 0, the weaker therelationship.A correlation coefficient of zero means that there is no linear relationship for the points in theset of data.1 ⎛ x ⎛ ⎞i− x ⎞ y −The formula for correlation coefficient is given by the equation:⎜iyr = ∑⎟⎜⎟ ,n −1⎝ sx ⎠⎝sy ⎠, , x , y are the data points, x is the mean of the x-values, y is thewhere ( x y ), ( x y ), …, ( )1 11 11 1mean of the y-values, sxis the standard deviation of the x-values, and s y is the standarddeviation of the y-values. In this task, you are expected to use appropriate technology, either acalculator or software package, to calculate the correlation coefficient.There is one important caution about correlation coefficient that must be emphasized:a strong correlation, even one with a coefficient of 1 or –1, does not indicate a causalrelationship between the variables. We will explore this caution further in another task.2. Use a calculator or other appropriate technology to find the correlation coefficient, r, foryour data points from Item 1.a. Based on the value of the correlation coefficient, what are the strength (weak,moderate, or strong) and direction (positive or negative) of any linear relationship forthis set of data?b. Using appropriate technology (graphing calculator, Excel, TI-Interactive, etc.), determi<strong>net</strong>he least-squares regression line for the data.c. Graph the least squares regression line from part b together with a scatterplot of thedata.Math 2 Unit 5 <strong>Lesson</strong> 3 Linear and Quadratic Regression Page 23