Acquisition Lesson Planning Form - Ciclt.net
Acquisition Lesson Planning Form - Ciclt.net
Acquisition Lesson Planning Form - Ciclt.net
- No tags were found...

Create successful ePaper yourself
Turn your PDF publications into a flip-book with our unique Google optimized e-Paper software.
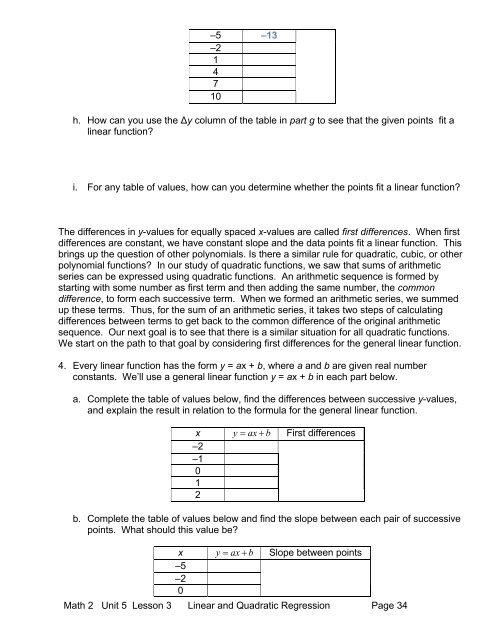
–5 –13–214710h. How can you use the Δy column of the table in part g to see that the given points fit alinear function?i. For any table of values, how can you determine whether the points fit a linear function?The differences in y-values for equally spaced x-values are called first differences. When firstdifferences are constant, we have constant slope and the data points fit a linear function. Thisbrings up the question of other polynomials. Is there a similar rule for quadratic, cubic, or otherpolynomial functions? In our study of quadratic functions, we saw that sums of arithmeticseries can be expressed using quadratic functions. An arithmetic sequence is formed bystarting with some number as first term and then adding the same number, the commondifference, to form each successive term. When we formed an arithmetic series, we summedup these terms. Thus, for the sum of an arithmetic series, it takes two steps of calculatingdifferences between terms to get back to the common difference of the original arithmeticsequence. Our next goal is to see that there is a similar situation for all quadratic functions.We start on the path to that goal by considering first differences for the general linear function.4. Every linear function has the form y = ax + b, where a and b are given real numberconstants. We’ll use a general linear function y = ax + b in each part below.a. Complete the table of values below, find the differences between successive y-values,and explain the result in relation to the formula for the general linear function.x y = ax + b First differences–2–1012b. Complete the table of values below and find the slope between each pair of successivepoints. What should this value be?x y = ax + b Slope between points–5–20Math 2 Unit 5 <strong>Lesson</strong> 3 Linear and Quadratic Regression Page 34