Malaria Epidemic Forecasting and Preparedness Manual
Malaria Epidemic Forecasting and Preparedness Manual
Malaria Epidemic Forecasting and Preparedness Manual

Create successful ePaper yourself
Turn your PDF publications into a flip-book with our unique Google optimized e-Paper software.
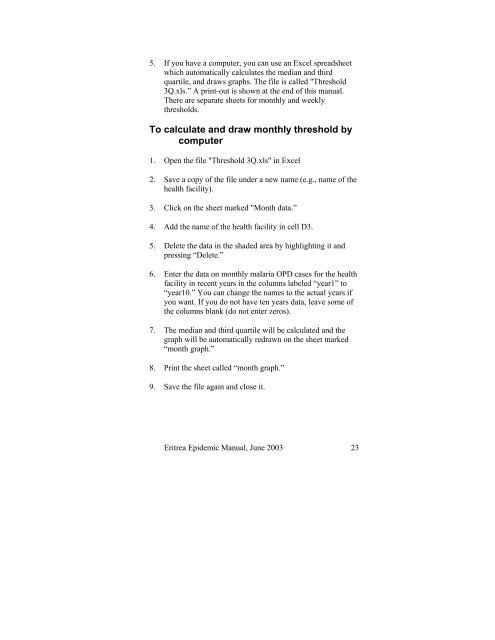
5. If you have a computer, you can use an Excel spreadsheetwhich automatically calculates the median <strong>and</strong> thirdquartile, <strong>and</strong> draws graphs. The file is called "Threshold3Q.xls.” A print-out is shown at the end of this manual.There are separate sheets for monthly <strong>and</strong> weeklythresholds.To calculate <strong>and</strong> draw monthly threshold bycomputer1. Open the file "Threshold 3Q.xls" in Excel2. Save a copy of the file under a new name (e.g., name of thehealth facility).3. Click on the sheet marked "Month data.”4. Add the name of the health facility in cell D3.5. Delete the data in the shaded area by highlighting it <strong>and</strong>pressing “Delete.”6. Enter the data on monthly malaria OPD cases for the healthfacility in recent years in the columns labeled “year1” to“year10.” You can change the names to the actual years ifyou want. If you do not have ten years data, leave some ofthe columns blank (do not enter zeros).7. The median <strong>and</strong> third quartile will be calculated <strong>and</strong> thegraph will be automatically redrawn on the sheet marked“month graph.”8. Print the sheet called “month graph.”9. Save the file again <strong>and</strong> close it.Eritrea <strong>Epidemic</strong> <strong>Manual</strong>, June 2003 23