Malaria Epidemic Forecasting and Preparedness Manual
Malaria Epidemic Forecasting and Preparedness Manual
Malaria Epidemic Forecasting and Preparedness Manual

Create successful ePaper yourself
Turn your PDF publications into a flip-book with our unique Google optimized e-Paper software.
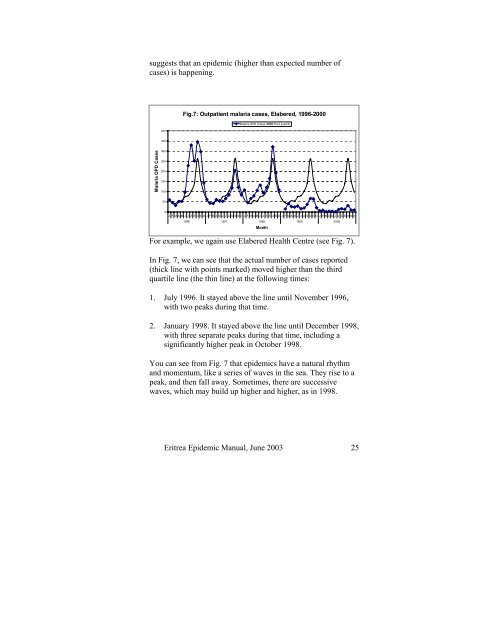
suggests that an epidemic (higher than expected number ofcases) is happening.Fig.7: Outpatient malaria cases, Elabered, 1996-2000<strong>Malaria</strong> OPD CasesThird quartile400350<strong>Malaria</strong> OPD Cases300250200150100500J F M A M J J A S O N D J F M A M J J A S O N D J F M A M J J A S O N D J F M A M J J A S O N D J F M A M J J A S O N D1996 1997 1998 1999 2000MonthFor example, we again use Elabered Health Centre (see Fig. 7).In Fig. 7, we can see that the actual number of cases reported(thick line with points marked) moved higher than the thirdquartile line (the thin line) at the following times:1. July 1996. It stayed above the line until November 1996,with two peaks during that time.2. January 1998. It stayed above the line until December 1998,with three separate peaks during that time, including asignificantly higher peak in October 1998.You can see from Fig. 7 that epidemics have a natural rhythm<strong>and</strong> momentum, like a series of waves in the sea. They rise to apeak, <strong>and</strong> then fall away. Sometimes, there are successivewaves, which may build up higher <strong>and</strong> higher, as in 1998.Eritrea <strong>Epidemic</strong> <strong>Manual</strong>, June 2003 25