

System Level Modeling and Optimization of the LTE Downlink
System Level Modeling and Optimization of the LTE Downlink
System Level Modeling and Optimization of the LTE Downlink
- No tags were found...

You also want an ePaper? Increase the reach of your titles
YUMPU automatically turns print PDFs into web optimized ePapers that Google loves.
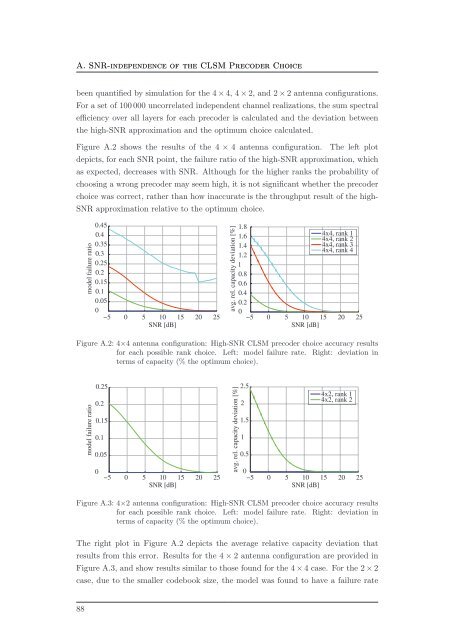
A. SNR-independence <strong>of</strong> <strong>the</strong> CLSM Precoder Choicebeen quantified by simulation for <strong>the</strong> 4 × 4, 4 × 2, <strong>and</strong> 2 × 2 antenna configurations.For a set <strong>of</strong> 100 000 uncorrelated independent channel realizations, <strong>the</strong> sum spectralefficiency over all layers for each precoder is calculated <strong>and</strong> <strong>the</strong> deviation between<strong>the</strong> high-SNR approximation <strong>and</strong> <strong>the</strong> optimum choice calculated.Figure A.2 shows <strong>the</strong> results <strong>of</strong> <strong>the</strong> 4 × 4 antenna configuration. The left plotdepicts, for each SNR point, <strong>the</strong> failure ratio <strong>of</strong> <strong>the</strong> high-SNR approximation, whichas expected, decreases with SNR. Although for <strong>the</strong> higher ranks <strong>the</strong> probability <strong>of</strong>choosing a wrong precoder may seem high, it is not significant whe<strong>the</strong>r <strong>the</strong> precoderchoice was correct, ra<strong>the</strong>r than how inaccurate is <strong>the</strong> throughput result <strong>of</strong> <strong>the</strong> high-SNR approximation relative to <strong>the</strong> optimum choice.model failure ratio0.450.40.350.30.250.20.150.10.050−5 0 5 10 15 20 25SNR [dB]avg. rel. capacity deviation [%]1.81.61.41.210.80.60.40.204x4, rank 14x4, rank 24x4, rank 34x4, rank 4−5 0 5 10 15 20 25SNR [dB]Figure A.2: 4×4 antenna configuration: High-SNR CLSM precoder choice accuracy resultsfor each possible rank choice. Left: model failure rate. Right: deviation interms <strong>of</strong> capacity (% <strong>the</strong> optimum choice).model failure ratio0.250.20.150.10.050−5 0 5 10 15 20 25SNR [dB]avg. rel. capacity deviation [%]2.521.510.504x2, rank 14x2, rank 2−5 0 5 10 15 20 25SNR [dB]Figure A.3: 4×2 antenna configuration: High-SNR CLSM precoder choice accuracy resultsfor each possible rank choice. Left: model failure rate. Right: deviation interms <strong>of</strong> capacity (% <strong>the</strong> optimum choice).The right plot in Figure A.2 depicts <strong>the</strong> average relative capacity deviation thatresults from this error. Results for <strong>the</strong> 4 × 2 antenna configuration are provided inFigure A.3, <strong>and</strong> show results similar to those found for <strong>the</strong> 4 × 4 case. For <strong>the</strong> 2 × 2case, due to <strong>the</strong> smaller codebook size, <strong>the</strong> model was found to have a failure rate88


