

System Level Modeling and Optimization of the LTE Downlink
System Level Modeling and Optimization of the LTE Downlink
System Level Modeling and Optimization of the LTE Downlink
- No tags were found...

You also want an ePaper? Increase the reach of your titles
YUMPU automatically turns print PDFs into web optimized ePapers that Google loves.
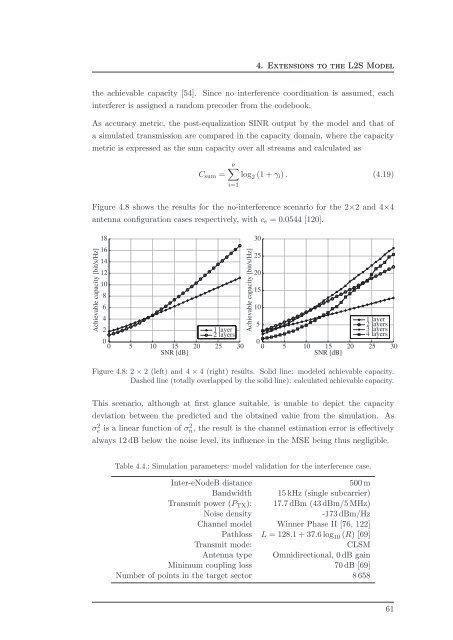
4. Extensions to <strong>the</strong> L2S Model<strong>the</strong> achievable capacity [54]. Since no interference coordination is assumed, eachinterferer is assigned a r<strong>and</strong>om precoder from <strong>the</strong> codebook.As accuracy metric, <strong>the</strong> post-equalization SINR output by <strong>the</strong> model <strong>and</strong> that <strong>of</strong>a simulated transmission are compared in <strong>the</strong> capacity domain, where <strong>the</strong> capacitymetric is expressed as <strong>the</strong> sum capacity over all streams <strong>and</strong> calculated asC sum =ν∑log 2 (1 + γ i ) . (4.19)i=1Figure 4.8 shows <strong>the</strong> results for <strong>the</strong> no-interference scenario for <strong>the</strong> 2×2 <strong>and</strong> 4×4antenna configuration cases respectively, with c e = 0.0544 [120].Achievable capacity [bit/s/Hz]181614121086421 layer2 layers00 5 10 15SNR [dB]20 25 30Achievable capacity [bit/s/Hz]302520151051 layer2 layers3 layers4 layers00 5 10 15SNR [dB]20 25 30Figure 4.8: 2 × 2 (left) <strong>and</strong> 4 × 4 (right) results. Solid line: modeled achievable capacity.Dashed line (totally overlapped by <strong>the</strong> solid line): calculated achievable capacity.This scenario, although at first glance suitable, is unable to depict <strong>the</strong> capacitydeviation between <strong>the</strong> predicted <strong>and</strong> <strong>the</strong> obtained value from <strong>the</strong> simulation. Asσe 2 is a linear function <strong>of</strong> σn, 2 <strong>the</strong> result is <strong>the</strong> channel estimation error is effectivelyalways 12 dB below <strong>the</strong> noise level, its influence in <strong>the</strong> MSE being thus negligible.Table 4.4.: Simulation parameters: model validation for <strong>the</strong> interference case.Inter-eNodeB distance500 mB<strong>and</strong>width 15 kHz (single subcarrier)Transmit power (P TX ): 17.7 dBm (43 dBm/5 MHz)Noise density-173 dBm/HzChannel model Winner Phase II [76, 122]Pathloss L = 128.1 + 37.6 log 10 (R) [69]Transmit mode:CLSMAntenna type Omnidirectional, 0 dB gainMinimum coupling loss 70 dB [69]Number <strong>of</strong> points in <strong>the</strong> target sector 8 65861


