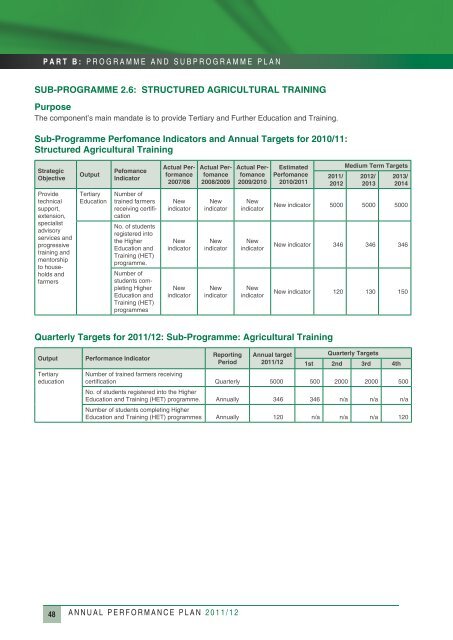
PART B: PROGRAMME AND SUBPROGRAMME PLANSub-programme 2.6: Structured Agricultural TrainingPurposeThe component’s main mandate is to provide Tertiary and Further Education and Training.Sub-Programme Perfomance Indicators and <strong>Annual</strong> Targets for 2010/11:Structured Agricultural TrainingStrategicObjectiveOutputPefomanceIndicatorActual <strong>Performance</strong>2007/08Actual Perfomance2008/2009Actual Perfomance2009/2010EstimatedPerfomance2010/<strong>2011</strong><strong>2011</strong>/<strong>2012</strong>Medium Term Targets<strong>2012</strong>/20132013/2014Providetechnicalsupport,extension,specialistadvisoryservices andprogressivetraining andmentorshipto householdsandfarmersTertiaryEducationNumber <strong>of</strong>trained farmersreceiving certificationNo. <strong>of</strong> studentsregistered intothe HigherEducation andTraining (HET)programme.Number <strong>of</strong>students completingHigherEducation andTraining (HET)programmesNewindicatorNewindicatorNewindicatorNewindicatorNewindicatorNewindicatorNewindicatorNewindicatorNewindicatorNew indicator 5000 5000 5000New indicator 346 346 346New indicator 120 130 150Quarterly Targets for <strong>2011</strong>/12: Sub-Programme: Agricultural TrainingOutputTertiaryeducation<strong>Performance</strong> IndicatorReportingPeriod<strong>Annual</strong> target<strong>2011</strong>/12Quarterly Targets1st 2nd 3rd 4thNumber <strong>of</strong> trained farmers receivingcertification Quarterly 5000 500 2000 2000 500No. <strong>of</strong> students registered into the HigherEducation and Training (HET) programme. <strong>Annual</strong>ly 346 346 n/a n/a n/aNumber <strong>of</strong> students completing HigherEducation and Training (HET) programmes <strong>Annual</strong>ly 120 n/a n/a n/a 12048 ANNUAL PERFORMANCE PLAN <strong>2011</strong>/12
PART B: PROGRAMME AND SUBPROGRAMME PLANSummary <strong>of</strong> Payments and EstimatesSummary <strong>of</strong> payments and estimates – Programme 2: Agricultural Development ServicesR thousandAudited OutcomeMainAppropriationAdjustedAppropriationRevisedEstimateMedium-term Estimates2007/08 2008/09 2009/10 2010/11 <strong>2011</strong>/12 <strong>2012</strong>/13 2013/14Sustainable ResourceManagement 56,099 79,618 89,037 97,842 98,168 98,168 103,696 119,343 123,232Engineering Services 38,601 63,877 58,637 70,691 71,017 71,017 74,988 79,064 83,413Land Care 17,498 15,741 30,400 27,151 27,151 27,151 28,708 40,279 39,819Farmer Support and Development 379,563 647,288 653,326 869,454 890,664 890,664 992,048 1,056,645 1,148,475Farmer Settlement 28,450 43,518 71,065 138,521 150,086 150,086 137,472 144,485 143,182Extension and Advisory Services 351,113 603,770 545,191 676,441 686,086 686,086 793,363 847,817 937,413Food Security –- –- 37,070 54,492 54,492 54,492 61,213 64,343 67,880Veterinary Services 76,969 91,331 106,173 113,777 121,251 121,251 130,740 138,397 135,153Animal Health 76,969 91,331 106,173 113,777 121,251 121,251 130,740 138,397 135,153Technology Research andDevelopment Services 70,330 111,796 118,056 134,525 129,963 129,963 143,671 151,914 160,129Research 70,330 111,796 118,056 134,525 129,963 129,963 143,671 151,914 160,129Agricultural Economics 707 1,734 2,277 2,809 2,809 2,809 2,971 3,120 3,292Agri-Business Development &Support 707 1,734 2,277 2,809 2,809 2,809 2,971 3,120 3,292Structured Agricultural Training 33,237 56,341 58,217 72,330 76,474 76,474 79,391 83,751 88,357Tertiary Education 33,237 56,341 58,217 72,330 76,474 76,474 79,391 83,751 88,357Total 616,905 988,108 1,027,086 1,290,737 1,319,329 1,319,329 1,452,517 1,553,170 1,658,638Summary <strong>of</strong> payments and estimates by economic classification - Programme 2: AgriculturalDevelopment ServicesMainAppropriationAdjustedAppropriationRevisedEstimateR thousandAudited OutcomeMedium–term Estimates2007/08 2008/09 2009/10 2010/11 <strong>2011</strong>/12 <strong>2012</strong>/13 2013/14Current payments 587,067 846,575 868,110 1,105,336 1,086,979 1,086,979 1,222,802 1,312,462 1,417,400Compensation <strong>of</strong> employees 383,452 427,377 453,849 521,228 502,815 502,815 589,184 631,148 669,328Goods and services 203,615 419,198 414,261 584,108 584,164 584,164 633,618 681,314 748,072Interest and rent on land – – – – – – – – –Transfers and subsidies to: 21,425 59,687 45,434 20,010 116,414 116,414 120,647 126,388 120,318Provinces and municipalities 13 – – – – – – – –<strong>Department</strong>al agencies andaccounts – – – – 71,812 71,812 75,400 79,170 83,100Universities and technikons – – – – – – – – –Foreign gouts and internationalorganisations – – – – – – – – –Public corporations and privateenterprises 13,503 52,666 36,062 14,457 31,374 31,374 30,167 31,402 31,388Non–pr<strong>of</strong>it institutions – – 35 – 7,474 7,474 9,810 10,290 –Households 7,909 7,021 9,337 5,553 5,754 5,754 5,270 5,526 5,830Payments for capital assets 8,413 74,803 110,506 165,391 115,936 115,936 109,068 114,320 120,920Buildings and other fixedstructures 1,759 51,283 61,293 139,919 60,854 60,854 83,934 87,953 93,111Machinery and equipment 6,555 23,520 48,624 24,764 54,374 54,374 24,392 25,591 26,996Heritage assets – – – – – – – – –Specialised military assets – – – – – – – – –Biological assets 99 – 360 336 336 336 354 371 389Land and sub–soil assets – – – – – – – – –S<strong>of</strong>tware and other intangibleassets – – 229 372 372 372 388 405 424Payments for financial assets – 7,043 3,036 – – – – – –Total 616,905 988,108 1,027,086 1,290,737 1,319,329 1,319,329 1,452,517 1,553,170 1,658,638ANNUAL PERFORMANCE PLAN <strong>2011</strong>/1249