Annual Performance Plan 2011/2012 - Department of Agriculture ...
Annual Performance Plan 2011/2012 - Department of Agriculture ...
Annual Performance Plan 2011/2012 - Department of Agriculture ...
- No tags were found...

Create successful ePaper yourself
Turn your PDF publications into a flip-book with our unique Google optimized e-Paper software.
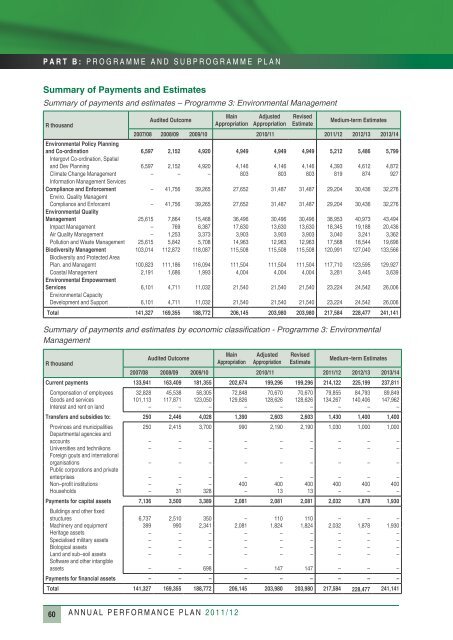
PART B: PROGRAMME AND SUBPROGRAMME PLANSummary <strong>of</strong> Payments and EstimatesSummary <strong>of</strong> payments and estimates – Programme 3: Environmental ManagementR thousandAudited OutcomeMainAppropriationAdjustedAppropriationRevisedEstimateMedium-term Estimates2007/08 2008/09 2009/10 2010/11 <strong>2011</strong>/12 <strong>2012</strong>/13 2013/14Environmental Policy <strong>Plan</strong>ningand Co-ordination 6,597 2,152 4,920 4,949 4,949 4,949 5,212 5,486 5,799Intergovt Co-ordination, Spatialand Dev <strong>Plan</strong>ning 6,597 2,152 4,920 4,146 4,146 4,146 4,393 4,612 4,872Climate Change Management – – – 803 803 803 819 874 927Information Management ServicesCompliance and Enforcement – 41,756 39,265 27,652 31,487 31,487 29,204 30,436 32,276Enviro. Quality ManagemtCompliance and Enforcemt – 41,756 39,265 27,652 31,487 31,487 29,204 30,436 32,276Environmental QualityManagement 25,615 7,864 15,468 36,496 30,496 30,496 38,953 40,973 43,494Impact Management – 769 6,387 17,630 13,630 13,630 18,345 19,188 20,436Air Quality Management – 1,253 3,373 3,903 3,903 3,903 3,040 3,241 3,362Pollution and Waste Management 25,615 5,842 5,708 14,963 12,963 12,963 17,568 18,544 19,696Biodiversity Management 103,014 112,872 118,087 115,508 115,508 115,508 120,991 127,040 133,566Biodiversity and Protected Area<strong>Plan</strong>. and Managemt 100,823 111,186 116,094 111,504 111,504 111,504 117,710 123,595 129,927Coastal Management 2,191 1,686 1,993 4,004 4,004 4,004 3,281 3,445 3,639Environmental EmpowermentServices 6,101 4,711 11,032 21,540 21,540 21,540 23,224 24,542 26,006Environmental CapacityDevelopment and Support 6,101 4,711 11,032 21,540 21,540 21,540 23,224 24,542 26,006Total 141,327 169,355 188,772 206,145 203,980 203,980 217,584 228,477 241,141Summary <strong>of</strong> payments and estimates by economic classification - Programme 3: EnvironmentalManagementMainAppropriationAdjustedAppropriationRevisedEstimateR thousandAudited OutcomeMedium–term Estimates2007/08 2008/09 2009/10 2010/11 <strong>2011</strong>/12 <strong>2012</strong>/13 2013/14Current payments 133,941 163,409 181,355 202,674 199,296 199,296 214,122 225,199 237,811Compensation <strong>of</strong> employees 32,828 45,538 58,305 72,848 70,670 70,670 79,855 84,793 89,849Goods and services 101,113 117,871 123,050 129,826 128,626 128,626 134,267 140,406 147,962Interest and rent on land – – – – – – – – –Transfers and subsidies to: 250 2,446 4,028 1,390 2,603 2,603 1,430 1,400 1,400Provinces and municipalities 250 2,415 3,700 990 2,190 2,190 1,030 1,000 1,000<strong>Department</strong>al agencies andaccounts – – – – – – – – –Universities and technikons – – – – – – – – –Foreign gouts and internationalorganisations – – – – – – – – –Public corporations and privateenterprises – – – – – – – – –Non–pr<strong>of</strong>it institutions – – – 400 400 400 400 400 400Households – 31 328 – 13 13 – – –Payments for capital assets 7,136 3,500 3,389 2,081 2,081 2,081 2,032 1,878 1,930Buildings and other fixedstructures 6,737 2,510 350 – 110 110 – – –Machinery and equipment 399 990 2,341 2,081 1,824 1,824 2,032 1,878 1,930Heritage assets – – – – – – – – –Specialised military assets – – – – – – – – –Biological assets – – – – – – – – –Land and sub–soil assets – – – – – – – – –S<strong>of</strong>tware and other intangibleassets – – 698 – 147 147 – – –Payments for financial assets – – – – – – – – –Total 141,327 169,355 188,772 206,145 203,980 203,980 217,584 228,477 241,14160 ANNUAL PERFORMANCE PLAN <strong>2011</strong>/12