- Page 1 and 2:
PORTUGUESE NATIONAL INVENTORY REPOR
- Page 3 and 4:
AcknowledgementsThe authors wish to
- Page 5 and 6:
Table of ContentsPreface ..........
- Page 7 and 8:
6.3.4 N2O Emissions from Manure Man
- Page 9 and 10:
10.1.4 Description of precedence co
- Page 12 and 13:
IndexMton CO2 eq.Executive Summaryi
- Page 14 and 15:
Executive SummaryTable ES. 1 - GHG
- Page 16 and 17:
Executive SummaryFigure below prese
- Page 18 and 19:
Introduction1 INTRODUCTION1.1 Backg
- Page 20 and 21:
IntroductionAt present, inter<stron
- Page 22 and 23:
Introductionremovals by sinks of al
- Page 24 and 25:
Introductionupdating of the Nationa
- Page 26 and 27:
IntroductionTable 1.2 - Bodies that
- Page 28 and 29:
IntroductionTable 1.3 - Calendar fo
- Page 30 and 31:
IntroductionFigure 1.2 - Main eleme
- Page 32 and 33:
Introduction1.4 General overview of
- Page 34 and 35:
IntroductionCRF 6 - WasteIPCC categ
- Page 36 and 37:
Introduction1.6 Information on QA/Q
- Page 38 and 39:
Gg CO2eIntroductionFigure 1.4 - Tre
- Page 40 and 41:
TrendsFigure 2.2 - Primary energy c
- Page 42 and 43:
Trendsoptimization of the ratio amm
- Page 44 and 45:
TrendsTable 2.1 - GHG emissions and
- Page 46 and 47:
TrendsEmissions (Figure 2.11, Table
- Page 48 and 49:
TrendsMobile sources, which are lar
- Page 50 and 51:
Trendsmajority imported. The situat
- Page 52 and 53:
EnergyFigure 3.2 - Importance of CO
- Page 54 and 55:
Energysources, respectively 0.6 per
- Page 56 and 57:
TJ199019911992199319941995199619971
- Page 58 and 59:
Energy Consumption (TJ)Dif. SA vs R
- Page 60 and 61:
EnergyTable 3.1 - Large Point Sourc
- Page 62 and 63:
EnergyThere are two small gas turbi
- Page 64 and 65:
Energy3.3.1.1.1.5 Municipal Solid W
- Page 66 and 67:
EnergySince the methodology for det
- Page 68 and 69:
Energy- Plant activity repo
- Page 70 and 71:
Energy Consumption (PJ/yr)EnergyFig
- Page 72 and 73:
Consumption (ton)Consumption (ton)C
- Page 74 and 75:
EnergyFigure 3.14 - Comparison of f
- Page 76 and 77:
Energyindustrial combustion. These
- Page 78 and 79:
Fuel consumption (kton/yr)199019911
- Page 80 and 81:
FO consumptionFG consumption1990199
- Page 82 and 83:
EnergyEF (f,p) - Emission factor po
- Page 84 and 85:
EnergyTable 3.12 - NCV/LHV per fuel
- Page 86 and 87:
EnergyEF (p) - Emission Factor for
- Page 88 and 89:
Energy- information received by APA
- Page 90 and 91:
For productionof secondaryenergysou
- Page 92 and 93:
EnergyTable 3.18 - Fuel consumption
- Page 94 and 95:
Energy Consumption (PJ)EnergyThe ex
- Page 96 and 97:
Energy Consumption (PJ)EnergyTable
- Page 98 and 99:
EnergyTable 3.25 - Fuel consumption
- Page 100 and 101:
Energy Consumption (PJ)EnergyTwo in
- Page 102 and 103:
Energy Consumption (PJ)Energyalmost
- Page 104 and 105:
EnergyYearTable 3.32 - Fuel consump
- Page 106 and 107:
EnergyFigure 3.31 - Fuel consumptio
- Page 108 and 109:
Energy Consumption (PJ)EnergyFigure
- Page 110 and 111:
Energy Consumption (PJ)EnergyThe fi
- Page 112 and 113:
Energy Consumption (PJ)EnergyTable
- Page 114 and 115:
Energy Consumption (PJ)EnergyEven t
- Page 116 and 117:
Energy Consumption (PJ)EnergyTable
- Page 118 and 119:
EnergyTable 3.48 - Fuel consumption
- Page 120 and 121:
EnergyTable 3.51 - Fuel consumption
- Page 122 and 123:
EnergyTable 3.54- Fuel consumption
- Page 124 and 125:
EnergyFigure 3.47 - Fuel consumptio
- Page 126 and 127:
Energy Consumption (PJ)EnergyAn inc
- Page 128 and 129:
Energy Consumption (PJ)EnergyTable
- Page 130 and 131:
Energy Consumption (PJ)EnergyTable
- Page 132 and 133:
Consumption (t/yr)Consumption (t/yr
- Page 134 and 135:
Consumption (t/yr)Consumption (t/yr
- Page 136 and 137:
EnergyFigure 3.57 - Comparison of t
- Page 138 and 139:
Paper Pulp Production (kton)EnergyF
- Page 140 and 141:
Glass Production (kton/yr)Ceramic P
- Page 142 and 143:
EnergyTable 3.67 - Default emission
- Page 144 and 145:
EnergyTable 3.71 - Emission factors
- Page 146 and 147:
Energy3.3.2.4 Uncertainty Assessmen
- Page 148 and 149:
EnergyFor the elaboration of the gr
- Page 150 and 151:
EnergyFigure 3.61 - Decision tree f
- Page 152 and 153:
EnergyTable 3.78 - Emissions factor
- Page 154 and 155:
EnergyTable 3.80 - Cruise emissions
- Page 156 and 157:
EnergyCodeAircraft NameFuelTypeDesc
- Page 158 and 159:
EnergyCodeAircraft NameFuelTypeDesc
- Page 160 and 161:
EnergyCodeAircraft NameFuelTypeDesc
- Page 162 and 163:
EnergyCodeAircraft NameFuelTypeDesc
- Page 164 and 165:
EnergyCodeAircraft NameFuelTypeDesc
- Page 166 and 167:
EnergyIs it availablethe connection
- Page 168 and 169:
Energy3.3.3.2 Road Transportation (
- Page 170 and 171:
Energy3.3.3.2.2.1 Vehicle FleetA fu
- Page 172 and 173:
EnergyTable 3.87 - Km per year per
- Page 174 and 175:
EnergySector Subsector Technology 1
- Page 176 and 177:
EnergyFCvkm FC ,10 f y c , t,m,f ,
- Page 178 and 179:
EnergyTable 3.91 - Technology class
- Page 180 and 181:
Energy2000 although the regulatory
- Page 182 and 183:
Energy3.3.3.2.3 Implied Emission Fa
- Page 184 and 185:
EnergyThe implied emission factors
- Page 186 and 187:
EnergyTable 3.100 - Kilometers trav
- Page 188 and 189:
Diesel oil (ton/yr)Energy3.3.3.3.3
- Page 190 and 191:
EnergyDetermine distancefrom the se
- Page 192 and 193:
Energy3.3.3.4.4 Activity Data3.3.3.
- Page 194 and 195:
Energy3.3.3.4.4.2 Ship FleetThe fle
- Page 196 and 197:
EnergyTable 3.107 - Estimated fuel
- Page 198 and 199:
Energy3.3.3.4.4.3.1 Tugs Fuel consu
- Page 200 and 201:
EnergyAll methodologic descriptions
- Page 202 and 203:
EnergyTable 3.112 - Fuels consumed
- Page 204 and 205:
EnergyTable 3.113 - Emissions facto
- Page 206 and 207:
EnergyTable 3.114 - Fuels consumpti
- Page 208 and 209:
Energy3.3.4.1.2.4 Emission FactorsT
- Page 210 and 211:
Energy3.3.4.1.3.3 Activity DataData
- Page 212 and 213:
Energy3.3.4.1.3.4 Emission FactorsT
- Page 214 and 215:
Gas oil (ton/yr)EnergyFigure 3.76 -
- Page 216 and 217:
EnergyEnergy Cons(u,f) - Consumptio
- Page 218 and 219:
EnergyTable 3.119 - Fuels consumed
- Page 220 and 221:
EnergyTable 3.120 - Fuels consumed
- Page 222 and 223:
Energy- US EPAP-42 and EIIP (USEPA1
- Page 224 and 225:
EnergyAccording with the IPCC Good
- Page 226 and 227:
Energythis emission source is no ke
- Page 228 and 229:
Energy- Emissions from refinery dis
- Page 230 and 231: kton of product19901991199219931994
- Page 232 and 233: Energyestimated using the emission
- Page 234 and 235: EnergyTable 3.128 - Types of losses
- Page 236 and 237: Throughput (ton/yr)1990199119921993
- Page 238 and 239: EnergyWhere,E FUT - Emissions Filli
- Page 240 and 241: Energyhas became more widespread an
- Page 242 and 243: Pipelines (km)t/yrEnergypipeline. B
- Page 244 and 245: Energy3.3.7.3.6 Category-specific Q
- Page 246 and 247: Gas (ton/yr)19901991199219931994199
- Page 248 and 249: Energy3.3.7.5.2 MethodologyFrom 199
- Page 250 and 251: Energy3.4 RecalculationsThe main re
- Page 252 and 253: EnergyTable 3.136 - Recalculations
- Page 254 and 255: Energy3.5.2 MethodologyThe followin
- Page 256 and 257: EnergyTable 3.138 - Reference Appro
- Page 258 and 259: Energycontributes to decrease the d
- Page 260 and 261: Emission kt CO2e1990199119921993199
- Page 262 and 263: Industrial Processes4.3 Category So
- Page 264 and 265: Comparison between methodologies (%
- Page 266 and 267: Industrial ProcessesEmi CO2 = Kiln
- Page 268 and 269: Industrial Processes4.3.1.3 Limesto
- Page 270 and 271: Consumption of raw materials (ton)1
- Page 272 and 273: Industrial Processes4.3.1.4.2 Metho
- Page 274 and 275: Bitumen (kton/yr)199019911992199319
- Page 276 and 277: Industrial Processes4.3.1.4.6 Recal
- Page 278 and 279: 19901991199219931994199519961997199
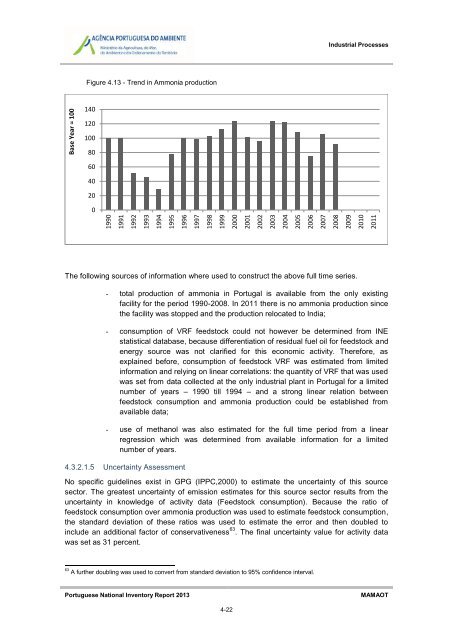
- Page 282 and 283: Base Year = 10019901991199219931994
- Page 284 and 285: Industrial ProcessesIn the case of
- Page 286 and 287: Industrial Processes4.3.2.3.7 Furth
- Page 288 and 289: Industrial ProcessesEmission (p,y)
- Page 290 and 291: kton1990200219912003199220041993200
- Page 292 and 293: Industrial Processes4.3.4.1.2 Metho
- Page 294 and 295: 19901991199219931994199519961997199
- Page 296 and 297: Industrial ProcessesSome emission s
- Page 298 and 299: Imports of Blends and Pure Gases (%
- Page 300 and 301: Industrial Processes4.3.5.6 Domesti
- Page 302 and 303: Assembled Units19901991199219931994
- Page 304 and 305: Industrial ProcessesAssemblyAss Emi
- Page 306 and 307: Industrial ProcessesTable 4.19 - Nu
- Page 308 and 309: Assembled Units19901991199219931994
- Page 310 and 311: Number of Assembled EquipmentsIndus
- Page 312 and 313: Industrial ProcessesTable 4.25 - Un
- Page 314 and 315: Number of EquipmentsNumber of Equip
- Page 316 and 317: Number of EquipmentsNumber of Equip
- Page 318 and 319: Industrial ProcessesOperation/Lifet
- Page 320 and 321: Number of Vehicles19951996199719981
- Page 322 and 323: Industrial ProcessesAnnual losses.F
- Page 324 and 325: Number ofUnits199519961997199819992
- Page 326 and 327: Industrial Processes4.3.5.14.5 Unce
- Page 328 and 329: Industrial ProcessesFigure 4.38 - F
- Page 330 and 331:
Industrial ProcessesSource: REN - R
- Page 332 and 333:
Industrial Processes- Gas Insulated
- Page 334 and 335:
Solvent and Other Product Use5 SOLV
- Page 336 and 337:
Solvent and Other Product UseTable
- Page 338 and 339:
Solvent and Other Product UseDefaul
- Page 340 and 341:
Solvent and Other Product UseTable
- Page 342 and 343:
Solvent and Other Product Use5.3.1.
- Page 344 and 345:
Solvent and Other Product UseTable
- Page 346 and 347:
Solvent and Other Product UseTable
- Page 348 and 349:
Solvent and Other Product Use5.3.1.
- Page 350 and 351:
Solvent and Other Product Use5.3.2.
- Page 352 and 353:
Solvent and Other Product Usespecif
- Page 354 and 355:
Solvent and Other Product UseTable
- Page 356 and 357:
Solvent and Other Product Use5.3.3.
- Page 358 and 359:
Solvent and Other Product Use( )
- Page 360 and 361:
Solvent and Other Product UseTable
- Page 362 and 363:
Solvent and Other Product UseEmi NM
- Page 364 and 365:
Solvent and Other Product Use5.3.4.
- Page 366 and 367:
Solvent and Other Product UseFor no
- Page 368 and 369:
Solvent and Other Product Usewhere:
- Page 370 and 371:
CH 4 (Gg/yr)AgricultureThe majority
- Page 372 and 373:
AgricultureThis integration of calc
- Page 374 and 375:
Agriculture6.3 Source categories6.3
- Page 376 and 377:
AgricultureTable 6.2 - Emission Fac
- Page 378 and 379:
AgricultureAssuming a constant meth
- Page 380 and 381:
Weight (kg)Weight gain (kg/day)Agri
- Page 382 and 383:
AgricultureTable 6.7 - Determinatio
- Page 384 and 385:
AgricultureTable 6.9 - Methane emis
- Page 386 and 387:
AgricultureC fi - a coefficient for
- Page 388 and 389:
AgricultureFollowing recommendation
- Page 390 and 391:
AgricultureTable 6.17 - Parameters
- Page 392 and 393:
Livestock (10 3 head)Agriculture- G
- Page 394 and 395:
Carcass Weight (kg/hd)Ovines Slaugh
- Page 396 and 397:
Ovine199019911992199319941995199619
- Page 398 and 399:
AgricultureTable 6.20 - Uncertainty
- Page 400 and 401:
AgricultureFigure 6.17 - Relative I
- Page 402 and 403:
AgricultureTable 6.21 - Parameters
- Page 404 and 405:
AgricultureTable 6.22 - Methane emi
- Page 406 and 407:
AgricultureFigure 6.18 - Percentage
- Page 408 and 409:
AgricultureTable 6.24 - Percentage
- Page 410 and 411:
AgricultureTable 6.26 - Uncertainty
- Page 412 and 413:
SFoAgricultureThe time series of th
- Page 414 and 415:
AgricultureRelevant characteristics
- Page 416 and 417:
Agriculture6.3.4.2 MethodologyEmiss
- Page 418 and 419:
AgricultureThe following section pr
- Page 420 and 421:
AgricultureTable 6.31 - N excretion
- Page 422 and 423:
AgricultureTable 6.32 - Total Nitro
- Page 424 and 425:
Agricultureinstallations use mostly
- Page 426 and 427:
AgricultureThe situation concerning
- Page 428 and 429:
AgricultureFSN = N Fert * (1-Frac G
- Page 430 and 431:
Agriculturei - Animal/species categ
- Page 432 and 433:
AgricultureFigure 6.28 - Sources of
- Page 434 and 435:
ton N/yrAgricultureFigure 6.30 - Us
- Page 436 and 437:
AgricultureTable 6.34 - Emission fa
- Page 438 and 439:
AgricultureTable 6.36 - Annual (thr
- Page 440 and 441:
AgricultureCrop 1990 1995 2000 2005
- Page 442 and 443:
AgricultureTable 6.39 - Parameters
- Page 444 and 445:
Agriculture- Update of milk product
- Page 446 and 447:
AgricultureFigure 6.32 - Relative i
- Page 448 and 449:
Agriculturemanner the AD to estimat
- Page 450 and 451:
Agriculture6.3.6.4 Activity DataEmi
- Page 452 and 453:
AgricultureFigure 6.33 - Percent im
- Page 454 and 455:
AgricultureFigure 6.34 - percent im
- Page 456 and 457:
AgricultureEmission (p,crop,y) - Em
- Page 458 and 459:
AgricultureTable 6.46 - Emission fa
- Page 460 and 461:
AgricultureTable 6.49 - Crop area p
- Page 462 and 463:
AgricultureN Fert - total amount of
- Page 464 and 465:
Agriculture- Annual consumption of
- Page 466 and 467:
AgricultureTable 6.51 - Emission fa
- Page 468 and 469:
AgricultureFigure 6.39 - Sources of
- Page 470 and 471:
LULUCF7 LAND USE, LAND USE CHANGE A
- Page 472 and 473:
LULUCFTable 7.1 - Land-use categori
- Page 474 and 475:
LULUCF∑= Sum of all points classi
- Page 476 and 477:
LULUCF1. The categories “burnt fo
- Page 478 and 479:
LULUCFWhere:= Land-use change from
- Page 480 and 481:
LULUCFTable 7.7 - Annual Land-use c
- Page 482 and 483:
LULUCFFigure 7.7 - Changes in Total
- Page 484 and 485:
LULUCFFigure 7.8 - Changes in Total
- Page 486 and 487:
LULUCFThe allocation of land to the
- Page 488 and 489:
LULUCFEquation 7.8 - Estimation of
- Page 490 and 491:
LULUCFFigure 7.11 - Total Areas per
- Page 492 and 493:
Dominated speciesLULUCFWhere:= Mean
- Page 494 and 495:
Dominated speciesDominated speciesD
- Page 496 and 497:
LULUCFA similar approach was made t
- Page 498 and 499:
LULUCFBelow ground and total living
- Page 500 and 501:
LULUCFGiven the relatively low numb
- Page 502 and 503:
LULUCFFigure 7.14: Total Emissions
- Page 504 and 505:
LULUCF∑ ( )∑ ( )Where:= Living
- Page 506 and 507:
LULUCFFigure 7.15 - Areas of Cropla
- Page 508 and 509:
LULUCFFigure 7.17 - Increase in Car
- Page 510 and 511:
LULUCF7.4.1 Grassland Remaining Gra
- Page 512 and 513:
LULUCF7.5 Wetlands (CRF 5.D)The are
- Page 514 and 515:
LULUCFFigure 7.23 - Areas of Settle
- Page 516 and 517:
LULUCFFigure 7.25 - Areas of Other
- Page 518 and 519:
19001905191019151920192519301935194
- Page 520 and 521:
LULUCF7.12 CO2 Emissions from Agric
- Page 522 and 523:
LULUCFFigure 7.29 - Burnt Areas per
- Page 524 and 525:
LULUCF7.13.5 Direct N2O Emissions f
- Page 526 and 527:
LULUCFIssues detected by and recomm
- Page 528 and 529:
Waste8 WASTE (CRF 6.)8.1 OverviewWa
- Page 530 and 531:
WasteFigure 8.2 - Sources of GHG in
- Page 532 and 533:
Gg CO2 e.Gg CO2 e.WasteFigure 8.4 -
- Page 534 and 535:
WasteFraction of degradable organic
- Page 536 and 537:
ktonkg/inh/yearWasteFigure 8.5 - Ur
- Page 538 and 539:
Waste8.2.1.1.2.1.3 Other parameters
- Page 540 and 541:
ktonWasteAll industrial waste was c
- Page 542 and 543:
Waste8.2.2.1.1 CH4 emissions from W
- Page 544 and 545:
kton BOD51000 inhabitantsWasteFigur
- Page 546 and 547:
WasteTable 8.6 - Wastewater handlin
- Page 548 and 549:
WasteN2O (S) = Protein * Frac NPR *
- Page 550 and 551:
WasteRec CH4(I,h) - Quantity of met
- Page 552 and 553:
Waste- In-depth analysis of the act
- Page 554 and 555:
WasteTable 8.10 - Sources of Inform
- Page 556 and 557:
Wastewas available: paper pulp prod
- Page 558 and 559:
WasteTable 8.12 - Methane Conversio
- Page 560 and 561:
COD (kt/yr)CH4 (t/yr)WasteFigure 8.
- Page 562 and 563:
inhab-eq. (thousand)WasteFigure 8.1
- Page 564 and 565:
WasteEmissions associated with the
- Page 566 and 567:
Wastesecond combustion chamber or t
- Page 568 and 569:
WasteIW i = Amount of incinerated w
- Page 570 and 571:
Waste8.2.4.2 Activity data and para
- Page 572 and 573:
WasteFinally the error was determin
- Page 574 and 575:
WasteAn analysis of emission trends
- Page 576 and 577:
Waste8.6 Further ImprovementsContin
- Page 578 and 579:
WasteTable 8.24 - Fermentable indus
- Page 580 and 581:
WasteTable 8.27 - Quantities of CH4
- Page 582 and 583:
WasteTable 8.29 - MSW waste inciner
- Page 584 and 585:
Recalculations and Improvements9 RE
- Page 586 and 587:
Recalculations and ImprovementsCRF
- Page 588 and 589:
Recalculations and ImprovementsCRF
- Page 590 and 591:
Recalculations and Improvements9.2
- Page 592 and 593:
Recalculations and Improvements1.A.
- Page 594 and 595:
Recalculations and ImprovementsCRF
- Page 596 and 597:
Recalculations and ImprovementsFigu
- Page 598 and 599:
Recalculations and Improvementsand
- Page 600 and 601:
KP-LULUCFConcerning fire prevention
- Page 602 and 603:
KP-LULUCF10.3.1.4 Article 3.4 - Cro
- Page 604 and 605:
Kyoto Units11 INFORMATION ON ACCOUN
- Page 606 and 607:
Changes in National Registry13 INFO
- Page 608 and 609:
Changes in National RegistryReporti
- Page 610 and 611:
Changes in National RegistryReporti
- Page 612 and 613:
Minimization of Adverse Impacts14 I
- Page 614 and 615:
Acronyms15 List of AcronymsABS Acry
- Page 616 and 617:
AcronymsGWP Global Warming Potentia
- Page 618 and 619:
AcronymsPNACNational Climate Change
- Page 620 and 621:
BibliographyCaetano, M., Carrão H.
- Page 622 and 623:
BibliographyDirecção-Geral de Ene
- Page 624 and 625:
BibliographyGT SNIERPA 3.3/3.4 (Gru
- Page 626 and 627:
BibliographyMADRP/DGPC (MINISTÉRIO
- Page 628 and 629:
BibliographyRosa, I (2009). Estimat
- Page 630 and 631:
BibliographyEmissions Inventory Bra
- Page 632 and 633:
BibliographyEmissions Inventory Bra
- Page 634 and 635:
BibliographyEmissions Inventory Bra
- Page 636 and 637:
BibliographyPortuguese National Inv
- Page 638 and 639:
AnnexesTrend Assessment with Uncert
- Page 640 and 641:
AnnexesTable A. 2 - Tier 2 Level as
- Page 642 and 643:
AnnexesTable A. 4 - Tier 2 Trend as
- Page 644 and 645:
AnnexesUncertainty Values(PVC, Poly
- Page 646 and 647:
Annexes- AD Uncertainty: uncertaint
- Page 648 and 649:
AnnexesCategory Individual Category
- Page 650 and 651:
AnnexesCategory Individual Category
- Page 652 and 653:
AnnexesCategory Individual Category
- Page 654 and 655:
AnnexesCategory Individual Category
- Page 656 and 657:
AnnexesANNEX C: Energy Balance Shee
- Page 658 and 659:
ANNEX D: Standard Electronic Format
- Page 660 and 661:
Tables 2b and 2cAdd registryDelete
- Page 662 and 663:
Table 4PartyPortugalSubmission year
- Page 664 and 665:
Tables 6a, 6b and 6cPartyPortugalSu


