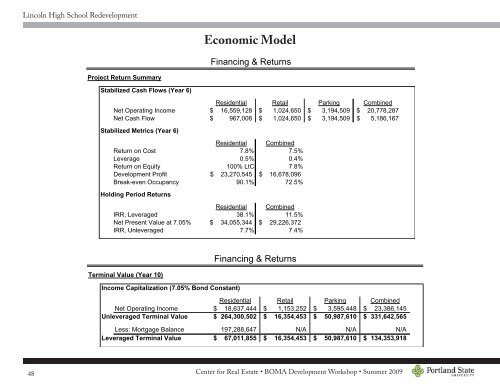
<strong>Lincoln</strong> <strong>High</strong> <strong>School</strong> <strong>Redevelopment</strong>Economic ModelFinancing & ReturnsProject Return SummaryStabilized Cash Flows (Year 6)Residential Retail Parking CombinedNet Operating Income $ 16,559,128 $ 1,024,650 $ 3,194,509 $ 20,778,287Net Cash Flow $ 967,008 $ 1,024,650 $ 3,194,509 $ 5,186,167Stabilized Metrics (Year 6)Residential CombinedReturn on Cost 7.8% 7.5%Leverage 0.5% 0.4%Return on Equity 100% LtC 7.8%Development Profit $ 23,270,545 $ 16,678,096Break-even Occupancy 90.1% 72.5%Holding Period ReturnsResidential CombinedIRR, Leveraged 38.1% 11.5%Net Present Value at 7.05% $ 34,055,344 $ 29,226,372IRR, Unleveraged 7.7% 7.4%Financing & ReturnsTerminal Value (Year 10)Income Capitalization (7.05% Bond Constant)Residential Retail Parking CombinedNet Operating Income $ 18,637,444 $ 1,153,252 $ 3,595,448 $ 23,386,145Unleveraged Terminal Value $ 264,300,502 $ 16,354,453 $ 50,987,610 $ 331,642,565Less: Mortgage Balance 197,288,647 N/A N/A N/ALeveraged Terminal Value $ 67,011,855 $ 16,354,453 $ 50,987,610 $ 134,353,91848Center for Real Estate • BOMA Development Workshop • Summer 2009
<strong>Lincoln</strong> <strong>High</strong> <strong>School</strong> <strong>Redevelopment</strong>Economic ModelConsolidated Pro Forma Income <strong>State</strong>mentStabilized YearBuilding Summary Year 0 Year 1 Year 2 Year 3 Year 4 Year 5 Year 6 Year 10Residential Units 635 903 1,249 1,462 1,682 1,682 1,682Parking Stalls 878 1,678 1,678 1,678 1,678 1,678 1,678Square Feet, Residential 323,526 501,409 797,879 927,056 1,110,232 1,110,232 1,110,232Square Feet, Retail 49,600 49,600 49,600 49,600 49,600 49,600 49,600Square Feet, Parking 347,000 640,000 640,000 640,000 640,000 640,000 640,000Total Building SF 720,126 1,191,009 1,487,479 1,616,656 1,799,832 1,799,832 1,799,832Operating IncomePGI, Residential 3% Annual Increases $ 5,695,578 $ 8,626,287 $ 13,271,939 $ 15,857,374 $ 19,230,650 $ 19,807,569 $ 22,293,594PGI, Retail 3% Annual Increases 1,091,200 1,123,936 1,157,654 1,192,384 1,228,155 1,265,000 1,423,768PGI, Parking 3% Annual Increases 1,843,800 3,629,514 3,738,399 3,850,551 3,966,068 4,085,050 4,597,760Potential Gross Income $ 8,630,578 $ 13,379,737 $ 18,167,993 $ 20,900,310 $ 24,424,873 $ 25,157,619 $ 28,315,122Occupancy, Residential 70.0% 87.6% 88.1% 91.4% 91.7% 95.0% 95.0%Less: Vacancy, Residential 1,708,673 1,071,360 1,582,750 1,370,437 1,590,359 990,378 1,114,680EGI, Residential $ 3,986,905 $ 7,554,927 $ 11,689,189 $ 14,486,937 $ 17,640,291 $ 18,817,191 $ 21,178,914Occupancy, Retail 90.0% 90.0% 90.0% 90.0% 90.0% 90.0% 90.0%Less: Vacancy, Retail 109,120 112,394 115,765 119,238 122,816 126,500 142,377EGI, Retail $ 982,080 $ 1,011,542 $ 1,041,889 $ 1,073,145 $ 1,105,340 $ 1,138,500 $ 1,281,392Utilization, Parking 85.0% 85.0% 85.0% 85.0% 85.0% 85.0% 85.0%Less: Utilization, Parking 276,570 544,427 560,760 577,583 594,910 612,757 689,664EGI, Parking $ 1,567,230 $ 3,085,087 $ 3,177,640 $ 3,272,969 $ 3,371,158 $ 3,472,292 $ 3,908,096Effective Gross Income, Combined $ 6,536,215 $ 11,651,557 $ 15,908,717 $ 18,833,051 $ 22,116,788 $ 23,427,983 $ 26,368,401Operating ExpenseLess: Op.Ex., Residential 12.0% of EGI 478,429 906,591 1,402,703 1,738,432 2,116,835 2,258,063 2,541,470Net Operating Income, Residential $ 3,508,476 $ 6,648,336 $ 10,286,486 $ 12,748,505 $ 15,523,456 $ 16,559,128 $ 18,637,444Less: Op.Ex., Retail 10.0% of EGI 98,208 101,154 104,189 107,315 110,534 113,850 128,139Net Operating Income, Retail $ 883,872 $ 910,388 $ 937,700 $ 965,831 $ 994,806 $ 1,024,650 $ 1,153,252Less: Op.Ex., Parking 8.0% of EGI 125,378 246,807 254,211 261,837 269,693 277,783 312,648Net Operating Income, Parking $ 1,441,852 $ 2,838,280 $ 2,923,428 $ 3,011,131 $ 3,101,465 $ 3,194,509 $ 3,595,448Less: Operating Expense, Combined $ 702,015 $ 1,254,552 $ 1,761,103 $ 2,107,584 $ 2,497,062 $ 2,649,696 $ 2,982,257Net Operating Income, Combined $ 5,834,200 $ 10,397,004 $ 14,147,614 $ 16,725,467 $ 19,619,727 $ 20,778,287 $ 23,386,145Operating Margin 89.3% 89.2% 88.9% 88.8% 88.7% 88.7% 88.7%Less: Debt Service, Residential $ 5,886,442 $ 8,370,799 $ 11,578,215 $ 13,552,722 $ 15,592,119 $ 15,592,119 $ 15,592,119Debt Service Coverage Ratio, Residential 0.60 0.79 0.89 0.94 1.00 1.06 1.20Net Cash Flow From Operations, Combined $ (52,243) $ 2,026,205 $ 2,569,399 $ 3,172,745 $ 4,027,607 $ 5,186,167 $ 7,794,025Net Margin -0.8% 17.4% 16.2% 16.8% 18.2% 22.1% 29.6%Tax Revenue Allocated to GO Bond Service $ 9,083,824 $ 9,083,824 $ 9,083,824 $ 9,083,824 $ 9,083,824 $ 9,083,824 $ 9,083,824Center for Real Estate • BOMA Development Workshop • Summer 200949