Lincoln High School Redevelopment - Portland State University
Lincoln High School Redevelopment - Portland State University
Lincoln High School Redevelopment - Portland State University
- No tags were found...

You also want an ePaper? Increase the reach of your titles
YUMPU automatically turns print PDFs into web optimized ePapers that Google loves.
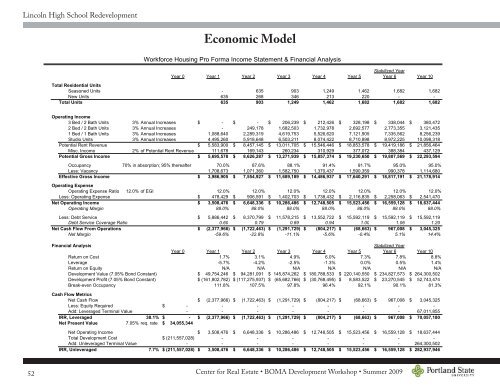
<strong>Lincoln</strong> <strong>High</strong> <strong>School</strong> <strong>Redevelopment</strong>Economic ModelWorkforce Housing Pro Forma Income <strong>State</strong>ment & Financial AnalysisStabilized YearYear 0 Year 1 Year 2 Year 3 Year 4 Year 5 Year 6 Year 10Total Residential UnitsSeasoned Units - 635 903 1,249 1,462 1,682 1,682New Units 635 268 346 213 220 - -Total Units 635 903 1,249 1,462 1,682 1,682 1,682Operating Income3 Bed / 2 Bath Units 3% Annual Increases $ - $ - $ 206,239 $ 212,426 $ 328,198 $ 338,044 $ 380,4722 Bed / 2 Bath Units 3% Annual Increases - 249,178 1,682,503 1,732,978 2,692,577 2,773,355 3,121,4351 Bed / 1 Bath Units 3% Annual Increases 1,088,640 2,289,319 4,619,753 5,526,620 7,121,905 7,335,562 8,256,239Studio Units 3% Annual Increases 4,495,260 5,918,648 6,503,211 8,074,422 8,710,898 8,972,225 10,098,318Potential Rent Revenue $ 5,583,900 $ 8,457,145 $ 13,011,705 $ 15,546,446 $ 18,853,578 $ 19,419,186 $ 21,856,464Misc. Income 2% of Potential Rent Revenue 111,678 169,143 260,234 310,929 377,072 388,384 437,129Potential Gross Income $ 5,695,578 $ 8,626,287 $ 13,271,939 $ 15,857,374 $ 19,230,650 $ 19,807,569 $ 22,293,594Occupancy 70% in absorption; 95% thereafter 70.0% 87.6% 88.1% 91.4% 91.7% 95.0% 95.0%Less: Vacancy 1,708,673 1,071,360 1,582,750 1,370,437 1,590,359 990,378 1,114,680Effective Gross Income $ 3,986,905 $ 7,554,927 $ 11,689,189 $ 14,486,937 $ 17,640,291 $ 18,817,191 $ 21,178,914Operating ExpenseOperating Expense Ratio 12.0% of EGI 12.0% 12.0% 12.0% 12.0% 12.0% 12.0% 12.0%Less: Operating Expense $ 478,429 $ 906,591 $ 1,402,703 $ 1,738,432 $ 2,116,835 $ 2,258,063 $ 2,541,470Net Operating Income $ 3,508,476 $ 6,648,336 $ 10,286,486 $ 12,748,505 $ 15,523,456 $ 16,559,128 $ 18,637,444Operating Margin 88.0% 88.0% 88.0% 88.0% 88.0% 88.0% 88.0%Less: Debt Service $ 5,886,442 $ 8,370,799 $ 11,578,215 $ 13,552,722 $ 15,592,119 $ 15,592,119 $ 15,592,119Debt Service Coverage Ratio 0.60 0.79 0.89 0.94 1.00 1.06 1.20Net Cash Flow From Operations $ (2,377,966) $ (1,722,463) $ (1,291,729) $ (804,217) $ (68,663) $ 967,008 $ 3,045,325Net Margin -59.6% -22.8% -11.1% -5.6% -0.4% 5.1% 14.4%Financial AnalysisStabilized YearYear 0 Year 1 Year 2 Year 3 Year 4 Year 5 Year 6 Year 10Return on Cost 1.7% 3.1% 4.9% 6.0% 7.3% 7.8% 8.8%Leverage -5.7% -4.2% -2.5% -1.3% 0.0% 0.5% 1.4%Return on Equity N/A N/A N/A N/A N/A N/A N/ADevelopment Value (7.05% Bond Constant) $ 49,754,246 $ 94,281,091 $ 145,874,262 $ 180,788,533 $ 220,140,550 $ 234,827,573 $ 264,300,502Development Profit (7.05% Bond Constant) $ (161,802,782) $ (117,275,937) $ (65,682,766) $ (30,768,495) $ 8,583,522 $ 23,270,545 $ 52,743,474Break-even Occupancy 111.8% 107.5% 97.8% 96.4% 92.1% 90.1% 81.3%Cash Flow MetricsNet Cash Flow $ (2,377,966) $ (1,722,463) $ (1,291,729) $ (804,217) $ (68,663) $ 967,008 $ 3,045,325Less: Equity Required $ -- - - - - - -Add: Leveraged Terminal Value - - - - - - - 67,011,855IRR, Leveraged 38.1% $ - $ (2,377,966) $ (1,722,463) $ (1,291,729) $ (804,217) $ (68,663) $ 967,008 $ 70,057,180Net Present Value 7.05% req. rate $ 34,055,344Net Operating Income $ 3,508,476 $ 6,648,336 $ 10,286,486 $ 12,748,505 $ 15,523,456 $ 16,559,128 $ 18,637,444Total Development Cost $ (211,557,028)- - - - - - -Add: Unleveraged Terminal Value - - - - - - - 264,300,502IRR, Unleveraged 7.7% $ (211,557,028) $ 3,508,476 $ 6,648,336 $ 10,286,486 $ 12,748,505 $ 15,523,456 $ 16,559,128 $ 282,937,94652Center for Real Estate • BOMA Development Workshop • Summer 2009