Conference Proceedings 26 - Transportation Research Board
Conference Proceedings 26 - Transportation Research Board
Conference Proceedings 26 - Transportation Research Board
- No tags were found...

Create successful ePaper yourself
Turn your PDF publications into a flip-book with our unique Google optimized e-Paper software.
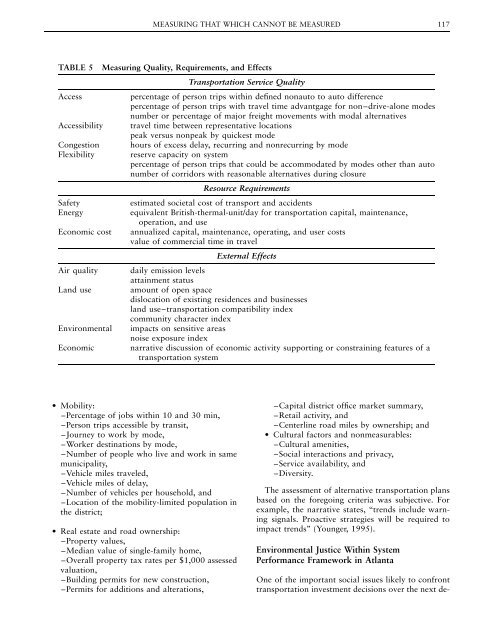
MEASURING THAT WHICH CANNOT BE MEASURED 117TABLE 5AccessAccessibilityCongestionFlexibilitySafetyEnergyEconomic costAir qualityLand useEnvironmentalEconomicMeasuring Quality, Requirements, and Effects<strong>Transportation</strong> Service Qualitypercentage of person trips within defined nonauto to auto differencepercentage of person trips with travel time advantgage for non–drive-alone modesnumber or percentage of major freight movements with modal alternativestravel time between representative locationspeak versus nonpeak by quickest modehours of excess delay, recurring and nonrecurring by modereserve capacity on systempercentage of person trips that could be accommodated by modes other than autonumber of corridors with reasonable alternatives during closureResource Requirementsestimated societal cost of transport and accidentsequivalent British-thermal-unit/day for transportation capital, maintenance,operation, and useannualized capital, maintenance, operating, and user costsvalue of commercial time in travelExternal Effectsdaily emission levelsattainment statusamount of open spacedislocation of existing residences and businessesland use–transportation compatibility indexcommunity character indeximpacts on sensitive areasnoise exposure indexnarrative discussion of economic activity supporting or constraining features of atransportation system• Mobility:–Percentage of jobs within 10 and 30 min,–Person trips accessible by transit,–Journey to work by mode,–Worker destinations by mode,–Number of people who live and work in samemunicipality,–Vehicle miles traveled,–Vehicle miles of delay,–Number of vehicles per household, and–Location of the mobility-limited population inthe district;• Real estate and road ownership:–Property values,–Median value of single-family home,–Overall property tax rates per $1,000 assessedvaluation,–Building permits for new construction,–Permits for additions and alterations,–Capital district office market summary,–Retail activity, and–Centerline road miles by ownership; and• Cultural factors and nonmeasurables:–Cultural amenities,–Social interactions and privacy,–Service availability, and–Diversity.The assessment of alternative transportation plansbased on the foregoing criteria was subjective. Forexample, the narrative states, ‘‘trends include warningsignals. Proactive strategies will be required toimpact trends’’ (Younger, 1995).Environmental Justice Within SystemPerformance Framework in AtlantaOne of the important social issues likely to confronttransportation investment decisions over the next de-