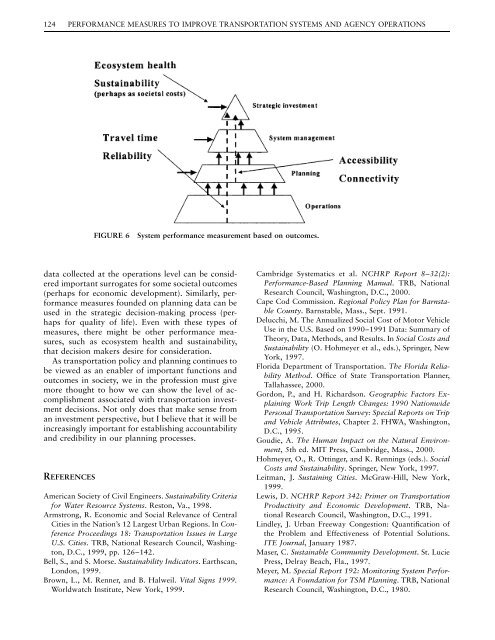
124 PERFORMANCE MEASURES TO IMPROVE TRANSPORTATION SYSTEMS AND AGENCY OPERATIONSFIGURE 6System performance measurement based on outcomes.data collected at the operations level can be consideredimportant surrogates for some societal outcomes(perhaps for economic development). Similarly, performancemeasures founded on planning data can beused in the strategic decision-making process (perhapsfor quality of life). Even with these types ofmeasures, there might be other performance measures,such as ecosystem health and sustainability,that decision makers desire for consideration.As transportation policy and planning continues tobe viewed as an enabler of important functions andoutcomes in society, we in the profession must givemore thought to how we can show the level of accomplishmentassociated with transportation investmentdecisions. Not only does that make sense froman investment perspective, but I believe that it will beincreasingly important for establishing accountabilityand credibility in our planning processes.REFERENCESAmerican Society of Civil Engineers. Sustainability Criteriafor Water Resource Systems. Reston, Va., 1998.Armstrong, R. Economic and Social Relevance of CentralCities in the Nation’s 12 Largest Urban Regions. In <strong>Conference</strong><strong>Proceedings</strong> 18: <strong>Transportation</strong> Issues in LargeU.S. Cities. TRB, National <strong>Research</strong> Council, Washington,D.C., 1999, pp. 1<strong>26</strong>–142.Bell, S., and S. Morse. Sustainability Indicators. Earthscan,London, 1999.Brown, L., M. Renner, and B. Halweil. Vital Signs 1999.Worldwatch Institute, New York, 1999.Cambridge Systematics et al. NCHRP Report 8–32(2):Performance-Based Planning Manual. TRB, National<strong>Research</strong> Council, Washington, D.C., 2000.Cape Cod Commission. Regional Policy Plan for BarnstableCounty. Barnstable, Mass., Sept. 1991.Delucchi, M. The Annualized Social Cost of Motor VehicleUse in the U.S. Based on 1990–1991 Data: Summary ofTheory, Data, Methods, and Results. In Social Costs andSustainability (O. Hohmeyer et al., eds.), Springer, NewYork, 1997.Florida Department of <strong>Transportation</strong>. The Florida ReliabilityMethod. Office of State <strong>Transportation</strong> Planner,Tallahassee, 2000.Gordon, P., and H. Richardson. Geographic Factors ExplainingWork Trip Length Changes: 1990 NationwidePersonal <strong>Transportation</strong> Survey: Special Reports on Tripand Vehicle Attributes, Chapter 2. FHWA, Washington,D.C., 1995.Goudie, A. The Human Impact on the Natural Environment,5th ed. MIT Press, Cambridge, Mass., 2000.Hohmeyer, O., R. Ottinger, and K. Rennings (eds.). SocialCosts and Sustainability. Springer, New York, 1997.Leitman, J. Sustaining Cities. McGraw-Hill, New York,1999.Lewis, D. NCHRP Report 342: Primer on <strong>Transportation</strong>Productivity and Economic Development. TRB, National<strong>Research</strong> Council, Washington, D.C., 1991.Lindley, J. Urban Freeway Congestion: Quantification ofthe Problem and Effectiveness of Potential Solutions.ITE Journal, January 1987.Maser, C. Sustainable Community Development. St. LuciePress, Delray Beach, Fla., 1997.Meyer, M. Special Report 192: Monitoring System Performance:A Foundation for TSM Planning. TRB, National<strong>Research</strong> Council, Washington, D.C., 1980.
MEASURING THAT WHICH CANNOT BE MEASURED 125Meyer, M. Alternative Performance Measures for <strong>Transportation</strong>Planning: Evolution Toward Multimodal Planning.Final Report. Report No. FTA-GA-<strong>26</strong>-7000. FTA, U.S.Department of <strong>Transportation</strong>, December 1995.Meyer, M., and E. Miller. Urban <strong>Transportation</strong> Planning:A Decision-Oriented Approach, 2nd ed. McGraw-Hill,New York, 2000.National <strong>Research</strong> Council. Ecological Indicators for theNation. Washington, D.C., 2000.Newman, P., and J. Kenworthy. Sustainability and Cities:Overcoming Automobile Dependence. Island Press,Washington, D.C., 1999.Pignataro. L. Traffic Engineering: Theory and Practice.Prentice-Hall, Englewood Cliffs, N.J., 1973.Pisarski, A. Commuting in America: Part II. Eno Foundation,Washington, D.C., 1996.Poorman, J. Performance Measures in Metropolitan <strong>Transportation</strong>Planning. In Proc., Performance Measures forCalifornia <strong>Transportation</strong> System Users and Investors.UCLA Extension Public Policy Program, Los Angeles,Calif., 1997.RESI <strong>Research</strong> & Consulting. The Economic Impact ofMaryland Highway Investment. Maryland Departmentof <strong>Transportation</strong>, Baltimore, Nov. 1998.Roseland, M. Toward Sustainable Communities. New SocietyPublishers, Gabriola Island, British Columbia, Canada,1998.Schrank, D., S. Turner, and T. Lomax. Estimates of UrbanRoadway Congestion, 1990. Texas <strong>Transportation</strong> Institute,College Station, March 1993.Schulze, P. (ed.). Measures of Environmental Performanceand Ecosystem Condition. National Academy Press,Washington, D.C., 1999.Stahmer, C. Integrated Environmental and Economic Accounting.In Social Costs and Sustainability (O. Hohmeyeret al., eds.), Springer, New York, 1997.Texas <strong>Transportation</strong> Institute. Urban Mobility Study:Keys to Estimating Mobility in Urban Areas. CollegeStation, Tex., 2000.U.S. Department of <strong>Transportation</strong>. National <strong>Transportation</strong>System Performance Measures. Final Report DOT-T-97-04. Office of the Secretary, Washington, D.C.,April 1996.U.S. General Accounting Office. Traffic Congestion:Trends, Measures, and Effects. Report to the Chairman,Subcommittee on <strong>Transportation</strong> and Related Agencies,Committee on Appropriations, U.S. Senate. Washington,D.C., November 1989.World Bank. World Development Report 1994. OxfordUniversity Press, New York, 1994.Younger, K. Community Quality of Life: Measurement,Trends, and <strong>Transportation</strong> Strategies. Capital District<strong>Transportation</strong> Committee, Albany, N.Y., August1995.
- Page 5 and 6:
National Academy of SciencesNationa
- Page 7 and 8:
Workshop Summary ..................
- Page 9:
General OverviewIntroductionExecuti
- Page 12 and 13:
4 PERFORMANCE MEASURES TO IMPROVE T
- Page 14 and 15:
6 PERFORMANCE MEASURES TO IMPROVE T
- Page 18 and 19:
10 PERFORMANCE MEASURES TO IMPROVE
- Page 20 and 21:
12 PERFORMANCE MEASURES TO IMPROVE
- Page 23:
Linking Performance Measures withDe
- Page 26 and 27:
18 PERFORMANCE MEASURES TO IMPROVE
- Page 28 and 29:
20 PERFORMANCE MEASURES TO IMPROVE
- Page 30 and 31:
22 PERFORMANCE MEASURES TO IMPROVE
- Page 32 and 33:
24 PERFORMANCE MEASURES TO IMPROVE
- Page 34 and 35:
26 PERFORMANCE MEASURES TO IMPROVE
- Page 36 and 37:
28 PERFORMANCE MEASURES TO IMPROVE
- Page 38 and 39:
30 PERFORMANCE MEASURES TO IMPROVE
- Page 40 and 41:
32 PERFORMANCE MEASURES TO IMPROVE
- Page 42 and 43:
Panel DiscussionJohn Poorman, Capit
- Page 44 and 45:
36 PERFORMANCE MEASURES TO IMPROVE
- Page 46 and 47:
38 PERFORMANCE MEASURES TO IMPROVE
- Page 48 and 49:
Workshop SummaryJohn Basilica, Loui
- Page 50 and 51:
42 PERFORMANCE MEASURES TO IMPROVE
- Page 52 and 53:
44 PERFORMANCE MEASURES TO IMPROVE
- Page 55 and 56:
RESOURCE PAPERImplementing Performa
- Page 57 and 58:
IMPLEMENTING PERFORMANCE MEASUREMEN
- Page 59 and 60:
IMPLEMENTING PERFORMANCE MEASUREMEN
- Page 61 and 62:
IMPLEMENTING PERFORMANCE MEASUREMEN
- Page 63 and 64:
IMPLEMENTING PERFORMANCE MEASUREMEN
- Page 65 and 66:
IMPLEMENTING PERFORMANCE MEASUREMEN
- Page 67 and 68:
Panel DiscussionJennifer Finch, Col
- Page 69 and 70:
FIGURE 2Level of measures and align
- Page 71 and 72:
PANEL DISCUSSION: AGENCY IMPLEMENTA
- Page 73 and 74:
PANEL DISCUSSION: AGENCY IMPLEMENTA
- Page 75 and 76:
PANEL DISCUSSION: AGENCY IMPLEMENTA
- Page 77 and 78:
PANEL DISCUSSION: AGENCY IMPLEMENTA
- Page 79 and 80:
WORKSHOP SUMMARY: AGENCY IMPLEMENTA
- Page 81: Selecting Measures, Data Needs, and
- Page 84 and 85: 76 PERFORMANCE MEASURES TO IMPROVE
- Page 86 and 87: 78 PERFORMANCE MEASURES TO IMPROVE
- Page 88 and 89: 80 PERFORMANCE MEASURES TO IMPROVE
- Page 90 and 91: 82 PERFORMANCE MEASURES TO IMPROVE
- Page 92 and 93: 84 PERFORMANCE MEASURES TO IMPROVE
- Page 94 and 95: 86 PERFORMANCE MEASURES TO IMPROVE
- Page 96 and 97: Panel Discussion, Part 1Anita Vande
- Page 98 and 99: 90 PERFORMANCE MEASURES TO IMPROVE
- Page 100 and 101: 92 PERFORMANCE MEASURES TO IMPROVE
- Page 102 and 103: Panel Discussion, Part 2Douglas Zim
- Page 104 and 105: FIGURE 11 Example data
- Page 106 and 107: 98 PERFORMANCE MEASURES TO IMPROVE
- Page 108 and 109: Workshop SummaryBrenda Berg, Trans
- Page 110 and 111: 102 PERFORMANCE MEASURES TO IMPROVE
- Page 113 and 114: RESOURCE PAPERMeasuring That Which
- Page 115 and 116: MEASURING THAT WHICH CANNOT BE MEAS
- Page 117 and 118: TABLE 1Sustainability MeasuresNewma
- Page 119 and 120: MEASURING THAT WHICH CANNOT BE MEAS
- Page 121 and 122: MEASURING THAT WHICH CANNOT BE MEAS
- Page 123 and 124: MEASURING THAT WHICH CANNOT BE MEAS
- Page 125 and 126: MEASURING THAT WHICH CANNOT BE MEAS
- Page 127 and 128: MEASURING THAT WHICH CANNOT BE MEAS
- Page 129 and 130: MEASURING THAT WHICH CANNOT BE MEAS
- Page 131: MEASURING THAT WHICH CANNOT BE MEAS
- Page 135 and 136: PANEL DISCUSSION: CONNECTING SYSTEM
- Page 137 and 138: PANEL DISCUSSION: CONNECTING SYSTEM
- Page 139 and 140: PANEL DISCUSSION: CONNECTING SYSTEM
- Page 141 and 142: PANEL DISCUSSION: CONNECTING SYSTEM
- Page 143 and 144: Workshop SummaryScott Bassett, Oreg
- Page 145: Freight Performance MeasuresCurrent
- Page 148 and 149: 140 PERFORMANCE MEASURES TO IMPROVE
- Page 150 and 151: 142 PERFORMANCE MEASURES TO IMPROVE
- Page 152 and 153: 144 PERFORMANCE MEASURES TO IMPROVE
- Page 154 and 155: 146 PERFORMANCE MEASURES TO IMPROVE
- Page 156 and 157: 148 PERFORMANCE MEASURES TO IMPROVE
- Page 158 and 159: 150 PERFORMANCE MEASURES TO IMPROVE
- Page 160 and 161: 152 PERFORMANCE MEASURES TO IMPROVE
- Page 163 and 164: APPENDIX ASummaries of 20 Poster Se
- Page 165 and 166: SUMMARIES OF 20 POSTER SESSIONS 157
- Page 167 and 168: TABLE 1(continued) WSDOT Outcomes,
- Page 169 and 170: SUMMARIES OF 20 POSTER SESSIONS 161
- Page 171 and 172: SUMMARIES OF 20 POSTER SESSIONS 163
- Page 173 and 174: SUMMARIES OF 20 POSTER SESSIONS 165
- Page 175 and 176: SUMMARIES OF 20 POSTER SESSIONS 167
- Page 177 and 178: FIGURE 2 Sacramento Regional Transi
- Page 179 and 180: FIGURE 3Goal evaluation table: Chit
- Page 181 and 182: SUMMARIES OF 20 POSTER SESSIONS 173
- Page 183 and 184:
SUMMARIES OF 20 POSTER SESSIONS 175
- Page 185 and 186:
SUMMARIES OF 20 POSTER SESSIONS 177
- Page 187 and 188:
TABLE 6Mobility Performance Measure
- Page 189 and 190:
SUMMARIES OF 20 POSTER SESSIONS 181
- Page 191 and 192:
SUMMARIES OF 20 POSTER SESSIONS 183
- Page 193 and 194:
SUMMARIES OF 20 POSTER SESSIONS 185
- Page 195 and 196:
FIGURE 13 MPAH lane-miles by roadwa
- Page 197 and 198:
SUMMARIES OF 20 POSTER SESSIONS 189
- Page 199 and 200:
SUMMARIES OF 20 POSTER SESSIONS 191
- Page 201 and 202:
SUMMARIES OF 20 POSTER SESSIONS 193
- Page 203 and 204:
SUMMARIES OF 20 POSTER SESSIONS 195
- Page 205 and 206:
SUMMARIES OF 20 POSTER SESSIONS 197
- Page 207 and 208:
SUMMARY OF PEER EXCHANGE ON DATA FO
- Page 209 and 210:
SUMMARY OF PEER EXCHANGE ON DATA FO
- Page 211 and 212:
SUMMARY OF PEER EXCHANGE ON DATA FO
- Page 213 and 214:
SUMMARY OF PEER EXCHANGE ON DATA FO
- Page 215 and 216:
SUMMARY OF PEER EXCHANGE ON DATA FO
- Page 217 and 218:
SUMMARY OF PEER EXCHANGE ON DATA FO
- Page 219 and 220:
SUMMARY OF PEER EXCHANGE ON DATA FO
- Page 221 and 222:
SUMMARY OF PEER EXCHANGE ON DATA FO
- Page 223 and 224:
APPENDIX C: RESEARCH STATEMENTS DEV
- Page 225 and 226:
LIST OF PARTICIPANTS 217University,
- Page 227:
LIST OF PARTICIPANTS 219Darwin Stua