Conference Proceedings 26 - Transportation Research Board
Conference Proceedings 26 - Transportation Research Board
Conference Proceedings 26 - Transportation Research Board
- No tags were found...

You also want an ePaper? Increase the reach of your titles
YUMPU automatically turns print PDFs into web optimized ePapers that Google loves.
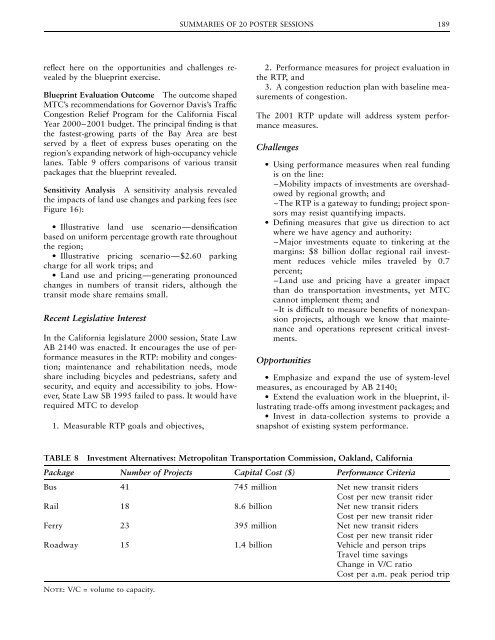
SUMMARIES OF 20 POSTER SESSIONS 189reflect here on the opportunities and challenges revealedby the blueprint exercise.Blueprint Evaluation Outcome The outcome shapedMTC’s recommendations for Governor Davis’s TrafficCongestion Relief Program for the California FiscalYear 2000–2001 budget. The principal finding is thatthe fastest-growing parts of the Bay Area are bestserved by a fleet of express buses operating on theregion’s expanding network of high-occupancy vehiclelanes. Table 9 offers comparisons of various transitpackages that the blueprint revealed.Sensitivity Analysis A sensitivity analysis revealedthe impacts of land use changes and parking fees (seeFigure 16):• Illustrative land use scenario—densificationbased on uniform percentage growth rate throughoutthe region;• Illustrative pricing scenario—$2.60 parkingcharge for all work trips; and• Land use and pricing—generating pronouncedchanges in numbers of transit riders, although thetransit mode share remains small.Recent Legislative InterestIn the California legislature 2000 session, State LawAB 2140 was enacted. It encourages the use of performancemeasures in the RTP: mobility and congestion;maintenance and rehabilitation needs, modeshare including bicycles and pedestrians, safety andsecurity, and equity and accessibility to jobs. However,State Law SB 1995 failed to pass. It would haverequired MTC to develop1. Measurable RTP goals and objectives,2. Performance measures for project evaluation inthe RTP, and3. A congestion reduction plan with baseline measurementsof congestion.The 2001 RTP update will address system performancemeasures.Challenges• Using performance measures when real fundingis on the line:–Mobility impacts of investments are overshadowedby regional growth; and–The RTP is a gateway to funding; project sponsorsmay resist quantifying impacts.• Defining measures that give us direction to actwhere we have agency and authority:–Major investments equate to tinkering at themargins: $8 billion dollar regional rail investmentreduces vehicle miles traveled by 0.7percent;–Land use and pricing have a greater impactthan do transportation investments, yet MTCcannot implement them; and–It is difficult to measure benefits of nonexpansionprojects, although we know that maintenanceand operations represent critical investments.Opportunities• Emphasize and expand the use of system-levelmeasures, as encouraged by AB 2140;• Extend the evaluation work in the blueprint, illustratingtrade-offs among investment packages; and• Invest in data-collection systems to provide asnapshot of existing system performance.TABLE 8Investment Alternatives: Metropolitan <strong>Transportation</strong> Commission, Oakland, CaliforniaPackage Number of Projects Capital Cost ($) Performance CriteriaBus 41 745 million Net new transit ridersCost per new transit riderRail 18 8.6 billion Net new transit ridersCost per new transit riderFerry 23 395 million Net new transit ridersCost per new transit riderRoadway 15 1.4 billion Vehicle and person tripsTravel time savingsChange in V/C ratioCost per a.m. peak period tripNOTE: V/C = volume to capacity.