66 PERFORMANCE MEASURES TO IMPROVE TRANSPORTATION SYSTEMS AND AGENCY OPERATIONStaken. In fact, we now have an automated rail announcementsystem.The roll-out of a couple of major ongoing initiativeswas tailored to respond to some of the concernsthat customers gave us in our customer satisfactionsurvey, particularly the automated fare control system,which was modified after more than 2 years ofimplementation with regard to ease of fare paymentand simplification of the system.In the ongoing annual work on next year’s budget,one of the guidelines for areas of discretionarybudget allocation has been to reflect any potential toinfluence ridership increase, which in turn, reflectssome of the customer satisfaction results that we havebeen looking at. One of the frustrations for some ofus involved has been that the original interdepartmentaltask force that was put together sort of fellapart. We have not been able keep that kind of workinggroup active as a tool to interact more directlyregarding the results of the customer satisfaction survey.Instead, discretionary budgeting has been at themore general level of interpreting budget options interms of how they may influence rider growth.There are probably two key areas in which weneed to pay particular attention to how we handlethe process of implementing and using performancemeasures. The first is getting adequate customer input.Part of this depends on who exactly we feel thecustomer is going to be. The second involves the stepsnecessary to get adequate decision-maker buy-in andcommitment to the use of performance measures inan ongoing process.TRANSFORMING BUREAUCRACIESMark PisanoThank you very much for inviting me and myorganization to participate in an area that Iconsider extremely important. Let me alsocommend Hal Kassoff on his paper. It really is excellent.We can take our thinking even farther thanHal brought us in his paper.Hal observed that government bureaucracies haveexisted since humanity’s first attempt at building organizedsocieties. Historically, we probably had organizedactivity for approximately 5,000 years beforebureaucracies were invented. The Neolithic communitiesand the Paleolithic communities that Mumfordtalked about in The City in History (1961) indicatehow well society operated without bureaucracies.The first society to really introduce bureaucracies wasthe Romans. We know what happened to that civilization.As we study Rome, we know that bureaucracywas at the core of why Rome fell: not becauseit lost military might, but because it could not deliverwhat the people wanted.Then the world continued for another 1,500 yearswithout bureaucracies. They did not come into existenceagain until the latter part of the Greek citystates,when we introduced double-entry bookkeepingand could keep track of trade flows. All of asudden, we created bureaucracies for trade, and theyevolved during the period of the nation-state, and theBaroque period, as Mumford called it, in the 19thCentury.Bureaucracies came into existence at that point intime and are alive, well, and kicking. We are alsogoing to observe their downward slide and their demisebecause we are now in a different world. Weare in a world of information, and everyone has thesame amount of information. It is driving our politicalleaders and those of us who manage bureaucraciesto a point of utter confusion, almost to disarray.As a result, you find that the public will not pay moremoney, people do not vote, and our democratic institutionsare threatened. Performance indicators andperformance standards are the vehicle to help ustranslate, transfer, and use information for bureaucraciesto evolve into what they are supposed to do.The reason why those civilizations that did not havebureaucracies performed so well is that they had humanityat the center of all activity. They respondedto the needs of the human individual.Our task in the whole field of performance indicatorsis to understand what our societies want and
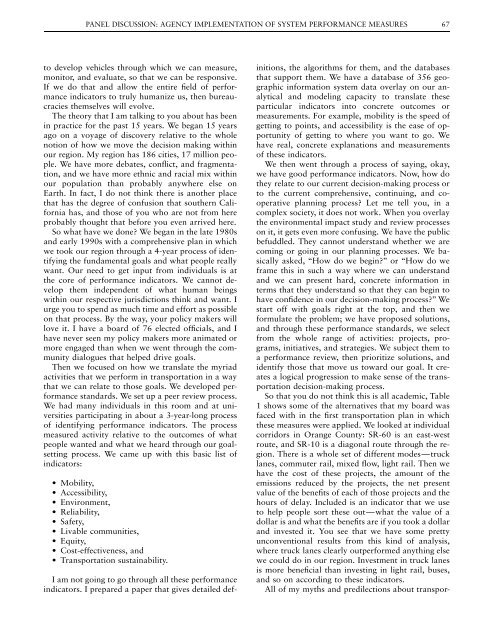
PANEL DISCUSSION: AGENCY IMPLEMENTATION OF SYSTEM PERFORMANCE MEASURES 67to develop vehicles through which we can measure,monitor, and evaluate, so that we can be responsive.If we do that and allow the entire field of performanceindicators to truly humanize us, then bureaucraciesthemselves will evolve.The theory that I am talking to you about has beenin practice for the past 15 years. We began 15 yearsago on a voyage of discovery relative to the wholenotion of how we move the decision making withinour region. My region has 186 cities, 17 million people.We have more debates, conflict, and fragmentation,and we have more ethnic and racial mix withinour population than probably anywhere else onEarth. In fact, I do not think there is another placethat has the degree of confusion that southern Californiahas, and those of you who are not from hereprobably thought that before you even arrived here.So what have we done? We began in the late 1980sand early 1990s with a comprehensive plan in whichwe took our region through a 4-year process of identifyingthe fundamental goals and what people reallywant. Our need to get input from individuals is atthe core of performance indicators. We cannot developthem independent of what human beingswithin our respective jurisdictions think and want. Iurge you to spend as much time and effort as possibleon that process. By the way, your policy makers willlove it. I have a board of 76 elected officials, and Ihave never seen my policy makers more animated ormore engaged than when we went through the communitydialogues that helped drive goals.Then we focused on how we translate the myriadactivities that we perform in transportation in a waythat we can relate to those goals. We developed performancestandards. We set up a peer review process.We had many individuals in this room and at universitiesparticipating in about a 3-year-long processof identifying performance indicators. The processmeasured activity relative to the outcomes of whatpeople wanted and what we heard through our goalsettingprocess. We came up with this basic list ofindicators:• Mobility,• Accessibility,• Environment,• Reliability,• Safety,• Livable communities,• Equity,• Cost-effectiveness, and• <strong>Transportation</strong> sustainability.I am not going to go through all these performanceindicators. I prepared a paper that gives detailed definitions,the algorithms for them, and the databasesthat support them. We have a database of 356 geographicinformation system data overlay on our analyticaland modeling capacity to translate theseparticular indicators into concrete outcomes ormeasurements. For example, mobility is the speed ofgetting to points, and accessibility is the ease of opportunityof getting to where you want to go. Wehave real, concrete explanations and measurementsof these indicators.We then went through a process of saying, okay,we have good performance indicators. Now, how dothey relate to our current decision-making process orto the current comprehensive, continuing, and cooperativeplanning process? Let me tell you, in acomplex society, it does not work. When you overlaythe environmental impact study and review processeson it, it gets even more confusing. We have the publicbefuddled. They cannot understand whether we arecoming or going in our planning processes. We basicallyasked, ‘‘How do we begin?’’ or ‘‘How do weframe this in such a way where we can understandand we can present hard, concrete information interms that they understand so that they can begin tohave confidence in our decision-making process?’’ Westart off with goals right at the top, and then weformulate the problem; we have proposed solutions,and through these performance standards, we selectfrom the whole range of activities: projects, programs,initiatives, and strategies. We subject them toa performance review, then prioritize solutions, andidentify those that move us toward our goal. It createsa logical progression to make sense of the transportationdecision-making process.So that you do not think this is all academic, Table1 shows some of the alternatives that my board wasfaced with in the first transportation plan in whichthese measures were applied. We looked at individualcorridors in Orange County: SR-60 is an east-westroute, and SR-10 is a diagonal route through the region.There is a whole set of different modes—trucklanes, commuter rail, mixed flow, light rail. Then wehave the cost of these projects, the amount of theemissions reduced by the projects, the net presentvalue of the benefits of each of those projects and thehours of delay. Included is an indicator that we useto help people sort these out—what the value of adollar is and what the benefits are if you took a dollarand invested it. You see that we have some prettyunconventional results from this kind of analysis,where truck lanes clearly outperformed anything elsewe could do in our region. Investment in truck lanesis more beneficial than investing in light rail, buses,and so on according to these indicators.All of my myths and predilections about transpor-
- Page 5 and 6:
National Academy of SciencesNationa
- Page 7 and 8:
Workshop Summary ..................
- Page 9:
General OverviewIntroductionExecuti
- Page 12 and 13:
4 PERFORMANCE MEASURES TO IMPROVE T
- Page 14 and 15:
6 PERFORMANCE MEASURES TO IMPROVE T
- Page 18 and 19:
10 PERFORMANCE MEASURES TO IMPROVE
- Page 20 and 21:
12 PERFORMANCE MEASURES TO IMPROVE
- Page 23: Linking Performance Measures withDe
- Page 26 and 27: 18 PERFORMANCE MEASURES TO IMPROVE
- Page 28 and 29: 20 PERFORMANCE MEASURES TO IMPROVE
- Page 30 and 31: 22 PERFORMANCE MEASURES TO IMPROVE
- Page 32 and 33: 24 PERFORMANCE MEASURES TO IMPROVE
- Page 34 and 35: 26 PERFORMANCE MEASURES TO IMPROVE
- Page 36 and 37: 28 PERFORMANCE MEASURES TO IMPROVE
- Page 38 and 39: 30 PERFORMANCE MEASURES TO IMPROVE
- Page 40 and 41: 32 PERFORMANCE MEASURES TO IMPROVE
- Page 42 and 43: Panel DiscussionJohn Poorman, Capit
- Page 44 and 45: 36 PERFORMANCE MEASURES TO IMPROVE
- Page 46 and 47: 38 PERFORMANCE MEASURES TO IMPROVE
- Page 48 and 49: Workshop SummaryJohn Basilica, Loui
- Page 50 and 51: 42 PERFORMANCE MEASURES TO IMPROVE
- Page 52 and 53: 44 PERFORMANCE MEASURES TO IMPROVE
- Page 55 and 56: RESOURCE PAPERImplementing Performa
- Page 57 and 58: IMPLEMENTING PERFORMANCE MEASUREMEN
- Page 59 and 60: IMPLEMENTING PERFORMANCE MEASUREMEN
- Page 61 and 62: IMPLEMENTING PERFORMANCE MEASUREMEN
- Page 63 and 64: IMPLEMENTING PERFORMANCE MEASUREMEN
- Page 65 and 66: IMPLEMENTING PERFORMANCE MEASUREMEN
- Page 67 and 68: Panel DiscussionJennifer Finch, Col
- Page 69 and 70: FIGURE 2Level of measures and align
- Page 71 and 72: PANEL DISCUSSION: AGENCY IMPLEMENTA
- Page 73: PANEL DISCUSSION: AGENCY IMPLEMENTA
- Page 77 and 78: PANEL DISCUSSION: AGENCY IMPLEMENTA
- Page 79 and 80: WORKSHOP SUMMARY: AGENCY IMPLEMENTA
- Page 81: Selecting Measures, Data Needs, and
- Page 84 and 85: 76 PERFORMANCE MEASURES TO IMPROVE
- Page 86 and 87: 78 PERFORMANCE MEASURES TO IMPROVE
- Page 88 and 89: 80 PERFORMANCE MEASURES TO IMPROVE
- Page 90 and 91: 82 PERFORMANCE MEASURES TO IMPROVE
- Page 92 and 93: 84 PERFORMANCE MEASURES TO IMPROVE
- Page 94 and 95: 86 PERFORMANCE MEASURES TO IMPROVE
- Page 96 and 97: Panel Discussion, Part 1Anita Vande
- Page 98 and 99: 90 PERFORMANCE MEASURES TO IMPROVE
- Page 100 and 101: 92 PERFORMANCE MEASURES TO IMPROVE
- Page 102 and 103: Panel Discussion, Part 2Douglas Zim
- Page 104 and 105: FIGURE 11 Example data
- Page 106 and 107: 98 PERFORMANCE MEASURES TO IMPROVE
- Page 108 and 109: Workshop SummaryBrenda Berg, Trans
- Page 110 and 111: 102 PERFORMANCE MEASURES TO IMPROVE
- Page 113 and 114: RESOURCE PAPERMeasuring That Which
- Page 115 and 116: MEASURING THAT WHICH CANNOT BE MEAS
- Page 117 and 118: TABLE 1Sustainability MeasuresNewma
- Page 119 and 120: MEASURING THAT WHICH CANNOT BE MEAS
- Page 121 and 122: MEASURING THAT WHICH CANNOT BE MEAS
- Page 123 and 124: MEASURING THAT WHICH CANNOT BE MEAS
- Page 125 and 126:
MEASURING THAT WHICH CANNOT BE MEAS
- Page 127 and 128:
MEASURING THAT WHICH CANNOT BE MEAS
- Page 129 and 130:
MEASURING THAT WHICH CANNOT BE MEAS
- Page 131 and 132:
MEASURING THAT WHICH CANNOT BE MEAS
- Page 133 and 134:
MEASURING THAT WHICH CANNOT BE MEAS
- Page 135 and 136:
PANEL DISCUSSION: CONNECTING SYSTEM
- Page 137 and 138:
PANEL DISCUSSION: CONNECTING SYSTEM
- Page 139 and 140:
PANEL DISCUSSION: CONNECTING SYSTEM
- Page 141 and 142:
PANEL DISCUSSION: CONNECTING SYSTEM
- Page 143 and 144:
Workshop SummaryScott Bassett, Oreg
- Page 145:
Freight Performance MeasuresCurrent
- Page 148 and 149:
140 PERFORMANCE MEASURES TO IMPROVE
- Page 150 and 151:
142 PERFORMANCE MEASURES TO IMPROVE
- Page 152 and 153:
144 PERFORMANCE MEASURES TO IMPROVE
- Page 154 and 155:
146 PERFORMANCE MEASURES TO IMPROVE
- Page 156 and 157:
148 PERFORMANCE MEASURES TO IMPROVE
- Page 158 and 159:
150 PERFORMANCE MEASURES TO IMPROVE
- Page 160 and 161:
152 PERFORMANCE MEASURES TO IMPROVE
- Page 163 and 164:
APPENDIX ASummaries of 20 Poster Se
- Page 165 and 166:
SUMMARIES OF 20 POSTER SESSIONS 157
- Page 167 and 168:
TABLE 1(continued) WSDOT Outcomes,
- Page 169 and 170:
SUMMARIES OF 20 POSTER SESSIONS 161
- Page 171 and 172:
SUMMARIES OF 20 POSTER SESSIONS 163
- Page 173 and 174:
SUMMARIES OF 20 POSTER SESSIONS 165
- Page 175 and 176:
SUMMARIES OF 20 POSTER SESSIONS 167
- Page 177 and 178:
FIGURE 2 Sacramento Regional Transi
- Page 179 and 180:
FIGURE 3Goal evaluation table: Chit
- Page 181 and 182:
SUMMARIES OF 20 POSTER SESSIONS 173
- Page 183 and 184:
SUMMARIES OF 20 POSTER SESSIONS 175
- Page 185 and 186:
SUMMARIES OF 20 POSTER SESSIONS 177
- Page 187 and 188:
TABLE 6Mobility Performance Measure
- Page 189 and 190:
SUMMARIES OF 20 POSTER SESSIONS 181
- Page 191 and 192:
SUMMARIES OF 20 POSTER SESSIONS 183
- Page 193 and 194:
SUMMARIES OF 20 POSTER SESSIONS 185
- Page 195 and 196:
FIGURE 13 MPAH lane-miles by roadwa
- Page 197 and 198:
SUMMARIES OF 20 POSTER SESSIONS 189
- Page 199 and 200:
SUMMARIES OF 20 POSTER SESSIONS 191
- Page 201 and 202:
SUMMARIES OF 20 POSTER SESSIONS 193
- Page 203 and 204:
SUMMARIES OF 20 POSTER SESSIONS 195
- Page 205 and 206:
SUMMARIES OF 20 POSTER SESSIONS 197
- Page 207 and 208:
SUMMARY OF PEER EXCHANGE ON DATA FO
- Page 209 and 210:
SUMMARY OF PEER EXCHANGE ON DATA FO
- Page 211 and 212:
SUMMARY OF PEER EXCHANGE ON DATA FO
- Page 213 and 214:
SUMMARY OF PEER EXCHANGE ON DATA FO
- Page 215 and 216:
SUMMARY OF PEER EXCHANGE ON DATA FO
- Page 217 and 218:
SUMMARY OF PEER EXCHANGE ON DATA FO
- Page 219 and 220:
SUMMARY OF PEER EXCHANGE ON DATA FO
- Page 221 and 222:
SUMMARY OF PEER EXCHANGE ON DATA FO
- Page 223 and 224:
APPENDIX C: RESEARCH STATEMENTS DEV
- Page 225 and 226:
LIST OF PARTICIPANTS 217University,
- Page 227:
LIST OF PARTICIPANTS 219Darwin Stua


