Conference Proceedings 26 - Transportation Research Board
Conference Proceedings 26 - Transportation Research Board
Conference Proceedings 26 - Transportation Research Board
- No tags were found...
You also want an ePaper? Increase the reach of your titles
YUMPU automatically turns print PDFs into web optimized ePapers that Google loves.
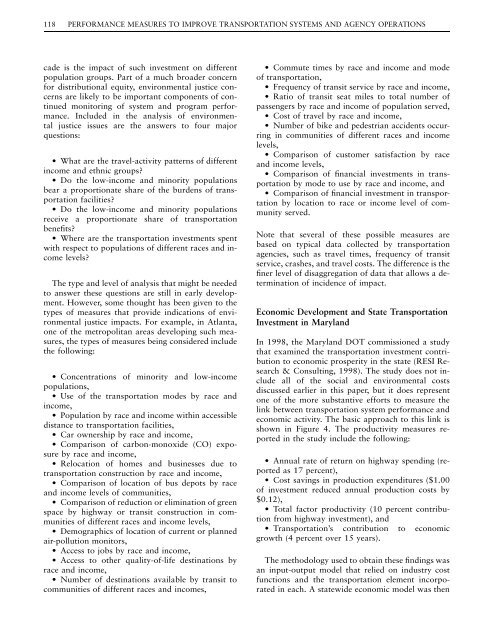
118 PERFORMANCE MEASURES TO IMPROVE TRANSPORTATION SYSTEMS AND AGENCY OPERATIONScade is the impact of such investment on differentpopulation groups. Part of a much broader concernfor distributional equity, environmental justice concernsare likely to be important components of continuedmonitoring of system and program performance.Included in the analysis of environmentaljustice issues are the answers to four majorquestions:• What are the travel-activity patterns of differentincome and ethnic groups?• Do the low-income and minority populationsbear a proportionate share of the burdens of transportationfacilities?• Do the low-income and minority populationsreceive a proportionate share of transportationbenefits?• Where are the transportation investments spentwith respect to populations of different races and incomelevels?The type and level of analysis that might be neededto answer these questions are still in early development.However, some thought has been given to thetypes of measures that provide indications of environmentaljustice impacts. For example, in Atlanta,one of the metropolitan areas developing such measures,the types of measures being considered includethe following:• Concentrations of minority and low-incomepopulations,• Use of the transportation modes by race andincome,• Population by race and income within accessibledistance to transportation facilities,• Car ownership by race and income,• Comparison of carbon-monoxide (CO) exposureby race and income,• Relocation of homes and businesses due totransportation construction by race and income,• Comparison of location of bus depots by raceand income levels of communities,• Comparison of reduction or elimination of greenspace by highway or transit construction in communitiesof different races and income levels,• Demographics of location of current or plannedair-pollution monitors,• Access to jobs by race and income,• Access to other quality-of-life destinations byrace and income,• Number of destinations available by transit tocommunities of different races and incomes,• Commute times by race and income and modeof transportation,• Frequency of transit service by race and income,• Ratio of transit seat miles to total number ofpassengers by race and income of population served,• Cost of travel by race and income,• Number of bike and pedestrian accidents occurringin communities of different races and incomelevels,• Comparison of customer satisfaction by raceand income levels,• Comparison of financial investments in transportationby mode to use by race and income, and• Comparison of financial investment in transportationby location to race or income level of communityserved.Note that several of these possible measures arebased on typical data collected by transportationagencies, such as travel times, frequency of transitservice, crashes, and travel costs. The difference is thefiner level of disaggregation of data that allows a determinationof incidence of impact.Economic Development and State <strong>Transportation</strong>Investment in MarylandIn 1998, the Maryland DOT commissioned a studythat examined the transportation investment contributionto economic prosperity in the state (RESI <strong>Research</strong>& Consulting, 1998). The study does not includeall of the social and environmental costsdiscussed earlier in this paper, but it does representone of the more substantive efforts to measure thelink between transportation system performance andeconomic activity. The basic approach to this link isshown in Figure 4. The productivity measures reportedin the study include the following:• Annual rate of return on highway spending (reportedas 17 percent),• Cost savings in production expenditures ($1.00of investment reduced annual production costs by$0.12),• Total factor productivity (10 percent contributionfrom highway investment), and• <strong>Transportation</strong>’s contribution to economicgrowth (4 percent over 15 years).The methodology used to obtain these findings wasan input-output model that relied on industry costfunctions and the transportation element incorporatedin each. A statewide economic model was then


