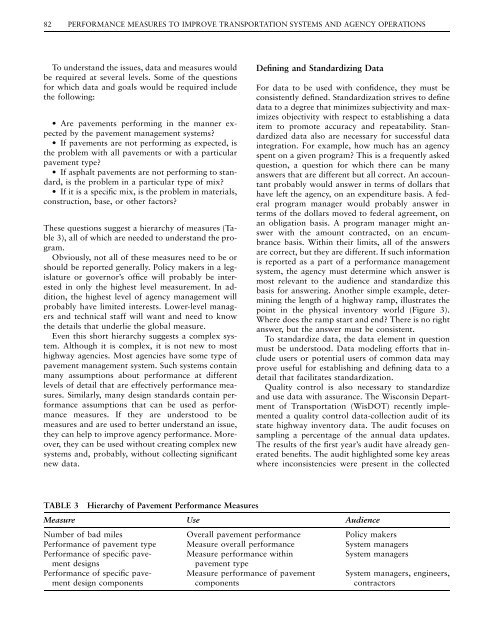
82 PERFORMANCE MEASURES TO IMPROVE TRANSPORTATION SYSTEMS AND AGENCY OPERATIONSTo understand the issues, data and measures wouldbe required at several levels. Some of the questionsfor which data and goals would be required includethe following:• Are pavements performing in the manner expectedby the pavement management systems?• If pavements are not performing as expected, isthe problem with all pavements or with a particularpavement type?• If asphalt pavements are not performing to standard,is the problem in a particular type of mix?• If it is a specific mix, is the problem in materials,construction, base, or other factors?These questions suggest a hierarchy of measures (Table3), all of which are needed to understand the program.Obviously, not all of these measures need to be orshould be reported generally. Policy makers in a legislatureor governor’s office will probably be interestedin only the highest level measurement. In addition,the highest level of agency management willprobably have limited interests. Lower-level managersand technical staff will want and need to knowthe details that underlie the global measure.Even this short hierarchy suggests a complex system.Although it is complex, it is not new to mosthighway agencies. Most agencies have some type ofpavement management system. Such systems containmany assumptions about performance at differentlevels of detail that are effectively performance measures.Similarly, many design standards contain performanceassumptions that can be used as performancemeasures. If they are understood to bemeasures and are used to better understand an issue,they can help to improve agency performance. Moreover,they can be used without creating complex newsystems and, probably, without collecting significantnew data.Defining and Standardizing DataFor data to be used with confidence, they must beconsistently defined. Standardization strives to definedata to a degree that minimizes subjectivity and maximizesobjectivity with respect to establishing a dataitem to promote accuracy and repeatability. Standardizeddata also are necessary for successful dataintegration. For example, how much has an agencyspent on a given program? This is a frequently askedquestion, a question for which there can be manyanswers that are different but all correct. An accountantprobably would answer in terms of dollars thathave left the agency, on an expenditure basis. A federalprogram manager would probably answer interms of the dollars moved to federal agreement, onan obligation basis. A program manager might answerwith the amount contracted, on an encumbrancebasis. Within their limits, all of the answersare correct, but they are different. If such informationis reported as a part of a performance managementsystem, the agency must determine which answer ismost relevant to the audience and standardize thisbasis for answering. Another simple example, determiningthe length of a highway ramp, illustrates thepoint in the physical inventory world (Figure 3).Where does the ramp start and end? There is no rightanswer, but the answer must be consistent.To standardize data, the data element in questionmust be understood. Data modeling efforts that includeusers or potential users of common data mayprove useful for establishing and defining data to adetail that facilitates standardization.Quality control is also necessary to standardizeand use data with assurance. The Wisconsin Departmentof <strong>Transportation</strong> (WisDOT) recently implementeda quality control data-collection audit of itsstate highway inventory data. The audit focuses onsampling a percentage of the annual data updates.The results of the first year’s audit have already generatedbenefits. The audit highlighted some key areaswhere inconsistencies were present in the collectedTABLE 3Hierarchy of Pavement Performance MeasuresMeasure Use AudienceNumber of bad miles Overall pavement performance Policy makersPerformance of pavement type Measure overall performance System managersPerformance of specific pavementMeasure performance withinSystem managersdesignspavement typePerformance of specific pavementdesign componentsMeasure performance of pavementcomponentsSystem managers, engineers,contractors
TRANSPORTATION DATA AND PERFORMANCE MEASUREMENT 83widths for doing capacity analysis. Therefore, collectingbasic inventory data for new constructionmight be the highest priority. Collecting new constructiondata could be more important than collectingpavement roughness data, which changes slowlyenough that delaying collection for several monthswould not affect system-level analysis.FIGURE 3Location of ramp along mainline.data. A follow-up to the audit will occur soon withall data collectors to review what was learned and toincorporate the findings into a revised data-collectionmanual.Data LifeData collection is usually expensive. Therefore, it isimportant to understand the useful life of data so thatit can be leveraged as much as possible before anupdate is necessary. To determine the data’s usefullife, the data’s accuracy necessary to address businessrequirements must be determined.The useful life of data can be derived from the responsibleuse of the data. For example, highly detailedpavement condition ratings can be used to predictpavement condition for 5 to 6 years from thedate of inspection. This means that one can confidently,or responsibly, generate a 5- to 6-year improvementprogram based on the data. It is temptingto generate long-term [or out-year (6 years)] improvementprograms because pavement deteriorationcurves can forecast conditions for up to 40 years.Although this forecast is possible mathematically, aresponsible user will seek to understand the variablesaffecting data quality over time; this understandingshould be used as the basis for determining the frequencywith which to update and use data.In contrast, some data have a long, useful life.Pavement width, shoulder width, pavement type, intersectionlocation, and median location and type remainthe same from the time they are built until reconstruction,so it is not necessary to plan a cyclicalcollection of such data. It also may not be necessaryto collect the data in the field but to use its built plansor a photolog in the office to collect the data.It is also wise to prioritize the importance of eachdata item. Although pavement and shoulder widthremains static between construction times, it is importantto have the current pavement and shoulderAutomatic or Manual CollectionAutomation of data collection usually enables datato be collected quickly and efficiently. If the automationequipment is cost-effective and the data canbe processed efficiently, then automation is likely tobe a viable alternative to manual data collection.However, automated collection methods are not alwaysthe best way to collect data. Automation canwork well if a large volume of data is collected daily(e.g., automatic traffic count and classification stations)or thousands of miles of road per year arerated (e.g., collecting pavement roughness). However,for data that is stagnant, such as political boundaries,manual collection may be more economical.Automated data collection usually implies speedand efficiency, but the real value of automation isrealized when speed is coupled with increased accuracy,precision, and repeatability of the data. Thedrawbacks of automated data collection typically relateto significant up-front capital costs and ongoingmaintenance costs for equipment.Defining the benefits of accuracy and precision fordata items is a good starting point for the evaluationof automation benefits. Some data items do not lendthemselves to accurate, precise, and efficient manualmeasurement; for example, it is almost impossible toobtain pavement roughness data and standardized,repeatable manual determinations of pavementroughness. Thus, automation is clearly a superior alternative.But for many data items, automation is notso easily distinguished as a superior data-collectionmethod; in fact, automation might not be the bestapproach. The cost of equipment must be weighedagainst the benefits of enhanced accuracy, speed, andrepeatability when an automated data-collection solutionis considered (Figures 4 and 5).Data may be collected through a combination ofboth manual and automated processes. Handhelddevices that allow collectors to input and store dataand then easily upload into a larger inventory systemcan contribute significantly to consistency andrepeatability (Figure 6). Laptops and data boardsprovide much of the same functionality in otherapplications.
- Page 5 and 6:
National Academy of SciencesNationa
- Page 7 and 8:
Workshop Summary ..................
- Page 9:
General OverviewIntroductionExecuti
- Page 12 and 13:
4 PERFORMANCE MEASURES TO IMPROVE T
- Page 14 and 15:
6 PERFORMANCE MEASURES TO IMPROVE T
- Page 18 and 19:
10 PERFORMANCE MEASURES TO IMPROVE
- Page 20 and 21:
12 PERFORMANCE MEASURES TO IMPROVE
- Page 23:
Linking Performance Measures withDe
- Page 26 and 27:
18 PERFORMANCE MEASURES TO IMPROVE
- Page 28 and 29:
20 PERFORMANCE MEASURES TO IMPROVE
- Page 30 and 31:
22 PERFORMANCE MEASURES TO IMPROVE
- Page 32 and 33:
24 PERFORMANCE MEASURES TO IMPROVE
- Page 34 and 35:
26 PERFORMANCE MEASURES TO IMPROVE
- Page 36 and 37:
28 PERFORMANCE MEASURES TO IMPROVE
- Page 38 and 39:
30 PERFORMANCE MEASURES TO IMPROVE
- Page 40 and 41: 32 PERFORMANCE MEASURES TO IMPROVE
- Page 42 and 43: Panel DiscussionJohn Poorman, Capit
- Page 44 and 45: 36 PERFORMANCE MEASURES TO IMPROVE
- Page 46 and 47: 38 PERFORMANCE MEASURES TO IMPROVE
- Page 48 and 49: Workshop SummaryJohn Basilica, Loui
- Page 50 and 51: 42 PERFORMANCE MEASURES TO IMPROVE
- Page 52 and 53: 44 PERFORMANCE MEASURES TO IMPROVE
- Page 55 and 56: RESOURCE PAPERImplementing Performa
- Page 57 and 58: IMPLEMENTING PERFORMANCE MEASUREMEN
- Page 59 and 60: IMPLEMENTING PERFORMANCE MEASUREMEN
- Page 61 and 62: IMPLEMENTING PERFORMANCE MEASUREMEN
- Page 63 and 64: IMPLEMENTING PERFORMANCE MEASUREMEN
- Page 65 and 66: IMPLEMENTING PERFORMANCE MEASUREMEN
- Page 67 and 68: Panel DiscussionJennifer Finch, Col
- Page 69 and 70: FIGURE 2Level of measures and align
- Page 71 and 72: PANEL DISCUSSION: AGENCY IMPLEMENTA
- Page 73 and 74: PANEL DISCUSSION: AGENCY IMPLEMENTA
- Page 75 and 76: PANEL DISCUSSION: AGENCY IMPLEMENTA
- Page 77 and 78: PANEL DISCUSSION: AGENCY IMPLEMENTA
- Page 79 and 80: WORKSHOP SUMMARY: AGENCY IMPLEMENTA
- Page 81: Selecting Measures, Data Needs, and
- Page 84 and 85: 76 PERFORMANCE MEASURES TO IMPROVE
- Page 86 and 87: 78 PERFORMANCE MEASURES TO IMPROVE
- Page 88 and 89: 80 PERFORMANCE MEASURES TO IMPROVE
- Page 92 and 93: 84 PERFORMANCE MEASURES TO IMPROVE
- Page 94 and 95: 86 PERFORMANCE MEASURES TO IMPROVE
- Page 96 and 97: Panel Discussion, Part 1Anita Vande
- Page 98 and 99: 90 PERFORMANCE MEASURES TO IMPROVE
- Page 100 and 101: 92 PERFORMANCE MEASURES TO IMPROVE
- Page 102 and 103: Panel Discussion, Part 2Douglas Zim
- Page 104 and 105: FIGURE 11 Example data
- Page 106 and 107: 98 PERFORMANCE MEASURES TO IMPROVE
- Page 108 and 109: Workshop SummaryBrenda Berg, Trans
- Page 110 and 111: 102 PERFORMANCE MEASURES TO IMPROVE
- Page 113 and 114: RESOURCE PAPERMeasuring That Which
- Page 115 and 116: MEASURING THAT WHICH CANNOT BE MEAS
- Page 117 and 118: TABLE 1Sustainability MeasuresNewma
- Page 119 and 120: MEASURING THAT WHICH CANNOT BE MEAS
- Page 121 and 122: MEASURING THAT WHICH CANNOT BE MEAS
- Page 123 and 124: MEASURING THAT WHICH CANNOT BE MEAS
- Page 125 and 126: MEASURING THAT WHICH CANNOT BE MEAS
- Page 127 and 128: MEASURING THAT WHICH CANNOT BE MEAS
- Page 129 and 130: MEASURING THAT WHICH CANNOT BE MEAS
- Page 131 and 132: MEASURING THAT WHICH CANNOT BE MEAS
- Page 133 and 134: MEASURING THAT WHICH CANNOT BE MEAS
- Page 135 and 136: PANEL DISCUSSION: CONNECTING SYSTEM
- Page 137 and 138: PANEL DISCUSSION: CONNECTING SYSTEM
- Page 139 and 140: PANEL DISCUSSION: CONNECTING SYSTEM
- Page 141 and 142:
PANEL DISCUSSION: CONNECTING SYSTEM
- Page 143 and 144:
Workshop SummaryScott Bassett, Oreg
- Page 145:
Freight Performance MeasuresCurrent
- Page 148 and 149:
140 PERFORMANCE MEASURES TO IMPROVE
- Page 150 and 151:
142 PERFORMANCE MEASURES TO IMPROVE
- Page 152 and 153:
144 PERFORMANCE MEASURES TO IMPROVE
- Page 154 and 155:
146 PERFORMANCE MEASURES TO IMPROVE
- Page 156 and 157:
148 PERFORMANCE MEASURES TO IMPROVE
- Page 158 and 159:
150 PERFORMANCE MEASURES TO IMPROVE
- Page 160 and 161:
152 PERFORMANCE MEASURES TO IMPROVE
- Page 163 and 164:
APPENDIX ASummaries of 20 Poster Se
- Page 165 and 166:
SUMMARIES OF 20 POSTER SESSIONS 157
- Page 167 and 168:
TABLE 1(continued) WSDOT Outcomes,
- Page 169 and 170:
SUMMARIES OF 20 POSTER SESSIONS 161
- Page 171 and 172:
SUMMARIES OF 20 POSTER SESSIONS 163
- Page 173 and 174:
SUMMARIES OF 20 POSTER SESSIONS 165
- Page 175 and 176:
SUMMARIES OF 20 POSTER SESSIONS 167
- Page 177 and 178:
FIGURE 2 Sacramento Regional Transi
- Page 179 and 180:
FIGURE 3Goal evaluation table: Chit
- Page 181 and 182:
SUMMARIES OF 20 POSTER SESSIONS 173
- Page 183 and 184:
SUMMARIES OF 20 POSTER SESSIONS 175
- Page 185 and 186:
SUMMARIES OF 20 POSTER SESSIONS 177
- Page 187 and 188:
TABLE 6Mobility Performance Measure
- Page 189 and 190:
SUMMARIES OF 20 POSTER SESSIONS 181
- Page 191 and 192:
SUMMARIES OF 20 POSTER SESSIONS 183
- Page 193 and 194:
SUMMARIES OF 20 POSTER SESSIONS 185
- Page 195 and 196:
FIGURE 13 MPAH lane-miles by roadwa
- Page 197 and 198:
SUMMARIES OF 20 POSTER SESSIONS 189
- Page 199 and 200:
SUMMARIES OF 20 POSTER SESSIONS 191
- Page 201 and 202:
SUMMARIES OF 20 POSTER SESSIONS 193
- Page 203 and 204:
SUMMARIES OF 20 POSTER SESSIONS 195
- Page 205 and 206:
SUMMARIES OF 20 POSTER SESSIONS 197
- Page 207 and 208:
SUMMARY OF PEER EXCHANGE ON DATA FO
- Page 209 and 210:
SUMMARY OF PEER EXCHANGE ON DATA FO
- Page 211 and 212:
SUMMARY OF PEER EXCHANGE ON DATA FO
- Page 213 and 214:
SUMMARY OF PEER EXCHANGE ON DATA FO
- Page 215 and 216:
SUMMARY OF PEER EXCHANGE ON DATA FO
- Page 217 and 218:
SUMMARY OF PEER EXCHANGE ON DATA FO
- Page 219 and 220:
SUMMARY OF PEER EXCHANGE ON DATA FO
- Page 221 and 222:
SUMMARY OF PEER EXCHANGE ON DATA FO
- Page 223 and 224:
APPENDIX C: RESEARCH STATEMENTS DEV
- Page 225 and 226:
LIST OF PARTICIPANTS 217University,
- Page 227:
LIST OF PARTICIPANTS 219Darwin Stua