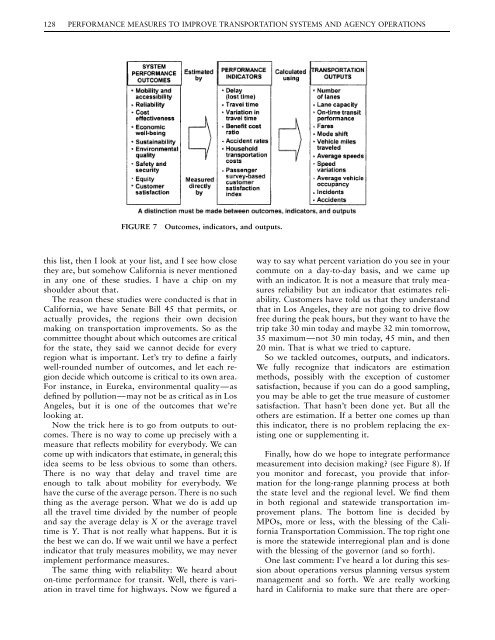
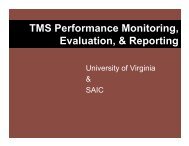
128 PERFORMANCE MEASURES TO IMPROVE TRANSPORTATION SYSTEMS AND AGENCY OPERATIONSFIGURE 7Outcomes, indicators, and outputs.this list, then I look at your list, and I see how closethey are, but somehow California is never mentionedin any one of these studies. I have a chip on myshoulder about that.The reason these studies were conducted is that inCalifornia, we have Senate Bill 45 that permits, oractually provides, the regions their own decisionmaking on transportation improvements. So as thecommittee thought about which outcomes are criticalfor the state, they said we cannot decide for everyregion what is important. Let’s try to define a fairlywell-rounded number of outcomes, and let each regiondecide which outcome is critical to its own area.For instance, in Eureka, environmental quality—asdefined by pollution—may not be as critical as in LosAngeles, but it is one of the outcomes that we’relooking at.Now the trick here is to go from outputs to outcomes.There is no way to come up precisely with ameasure that reflects mobility for everybody. We cancome up with indicators that estimate, in general; thisidea seems to be less obvious to some than others.There is no way that delay and travel time areenough to talk about mobility for everybody. Wehave the curse of the average person. There is no suchthing as the average person. What we do is add upall the travel time divided by the number of peopleand say the average delay is X or the average traveltime is Y. That is not really what happens. But it isthe best we can do. If we wait until we have a perfectindicator that truly measures mobility, we may neverimplement performance measures.The same thing with reliability: We heard abouton-time performance for transit. Well, there is variationin travel time for highways. Now we figured away to say what percent variation do you see in yourcommute on a day-to-day basis, and we came upwith an indicator. It is not a measure that truly measuresreliability but an indicator that estimates reliability.Customers have told us that they understandthat in Los Angeles, they are not going to drive flowfree during the peak hours, but they want to have thetrip take 30 min today and maybe 32 min tomorrow,35 maximum—not 30 min today, 45 min, and then20 min. That is what we tried to capture.So we tackled outcomes, outputs, and indicators.We fully recognize that indicators are estimationmethods, possibly with the exception of customersatisfaction, because if you can do a good sampling,you may be able to get the true measure of customersatisfaction. That hasn’t been done yet. But all theothers are estimation. If a better one comes up thanthis indicator, there is no problem replacing the existingone or supplementing it.Finally, how do we hope to integrate performancemeasurement into decision making? (see Figure 8). Ifyou monitor and forecast, you provide that informationfor the long-range planning process at boththe state level and the regional level. We find themin both regional and statewide transportation improvementplans. The bottom line is decided byMPOs, more or less, with the blessing of the California<strong>Transportation</strong> Commission. The top right oneis more the statewide interregional plan and is donewith the blessing of the governor (and so forth).One last comment: I’ve heard a lot during this sessionabout operations versus planning versus systemmanagement and so forth. We are really workinghard in California to make sure that there are oper-
PANEL DISCUSSION: CONNECTING SYSTEM PERFORMANCE MEASURES TO BROADER GOALS 129I do commend you: the paper that you wrote doesgive a good broad background, you might say anacademic, intellectual background, in terms of thesubject area that we’re talking about. Working in animplementing agency, I would like to focus my remarkson the kinds of things that we’re really facingwhere the rubber meets the road, so to speak, in theimplementing agency.Context for <strong>Transportation</strong> in MarylandFIGURE 8 Integrating performance measurement intoexisting planning and programming processes.ational and planning strategies that deal with congestion.If these two don’t work hand in hand, youdon’t get the most for your money. So we are reallytrying to marry the two disciplines, make them usethe same measure, the same indicators. They canhave additional ones that they don’t share, but to thegreatest extent possible, the two should overlap.SOCIETY’S VALUES CHANGE—AND WHAT ISEXPECTED OF USNeil PedersenGood afternoon, everyone. My name is NeilPedersen, and I give you greetings from thestate of Maryland. It is sometimes known asthe ‘‘smart growth state.’’ I’m going to be talking alittle bit about the upper-left-hand arrows in MikeMeyer’s diagram: what we’re hearing about in thestate of Maryland in terms of input and expectationsin the transportation system and transportation decisionmakers that address broader societal goals.I first met Mike Meyer <strong>26</strong> years ago when we werefellow graduate students at Northwestern University.I want to give you the context in Maryland so youcan understand some of the questions we are beingasked. Maryland is dominated by two major metropolitanareas, Baltimore and Washington. Eighty percentof the population of the state is in those twoareas. We’ve been experiencing decay of the urbancore in both of those areas as well as in our othercities, with rapid sprawl development occurring inthe outer suburbs.The Chesapeake Bay is the environmental jewel ofthe state of Maryland. Perhaps more so than in a lotof other states, there is a fundamental environmentalethic in our population associated with the ChesapeakeBay. Governor Parris Glendening is veryproud, rightfully, of the Smart Growth program. Ithas really been the centerpiece of his legislative initiativeduring his first term as president of the NationalGovernors Association (NGA). He is goingaround touting that, and I’ll be getting into whatsome of the implications are, particularly from hisperspective with smart growth issues. He also hassomething called Managing for Results. This really isbringing the type of business planning into stateagencies that includes vision, goals, and objectives.However, it is really performance measure oriented.Now, how does our governor view transportation?He doesn’t really view transportation primarily as anend in itself but as a tool for achieving other goals,primarily economic development, urban revitalization,and environmental protection and enhancement.This affects, to a great extent, the kinds ofquestions that we’re being asked to answer and ultimatelyhave to develop performance measures for.The context of what I’m talking about is driven bysome recent legislative initiatives that we have facedin the state of Maryland. Last year, legislation wasintroduced that proposed that the Maryland DOT beheld accountable to prevent any increase in vehiclemiles of travel in the state. If we were not successfulin meeting that goal, then funding would be withheldfrom any future expansion of highways. Through thelegislative negotiation process, we were able tochange that into legislation that required us, by law,
- Page 5 and 6:
National Academy of SciencesNationa
- Page 7 and 8:
Workshop Summary ..................
- Page 9:
General OverviewIntroductionExecuti
- Page 12 and 13:
4 PERFORMANCE MEASURES TO IMPROVE T
- Page 14 and 15:
6 PERFORMANCE MEASURES TO IMPROVE T
- Page 18 and 19:
10 PERFORMANCE MEASURES TO IMPROVE
- Page 20 and 21:
12 PERFORMANCE MEASURES TO IMPROVE
- Page 23:
Linking Performance Measures withDe
- Page 26 and 27:
18 PERFORMANCE MEASURES TO IMPROVE
- Page 28 and 29:
20 PERFORMANCE MEASURES TO IMPROVE
- Page 30 and 31:
22 PERFORMANCE MEASURES TO IMPROVE
- Page 32 and 33:
24 PERFORMANCE MEASURES TO IMPROVE
- Page 34 and 35:
26 PERFORMANCE MEASURES TO IMPROVE
- Page 36 and 37:
28 PERFORMANCE MEASURES TO IMPROVE
- Page 38 and 39:
30 PERFORMANCE MEASURES TO IMPROVE
- Page 40 and 41:
32 PERFORMANCE MEASURES TO IMPROVE
- Page 42 and 43:
Panel DiscussionJohn Poorman, Capit
- Page 44 and 45:
36 PERFORMANCE MEASURES TO IMPROVE
- Page 46 and 47:
38 PERFORMANCE MEASURES TO IMPROVE
- Page 48 and 49:
Workshop SummaryJohn Basilica, Loui
- Page 50 and 51:
42 PERFORMANCE MEASURES TO IMPROVE
- Page 52 and 53:
44 PERFORMANCE MEASURES TO IMPROVE
- Page 55 and 56:
RESOURCE PAPERImplementing Performa
- Page 57 and 58:
IMPLEMENTING PERFORMANCE MEASUREMEN
- Page 59 and 60:
IMPLEMENTING PERFORMANCE MEASUREMEN
- Page 61 and 62:
IMPLEMENTING PERFORMANCE MEASUREMEN
- Page 63 and 64:
IMPLEMENTING PERFORMANCE MEASUREMEN
- Page 65 and 66:
IMPLEMENTING PERFORMANCE MEASUREMEN
- Page 67 and 68:
Panel DiscussionJennifer Finch, Col
- Page 69 and 70:
FIGURE 2Level of measures and align
- Page 71 and 72:
PANEL DISCUSSION: AGENCY IMPLEMENTA
- Page 73 and 74:
PANEL DISCUSSION: AGENCY IMPLEMENTA
- Page 75 and 76:
PANEL DISCUSSION: AGENCY IMPLEMENTA
- Page 77 and 78:
PANEL DISCUSSION: AGENCY IMPLEMENTA
- Page 79 and 80:
WORKSHOP SUMMARY: AGENCY IMPLEMENTA
- Page 81:
Selecting Measures, Data Needs, and
- Page 84 and 85:
76 PERFORMANCE MEASURES TO IMPROVE
- Page 86 and 87: 78 PERFORMANCE MEASURES TO IMPROVE
- Page 88 and 89: 80 PERFORMANCE MEASURES TO IMPROVE
- Page 90 and 91: 82 PERFORMANCE MEASURES TO IMPROVE
- Page 92 and 93: 84 PERFORMANCE MEASURES TO IMPROVE
- Page 94 and 95: 86 PERFORMANCE MEASURES TO IMPROVE
- Page 96 and 97: Panel Discussion, Part 1Anita Vande
- Page 98 and 99: 90 PERFORMANCE MEASURES TO IMPROVE
- Page 100 and 101: 92 PERFORMANCE MEASURES TO IMPROVE
- Page 102 and 103: Panel Discussion, Part 2Douglas Zim
- Page 104 and 105: FIGURE 11 Example data
- Page 106 and 107: 98 PERFORMANCE MEASURES TO IMPROVE
- Page 108 and 109: Workshop SummaryBrenda Berg, Trans
- Page 110 and 111: 102 PERFORMANCE MEASURES TO IMPROVE
- Page 113 and 114: RESOURCE PAPERMeasuring That Which
- Page 115 and 116: MEASURING THAT WHICH CANNOT BE MEAS
- Page 117 and 118: TABLE 1Sustainability MeasuresNewma
- Page 119 and 120: MEASURING THAT WHICH CANNOT BE MEAS
- Page 121 and 122: MEASURING THAT WHICH CANNOT BE MEAS
- Page 123 and 124: MEASURING THAT WHICH CANNOT BE MEAS
- Page 125 and 126: MEASURING THAT WHICH CANNOT BE MEAS
- Page 127 and 128: MEASURING THAT WHICH CANNOT BE MEAS
- Page 129 and 130: MEASURING THAT WHICH CANNOT BE MEAS
- Page 131 and 132: MEASURING THAT WHICH CANNOT BE MEAS
- Page 133 and 134: MEASURING THAT WHICH CANNOT BE MEAS
- Page 135: PANEL DISCUSSION: CONNECTING SYSTEM
- Page 139 and 140: PANEL DISCUSSION: CONNECTING SYSTEM
- Page 141 and 142: PANEL DISCUSSION: CONNECTING SYSTEM
- Page 143 and 144: Workshop SummaryScott Bassett, Oreg
- Page 145: Freight Performance MeasuresCurrent
- Page 148 and 149: 140 PERFORMANCE MEASURES TO IMPROVE
- Page 150 and 151: 142 PERFORMANCE MEASURES TO IMPROVE
- Page 152 and 153: 144 PERFORMANCE MEASURES TO IMPROVE
- Page 154 and 155: 146 PERFORMANCE MEASURES TO IMPROVE
- Page 156 and 157: 148 PERFORMANCE MEASURES TO IMPROVE
- Page 158 and 159: 150 PERFORMANCE MEASURES TO IMPROVE
- Page 160 and 161: 152 PERFORMANCE MEASURES TO IMPROVE
- Page 163 and 164: APPENDIX ASummaries of 20 Poster Se
- Page 165 and 166: SUMMARIES OF 20 POSTER SESSIONS 157
- Page 167 and 168: TABLE 1(continued) WSDOT Outcomes,
- Page 169 and 170: SUMMARIES OF 20 POSTER SESSIONS 161
- Page 171 and 172: SUMMARIES OF 20 POSTER SESSIONS 163
- Page 173 and 174: SUMMARIES OF 20 POSTER SESSIONS 165
- Page 175 and 176: SUMMARIES OF 20 POSTER SESSIONS 167
- Page 177 and 178: FIGURE 2 Sacramento Regional Transi
- Page 179 and 180: FIGURE 3Goal evaluation table: Chit
- Page 181 and 182: SUMMARIES OF 20 POSTER SESSIONS 173
- Page 183 and 184: SUMMARIES OF 20 POSTER SESSIONS 175
- Page 185 and 186: SUMMARIES OF 20 POSTER SESSIONS 177
- Page 187 and 188:
TABLE 6Mobility Performance Measure
- Page 189 and 190:
SUMMARIES OF 20 POSTER SESSIONS 181
- Page 191 and 192:
SUMMARIES OF 20 POSTER SESSIONS 183
- Page 193 and 194:
SUMMARIES OF 20 POSTER SESSIONS 185
- Page 195 and 196:
FIGURE 13 MPAH lane-miles by roadwa
- Page 197 and 198:
SUMMARIES OF 20 POSTER SESSIONS 189
- Page 199 and 200:
SUMMARIES OF 20 POSTER SESSIONS 191
- Page 201 and 202:
SUMMARIES OF 20 POSTER SESSIONS 193
- Page 203 and 204:
SUMMARIES OF 20 POSTER SESSIONS 195
- Page 205 and 206:
SUMMARIES OF 20 POSTER SESSIONS 197
- Page 207 and 208:
SUMMARY OF PEER EXCHANGE ON DATA FO
- Page 209 and 210:
SUMMARY OF PEER EXCHANGE ON DATA FO
- Page 211 and 212:
SUMMARY OF PEER EXCHANGE ON DATA FO
- Page 213 and 214:
SUMMARY OF PEER EXCHANGE ON DATA FO
- Page 215 and 216:
SUMMARY OF PEER EXCHANGE ON DATA FO
- Page 217 and 218:
SUMMARY OF PEER EXCHANGE ON DATA FO
- Page 219 and 220:
SUMMARY OF PEER EXCHANGE ON DATA FO
- Page 221 and 222:
SUMMARY OF PEER EXCHANGE ON DATA FO
- Page 223 and 224:
APPENDIX C: RESEARCH STATEMENTS DEV
- Page 225 and 226:
LIST OF PARTICIPANTS 217University,
- Page 227:
LIST OF PARTICIPANTS 219Darwin Stua