Conference Proceedings 26 - Transportation Research Board
Conference Proceedings 26 - Transportation Research Board
Conference Proceedings 26 - Transportation Research Board
- No tags were found...
You also want an ePaper? Increase the reach of your titles
YUMPU automatically turns print PDFs into web optimized ePapers that Google loves.
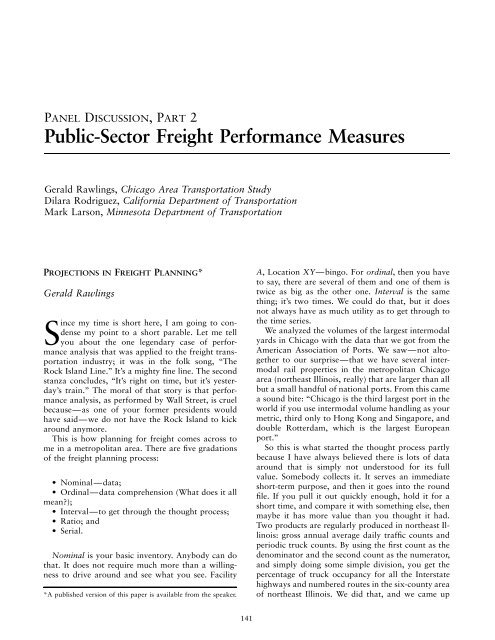
PANEL DISCUSSION, PART 2Public-Sector Freight Performance MeasuresGerald Rawlings, Chicago Area <strong>Transportation</strong> StudyDilara Rodriguez, California Department of <strong>Transportation</strong>Mark Larson, Minnesota Department of <strong>Transportation</strong>PROJECTIONS IN FREIGHT PLANNING*Gerald RawlingsSince my time is short here, I am going to condensemy point to a short parable. Let me tellyou about the one legendary case of performanceanalysis that was applied to the freight transportationindustry; it was in the folk song, ‘‘TheRock Island Line.’’ It’s a mighty fine line. The secondstanza concludes, ‘‘It’s right on time, but it’s yesterday’strain.’’ The moral of that story is that performanceanalysis, as performed by Wall Street, is cruelbecause—as one of your former presidents wouldhave said—we do not have the Rock Island to kickaround anymore.This is how planning for freight comes across tome in a metropolitan area. There are five gradationsof the freight planning process:• Nominal—data;• Ordinal—data comprehension (What does it allmean?);• Interval—to get through the thought process;• Ratio; and• Serial.Nominal is your basic inventory. Anybody can dothat. It does not require much more than a willingnessto drive around and see what you see. Facility*A published version of this paper is available from the speaker.A, Location XY—bingo. For ordinal, then you haveto say, there are several of them and one of them istwice as big as the other one. Interval is the samething; it’s two times. We could do that, but it doesnot always have as much utility as to get through tothe time series.We analyzed the volumes of the largest intermodalyards in Chicago with the data that we got from theAmerican Association of Ports. We saw—not altogetherto our surprise—that we have several intermodalrail properties in the metropolitan Chicagoarea (northeast Illinois, really) that are larger than allbut a small handful of national ports. From this camea sound bite: ‘‘Chicago is the third largest port in theworld if you use intermodal volume handling as yourmetric, third only to Hong Kong and Singapore, anddouble Rotterdam, which is the largest Europeanport.’’So this is what started the thought process partlybecause I have always believed there is lots of dataaround that is simply not understood for its fullvalue. Somebody collects it. It serves an immediateshort-term purpose, and then it goes into the roundfile. If you pull it out quickly enough, hold it for ashort time, and compare it with something else, thenmaybe it has more value than you thought it had.Two products are regularly produced in northeast Illinois:gross annual average daily traffic counts andperiodic truck counts. By using the first count as thedenominator and the second count as the numerator,and simply doing some simple division, you get thepercentage of truck occupancy for all the Interstatehighways and numbered routes in the six-county areaof northeast Illinois. We did that, and we came up141


