User Manual Dual C or Quad Ku Band TVRO Antenna (9497B-21)
User Manual Dual C or Quad Ku Band TVRO Antenna (9497B-21)
User Manual Dual C or Quad Ku Band TVRO Antenna (9497B-21)
- No tags were found...

You also want an ePaper? Increase the reach of your titles
YUMPU automatically turns print PDFs into web optimized ePapers that Google loves.
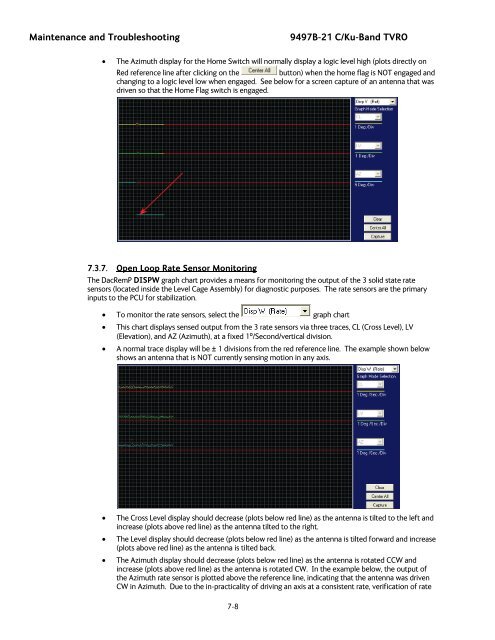
Maintenance and Troubleshooting<strong>9497B</strong>-<strong>21</strong> C/<strong>Ku</strong>-<strong>Band</strong> <strong>TVRO</strong>• The Azimuth display f<strong>or</strong> the Home Switch will n<strong>or</strong>mally display a logic level high (plots directly onRed reference line after clicking on thebutton) when the home flag is NOT engaged andchanging to a logic level low when engaged. See below f<strong>or</strong> a screen capture of an antenna that wasdriven so that the Home Flag switch is engaged.7.3.7. Open Loop Rate Sens<strong>or</strong> Monit<strong>or</strong>ingThe DacRemP DISPW graph chart provides a means f<strong>or</strong> monit<strong>or</strong>ing the output of the 3 solid state ratesens<strong>or</strong>s (located inside the Level Cage Assembly) f<strong>or</strong> diagnostic purposes. The rate sens<strong>or</strong>s are the primaryinputs to the PCU f<strong>or</strong> stabilization.• To monit<strong>or</strong> the rate sens<strong>or</strong>s, select the graph chart• This chart displays sensed output from the 3 rate sens<strong>or</strong>s via three traces, CL (Cross Level), LV(Elevation), and AZ (Azimuth), at a fixed 1º/Second/vertical division.• A n<strong>or</strong>mal trace display will be ± 1 divisions from the red reference line. The example shown belowshows an antenna that is NOT currently sensing motion in any axis.• The Cross Level display should decrease (plots below red line) as the antenna is tilted to the left andincrease (plots above red line) as the antenna tilted to the right.• The Level display should decrease (plots below red line) as the antenna is tilted f<strong>or</strong>ward and increase(plots above red line) as the antenna is tilted back.• The Azimuth display should decrease (plots below red line) as the antenna is rotated CCW andincrease (plots above red line) as the antenna is rotated CW. In the example below, the output ofthe Azimuth rate sens<strong>or</strong> is plotted above the reference line, indicating that the antenna was drivenCW in Azimuth. Due to the in-practicality of driving an axis at a consistent rate, verification of rate7-8