PacifiCorp 2007 Integrated Resource Plan (May 30, 2007)
PacifiCorp 2007 Integrated Resource Plan (May 30, 2007)
PacifiCorp 2007 Integrated Resource Plan (May 30, 2007)

Create successful ePaper yourself
Turn your PDF publications into a flip-book with our unique Google optimized e-Paper software.
Assuring abrightfuturefor our customers<strong>2007</strong><strong>Integrated</strong> <strong>Resource</strong> <strong>Plan</strong>Pacific Power | Rocky Mountain Power | <strong>PacifiCorp</strong> Energy
This <strong>2007</strong> <strong>Integrated</strong> <strong>Resource</strong> <strong>Plan</strong> (IRP) Report is based upon the best available information atthe time of preparation. The IRP action plan will be implemented as described herein, but is subjectto change as new information becomes available or as circumstances change. It is <strong>PacifiCorp</strong>’sintention to revisit and refresh the IRP action plan no less frequently than annually. Any refreshedIRP action plan will be submitted to the State Commissions for their information.For more information, contact:<strong>PacifiCorp</strong>IRP <strong>Resource</strong> <strong>Plan</strong>ning825 N.E. Multnomah, Suite 600Portland, Oregon 97232(503) 813-5245IRP@<strong>PacifiCorp</strong>.comhttp://www.<strong>PacifiCorp</strong>.comThis report is printed on recycled paperCover Photos (Left to Right):Wind: Foot Creek 1Hydroelectric Generation: Yale Reservoir (Washington)Demand side management: Agricultural IrrigationThermal-Gas: Currant Creek Power <strong>Plan</strong>tTransmission: South Central Wyoming line
<strong>PacifiCorp</strong> – <strong>2007</strong> IRPTable Of ContentsTABLE OF CONTENTSTable of Contents......................................................................................................................................iIndex of Tables.......................................................................................................................................viiIndex of Figures .......................................................................................................................................x1. Executive Summary ...............................................................................................................................1Introduction..............................................................................................................................................1<strong>Plan</strong>ning Principles and Objectives..........................................................................................................1The <strong>Plan</strong>ning Environment ......................................................................................................................1<strong>Resource</strong> Needs Assessment....................................................................................................................3<strong>Resource</strong> Options .....................................................................................................................................5Modeling and Risk Analysis Approach ...................................................................................................5Modeling and Portfolio Selection Results................................................................................................7Action <strong>Plan</strong>.............................................................................................................................................102. IRP Components, <strong>Plan</strong>ning Principles, Objectives, and Approach ................................................11Introduction............................................................................................................................................11<strong>2007</strong> <strong>Integrated</strong> <strong>Resource</strong> <strong>Plan</strong> Components .........................................................................................12The Role of <strong>PacifiCorp</strong>’s <strong>Integrated</strong> <strong>Resource</strong> <strong>Plan</strong>ning .......................................................................12<strong>Plan</strong>ning Principles ................................................................................................................................13Key Analytical and Modeling Objectives..............................................................................................14<strong>Integrated</strong> <strong>Resource</strong> <strong>Plan</strong>ning Approach Overview...............................................................................16Analytical Process............................................................................................................................. 16Public Process ................................................................................................................................... 17Stakeholder Engagement........................................................................................................................18MidAmerican Energy Holdings Company IRP Commitments..............................................................19Treatment of Customer and Investor Risks............................................................................................24Stochastic Risks ................................................................................................................................ 25Capital Cost Risks............................................................................................................................. 25Scenario Risks................................................................................................................................... 253. The <strong>Plan</strong>ning Environment.................................................................................................................27Introduction............................................................................................................................................28Marketplace and Fundamentals..............................................................................................................28Electricity Markets............................................................................................................................ 29Natural Gas Supply and Demand Issues ........................................................................................... <strong>30</strong>Future Emission Compliance Issues ......................................................................................................31Currently Regulated Emissions......................................................................................................... 32Climate Change................................................................................................................................. 32Impacts and Sources ......................................................................................................................33International and Federal Policies..................................................................................................33Regional Initiatives ........................................................................................................................34State Initiatives ..............................................................................................................................35Corporate Greenhouse Gas Mitigation Strategy ............................................................................41Renewable Portfolio Standards..............................................................................................................42California .......................................................................................................................................... 42Oregon............................................................................................................................................... 43Washington ....................................................................................................................................... 44Federal Renewable Portfolio Standard.............................................................................................. 44Transmission <strong>Plan</strong>ning...........................................................................................................................44<strong>Integrated</strong> <strong>Resource</strong> <strong>Plan</strong>ning Perspective ........................................................................................44i
<strong>PacifiCorp</strong> – <strong>2007</strong> IRPTable Of ContentsInterconnection-Wide Regional <strong>Plan</strong>ning ......................................................................................... 45Sub-regional <strong>Plan</strong>ning Groups .......................................................................................................... 46Hydroelectric Relicensing......................................................................................................................47Potential Impact ................................................................................................................................ 48Treatment in the IRP ......................................................................................................................... 48<strong>PacifiCorp</strong>’s Approach to Hydroelectric Relicensing....................................................................... 49Energy Policy Act of 2005.....................................................................................................................49Clean Coal Provisions....................................................................................................................... 49Renewable Energy Provisions........................................................................................................... 50Hydropower ...................................................................................................................................... 51Public Utility Regulatory Policies Act Provisions ............................................................................ 51Metering Provisions.......................................................................................................................51Fuel Source Diversity ....................................................................................................................52Fossil Fuel Generation Efficiency Standard ..................................................................................53Transmission and Electric Reliability Provisions ............................................................................. 53Section 368a, Energy Corridors.....................................................................................................53Section 1221, National Transmission Congestion Study...............................................................54Climate Change................................................................................................................................. 56Recent <strong>Resource</strong> Procurement Activities...............................................................................................57Supply-Side <strong>Resource</strong>s...................................................................................................................... 572012 Request for Proposals for Base Load <strong>Resource</strong>s ..................................................................57Renewables Request for Proposal 2003B ......................................................................................57Demand-side <strong>Resource</strong>s .................................................................................................................... 57The Impact of State <strong>Resource</strong> Policies on System-Wide <strong>Plan</strong>ning........................................................584. <strong>Resource</strong> Needs Assessment ................................................................................................................61Introduction............................................................................................................................................62Load Forecast.........................................................................................................................................62Methodology Overview .................................................................................................................... 62<strong>Integrated</strong> <strong>Resource</strong> <strong>Plan</strong>ning Load Forecasts .................................................................................. 62Energy Forecast................................................................................................................................. 63System-Wide Coincident Peak Load Forecast .................................................................................. 64Jurisdictional Peak Load Forecast..................................................................................................... 66<strong>May</strong> 2006 Load Forecast Comparison .............................................................................................. 67Existing <strong>Resource</strong>s.................................................................................................................................68Thermal <strong>Plan</strong>ts .................................................................................................................................. 69Renewables ....................................................................................................................................... 69Wind...............................................................................................................................................69Geothermal.....................................................................................................................................70Biomass..........................................................................................................................................70Solar...............................................................................................................................................70Hydroelectric Generation .................................................................................................................. 70Demand-side Management................................................................................................................ 71Class 1 Demand-side Management................................................................................................72Class 2 Demand-side Management................................................................................................73Class 3 Demand-side Management................................................................................................73Class 4 Demand-side Management................................................................................................73Contracts ........................................................................................................................................... 74Load and <strong>Resource</strong> Balance...................................................................................................................76Capacity and Energy Balance Overview........................................................................................... 76Load and <strong>Resource</strong> Balance Components......................................................................................... 76Existing <strong>Resource</strong>s.........................................................................................................................76ii
<strong>PacifiCorp</strong> – <strong>2007</strong> IRPTable Of ContentsObligation ......................................................................................................................................78Reserves.........................................................................................................................................78Position ..........................................................................................................................................78Reserve Margin..............................................................................................................................78Capacity Balance Determination....................................................................................................... 79Methodology..................................................................................................................................79Load and <strong>Resource</strong> Balance Assumptions.....................................................................................79Capacity Balance Results...............................................................................................................80Energy Balance Determination ......................................................................................................... 85Methodology..................................................................................................................................85Energy Balance Results..................................................................................................................... 85Load and <strong>Resource</strong> Balance Conclusions ......................................................................................... 875. <strong>Resource</strong> Options .................................................................................................................................89Introduction............................................................................................................................................89Supply-Side <strong>Resource</strong>s ..........................................................................................................................90<strong>Resource</strong> Selection Criteria............................................................................................................... 90Derivation of <strong>Resource</strong> Attributes..................................................................................................... 90Handling of Technology Improvement Trends and Cost Uncertainty .............................................. 91<strong>Resource</strong> Options and Associated Attributes .................................................................................... 91<strong>Resource</strong> Descriptions....................................................................................................................... 97Coal................................................................................................................................................97Natural Gas ....................................................................................................................................99Wind.............................................................................................................................................100Other Renewable <strong>Resource</strong>s ........................................................................................................101Combined Heat and Power and Other Distributed Generation Alternatives ...............................102Energy Storage.............................................................................................................................102Nuclear.........................................................................................................................................103Demand-side <strong>Resource</strong>s.......................................................................................................................103<strong>Resource</strong> Selection Criteria............................................................................................................. 103Class 1 Demand-side Management..............................................................................................103Class 2 Demand-side Management..............................................................................................104Class 3 Demand-side Management..............................................................................................104Class 4 Demand-side Management..............................................................................................104<strong>Resource</strong> Options and Attributes..................................................................................................... 104Class 1 Demand-side Management..............................................................................................104Class 2 Demand-side Management..............................................................................................106Class 3 Demand-side Management..............................................................................................109<strong>Resource</strong> Descriptions..................................................................................................................... 110Class 1 Demand-side Management..............................................................................................110Class 2 Demand-side Management..............................................................................................112Class 3 Demand-side Management..............................................................................................112Transmission <strong>Resource</strong>s.......................................................................................................................113<strong>Resource</strong> Selection Criteria............................................................................................................. 113<strong>Resource</strong> Options and Attributes..................................................................................................... 113Market Purchases .................................................................................................................................114<strong>Resource</strong> Selection Criteria............................................................................................................. 114<strong>Resource</strong> Options and Attributes..................................................................................................... 115<strong>Resource</strong> Description ...................................................................................................................... 116Proposed Use and Impact of Physical and Financial Hedging........................................................ 1166. Modeling and Risk Analysis Approach............................................................................................117Introduction..........................................................................................................................................118iii
<strong>PacifiCorp</strong> – <strong>2007</strong> IRPTable Of Contents<strong>Resource</strong> Screening..............................................................................................................................118Alternative Future Scenarios........................................................................................................... 119Carbon Dioxide Regulation Cost .................................................................................................121Commodity Coal Cost..................................................................................................................122Natural Gas and Electricity Prices ...............................................................................................122Retail Load Growth......................................................................................................................123Renewable Portfolio Standards....................................................................................................123Class 1 and Class 3 DSM Potential..............................................................................................123Sensitivity Analysis Scenarios for the Capacity Expansion Module .............................................. 124Sensitivity Analysis Scenarios for the <strong>Plan</strong>ning and Risk Module................................................. 126Capacity Expansion Module Optimization Runs ............................................................................ 126Risk Analysis Portfolio Development..................................................................................................127Determination of Fixed <strong>Resource</strong> Investment Schedules................................................................ 128Alternative <strong>Resource</strong> Strategies ...................................................................................................... 128Optimization Runs for Risk Analysis Portfolio Development........................................................ 128Stochastic Simulation of Risk Analysis Portfolios ..............................................................................129Stochastic Risk Analysis................................................................................................................. 129Scenario Risk Analysis ................................................................................................................... 1<strong>30</strong>Portfolio Performance Measures..........................................................................................................131Stochastic Mean Cost...................................................................................................................... 131Customer Rate Impact..................................................................................................................... 132Environmental Externality Cost...................................................................................................... 132Risk Exposure ................................................................................................................................. 134Capital Cost..................................................................................................................................... 134Production Cost Variability............................................................................................................. 134Carbon Dioxide Emissions.............................................................................................................. 134Supply Reliability............................................................................................................................ 134Energy Not Served.......................................................................................................................134Loss of Load Probability..............................................................................................................135Preferred Portfolio Selection................................................................................................................136Class 2 Demand-side Management Program Analysis ........................................................................136Decrement Analysis ........................................................................................................................ 136Public Utility Commission Guidelines for Conservation Program Analysis in the IRP................. 1377. Modeling and Portfolio Selection Results ........................................................................................139Introduction..........................................................................................................................................140Alternative Future and Sensitivity Scenario Results............................................................................140Alternative Future Scenario Results................................................................................................ 140Demand-side Management Program Selection Patterns..............................................................142DSM Potential Scenarios .............................................................................................................143Load Growth Scenarios................................................................................................................143Gas/Electricity Price Scenarios....................................................................................................145Carbon Dioxide Adder/Coal Cost Scenarios ...............................................................................146Sensitivity Analysis Results............................................................................................................ 147<strong>Resource</strong> Selection Conclusions ..................................................................................................... 151Risk Analysis Portfolio Development – Group 1 ................................................................................153Fixed <strong>Resource</strong> Additions for Risk Analysis Portfolios ................................................................. 154Renewables ..................................................................................................................................154Class 1 Demand-side Management Programs .............................................................................155Combined Heat and Power <strong>Resource</strong>s.........................................................................................157Alternative <strong>Resource</strong> Strategies ...................................................................................................... 158Stochastic Simulation Results – Group 1 Portfolios ............................................................................161iv
<strong>PacifiCorp</strong> – <strong>2007</strong> IRPTable Of ContentsStochastic Mean Cost...................................................................................................................... 162Customer Rate Impact..................................................................................................................... 164Emissions Externality Cost ............................................................................................................. 165Capital Cost..................................................................................................................................... 165Stochastic Risk Measures................................................................................................................ 166Cost/Risk Tradeoff Analysis ........................................................................................................... 169<strong>Resource</strong> Strategy Risk Reduction.................................................................................................. 171Carbon Dioxide and Other Emissions............................................................................................. 171Supply Reliability............................................................................................................................ 176Energy Not Served.......................................................................................................................176Loss of Load Probability..............................................................................................................177Portfolio <strong>Resource</strong> Conclusions...................................................................................................... 179Risk Analysis Portfolio Development – Group 2 ................................................................................179Alternative <strong>Resource</strong> Strategies ...................................................................................................... 181Stochastic Simulation Results..............................................................................................................186Stochastic Mean Cost...................................................................................................................... 186Customer Rate Impact..................................................................................................................... 187Emissions Externality Cost ............................................................................................................. 187Capital Cost..................................................................................................................................... 188Stochastic Risk Measures................................................................................................................ 190Cost/Risk Tradeoff Analysis ........................................................................................................... 191Carbon Dioxide and Other Emissions............................................................................................. 193Supply Reliability............................................................................................................................ 198Stochastic Simulation Sensitivity Analyses .........................................................................................20012-Percent <strong>Plan</strong>ning Reserve Margin with Class 3 Demand-side Management Programs............. 201<strong>Plan</strong> to an 18-Percent <strong>Plan</strong>ning Reserve Margin............................................................................. 201Replace a 2012 Base Load <strong>Resource</strong> with Front Office Transactions ............................................ 201Replace a Base Load Pulverized Coal <strong>Resource</strong> with a Carbon-Capture-Ready IGCC ................. 201Replace a Base Load <strong>Resource</strong> with CHP and Dispatchable Customer Standby Generation......... 202Preferred Portfolio Selection and Justification ....................................................................................202<strong>Plan</strong>ning Reserve Margin Selection ................................................................................................ 203The Role of Front Office Transactions and Market Availability Considerations ........................... 205Fuel Diversity <strong>Plan</strong>ning .......................................................................................................................205Forecasted Fossil Fuel Generator Heat Rate Trend .............................................................................209Class 2 DSM Decrement Analysis.......................................................................................................210Modeling Results ............................................................................................................................ 210Regulatory Scenario Risk Analysis – Greenhouse Gas Emissions Performance Standards................213Scenario Study Approach................................................................................................................ 213Stochastic Cost and Risk Results .................................................................................................... 214Carbon Dioxide Emissions Results................................................................................................. 2178. Action <strong>Plan</strong> .........................................................................................................................................221Introduction..........................................................................................................................................222The <strong>Integrated</strong> <strong>Resource</strong> <strong>Plan</strong> Action <strong>Plan</strong> ..........................................................................................223<strong>Resource</strong> Procurement .........................................................................................................................229Overall <strong>Resource</strong> Procurement Strategy ......................................................................................... 229Renewable <strong>Resource</strong>s...................................................................................................................... 229Demand-side Management.............................................................................................................. 229Combined Heat and Power.............................................................................................................. 2<strong>30</strong>Distributed Generation .................................................................................................................... 2<strong>30</strong>Thermal Base Load/Intermediate Load <strong>Resource</strong>s ......................................................................... 2<strong>30</strong>Front Office Transactions ............................................................................................................... 231v
<strong>PacifiCorp</strong> – <strong>2007</strong> IRPTable Of ContentsTransmission Expansion ................................................................................................................. 231Other Issues..........................................................................................................................................232Global Climate Change................................................................................................................... 232Carbon Reducing Technologies ...................................................................................................... 232Modeling Improvements ................................................................................................................. 232Cost Assignment and Recovery ...................................................................................................... 233Assessment of Owning Assets versus Purchasing Power ....................................................................233<strong>Resource</strong> Acquisition <strong>Plan</strong> Path Analysis............................................................................................233vi
<strong>PacifiCorp</strong> – <strong>2007</strong> IRPIndex of Tables and FiguresINDEX OF TABLESTable 1.1 – Historical and Forecasted Average Energy Growth Rates for Load ........................... 3Table 1.2 – Capacity System Position for 12% and 15% <strong>Plan</strong>ning Reserve Margin ..................... 3Table 1.3 – <strong>PacifiCorp</strong>’s <strong>2007</strong> IRP Preferred Portfolio.................................................................. 8Table 2.1 – IRP and Public Process Timeline............................................................................... 17Table 2.2 – Participation in Regional <strong>Plan</strong>ning Organizations and Working Groups.................. 18Table 2.3 – Public Process Recommendations Implemented for the <strong>2007</strong> IRP ........................... 19Table 2.4 – MidAmerican/<strong>PacifiCorp</strong> Transaction Commitments Addressed in the IRP............ 20Table 3.1 – State <strong>Resource</strong> Policy Developments for 2006 and <strong>2007</strong>.......................................... 58Table 4.1 – Historical and Forecasted Average Energy Growth Rates for Load ......................... 63Table 4.2 – Annual Load Growth in Megawatt-hours for 2006 and forecasted <strong>2007</strong> through 2016............................................................................................................................................... 63Table 4.3 – Historical and Forecasted Coincidental Peak Load Growth Rates............................ 64Table 4.4 – Historical Coincidental Peak Load - Summer ........................................................... 65Table 4.5 – Forecasted Coincidental Peak Load in Megawatts.................................................... 65Table 4.6 – Historical Jurisdictional Peak Load ........................................................................... 66Table 4.7 – Jurisdictional Peak Load in Megawatts for 2006 and forecast <strong>2007</strong> through 2016... 66Table 4.8 – Changes from <strong>May</strong> 2006 to March <strong>2007</strong>: Forecasted Coincidental Peak Load ........ 67Table 4.9 – Changes from <strong>May</strong> 2006 to March <strong>2007</strong>: Forecasted Load Growth ......................... 68Table 4.10 – Capacity Ratings of Existing <strong>Resource</strong>s.................................................................. 68Table 4.11 – Existing DSM Summary, <strong>2007</strong>-2016....................................................................... 73Table 4.12 – Capacity Load and <strong>Resource</strong> Balance (12% <strong>Plan</strong>ning Reserve Margin)................. 81Table 4.13 – System Capacity Load and <strong>Resource</strong> (15% <strong>Plan</strong>ning Reserve Margin).................. 82Table 5.1 – East Side Supply-Side <strong>Resource</strong> Options .................................................................. 93Table 5.2 – West Side Supply-Side <strong>Resource</strong> Options................................................................. 94Table 5.3 – Total <strong>Resource</strong> Cost for East Side Supply-Side <strong>Resource</strong> Options........................... 95Table 5.4 – Total <strong>Resource</strong> Cost for West Side Supply-Side <strong>Resource</strong> Options ......................... 96Table 5.5 – CHP Potential Prospects .......................................................................................... 102Table 5.6 – Sample Load Shapes Developed for <strong>2007</strong> IRP Decrement Analysis ...................... 104Table 5.7 – Class 1 DSM Program Attributes, West Control Area ............................................ 105Table 5.8 – Class 1 DSM Program Attributes, East Control Area ............................................. 106Table 5.9 – Class 3 DSM Program Attributes, West Control Area ............................................ 109Table 5.10 – Class 3 DSM Program Attributes, East Control Area ........................................... 110Table 5.11 – Transmission Options ............................................................................................ 113Table 5.12 – Maximum Available Front Office Transaction Quantities by Market Hub........... 115Table 6.1 – Alternative Future Scenarios ................................................................................... 120Table 6.2 – Scenario Input Variable Values and Sources........................................................... 121Table 6.3 – Sensitivity Scenarios................................................................................................ 125Table 6.4 – CEM Sensitivity Scenario Capital Cost Values....................................................... 125Table 6.5 – <strong>Plan</strong>ning Decrement Design .................................................................................... 137Table 7.1 – Alternative Future Scenarios ................................................................................... 141Table 7.2 – Alternative Future Scenario PVRR and Cumulative Additions for <strong>2007</strong>-2018 ...... 141Table 7.3 – DSM <strong>Resource</strong> Selection by Alternative Future Type ............................................ 143Table 7.4 – <strong>Resource</strong> Additions for Load Growth Scenarios ..................................................... 143Table 7.5 – <strong>Resource</strong> Additions for Scenarios with Low Load Growth..................................... 144vii
<strong>PacifiCorp</strong> – <strong>2007</strong> IRPIndex of Tables and FiguresTable 7.6 – <strong>Resource</strong> Additions for Scenarios with Medium Load Growth .............................. 144Table 7.7 – <strong>Resource</strong> Additions for Scenarios with High Load Growth.................................... 144Table 7.8 – <strong>Resource</strong> Additions for Scenarios with Low Gas/Electricity Prices ....................... 145Table 7.9 – <strong>Resource</strong> Additions for Scenarios with High Gas/Electricity Prices....................... 145Table 7.10 – <strong>Resource</strong> Additions for Scenarios with Low CO 2 Adder/Coal Costs.................... 146Table 7.11 – <strong>Resource</strong> Additions for Scenarios with High CO 2 Adder/Coal Costs................... 146Table 7.12 – Sensitivity Analysis Scenarios............................................................................... 147Table 7.13 – Sensitivity Analysis Scenario PVRR and Cumulative Additions, <strong>2007</strong>-2018 ...... 148Table 7.14 – Wind <strong>Resource</strong> Additions Schedule for Risk Analysis Portfolios ........................ 155Table 7.15 – Class 1 DSM Cumulative <strong>Resource</strong> Additions for Candidate Portfolios .............. 157Table 7.16 – Risk Analysis Portfolio Descriptions (Group 1).................................................... 159Table 7.17 – Generation and Transmission <strong>Resource</strong> Additions................................................ 161Table 7.18 – Portfolio Cost by CO 2 Adder Case ........................................................................ 162Table 7.19 – Cost Impact of Portfolio <strong>Resource</strong> Strategies........................................................ 163Table 7.20 – Portfolio Emissions Externality Cost by CO 2 Adder Level................................... 165Table 7.21 – Average Risk Exposure and Standard Deviation for CO 2 Adder Cases................ 166Table 7.22 – Risk Measure Results by CO 2 Adder Case (Million $) ......................................... 167Table 7.23 – <strong>Resource</strong> Strategies and Test Portfolios for Cost-Risk Exposure.......................... 171Table 7.24 – Cumulative CO 2 Emissions by Cost Adder Level, <strong>2007</strong>-2016.............................. 172Table 7.25 – Cumulative CO 2 Emissions by Cost Adder Level, <strong>2007</strong>-2026.............................. 173Table 7.26 – System Generator Emissions Footprint, Cumulative Amount for <strong>2007</strong>–2026...... 175Table 7.27 – Average Loss of Load Probability During Summer Peak ..................................... 177Table 7.28 – Year-by-Year Loss of Load Probability ................................................................ 178Table 7.29 – Wind <strong>Resource</strong> Additions Schedule for Risk Analysis Portfolios ........................ 180Table 7.<strong>30</strong> – Risk Analysis Portfolio Descriptions (Group 2).................................................... 182Table 7.31 – <strong>Resource</strong> Investment Schedule for Portfolio RA13............................................... 183Table 7.32 – <strong>Resource</strong> Investment Schedule for Portfolio RA14............................................... 184Table 7.33 – <strong>Resource</strong> Investment Schedule for Portfolio RA15............................................... 184Table 7.34 – <strong>Resource</strong> Investment Schedule for Portfolio RA16............................................... 185Table 7.35 – <strong>Resource</strong> Investment Schedule for Portfolio RA17............................................... 185Table 7.36 – Transmission <strong>Resource</strong> Investment Schedule for All Group 2 Portfolios............. 186Table 7.37 – Stochastic Mean PVRR by CO 2 Adder Case......................................................... 186Table 7.38 – Portfolio Emissions Externality Cost by CO 2 Adder Level and Regulation Type 188Table 7.39 – Stochastic Risk Results.......................................................................................... 190Table 7.40 – CO 2 Emissions by Adder Case and Time Period (1,000 Tons)............................. 193Table 7.41 – Total Emissions Footprint by CO 2 Adder Case..................................................... 197Table 7.42 – Average Loss of Load Probability During Summer Peak ..................................... 199Table 7.43 – Year-by-Year Loss of Load Probability ................................................................ 200Table 7.44 – Sensitivity Analysis Scenarios for Detailed Simulation Analysis......................... 201Table 7.45 – Combined Heat and Power Replacement <strong>Resource</strong>s............................................. 202Table 7.46 – Preferred Portfolio Capacity Load and <strong>Resource</strong> Balance .................................... 204Table 7.47 – Annual Nominal Avoided Costs for Decrements, 2010-2017............................... 211Table 7.48 – Annual Nominal Avoided Costs for Decrements, 2018-2026............................... 211Table 7.49 – Capacity Additions for the Initial CEM GHG Emissions Performance StandardPortfolio .............................................................................................................................. 214Table 7.50 – <strong>Resource</strong> Investment Schedule for the Final GHG Emissions Performance StandardPortfolio .............................................................................................................................. 215viii
<strong>PacifiCorp</strong> – <strong>2007</strong> IRPIndex of Tables and FiguresTable 7.51 – Stochastic Cost and Risk Results for the Final GHG Emissions PerformanceStandard Portfolio ............................................................................................................... 215Table 8.1 – <strong>Resource</strong> Investment Schedule for Portfolio RA14................................................. 222Table 8.2 – <strong>2007</strong> IRP Action <strong>Plan</strong> .............................................................................................. 224ix
<strong>PacifiCorp</strong> – <strong>2007</strong> IRPIndex of Tables and FiguresINDEX OF FIGURESFigure 1.1 – System Capacity Chart ............................................................................................... 4Figure 1.2 – Monthly and Annual Average Energy Balance.......................................................... 4Figure 1.3 – Projected <strong>PacifiCorp</strong> <strong>Resource</strong> Energy Mix............................................................... 9Figure 2.1 – <strong>Integrated</strong> <strong>Resource</strong> <strong>Plan</strong>ning Analytical Process Steps .......................................... 16Figure 3.1 – Sub-regional Transmission <strong>Plan</strong>ning Groups in the WECC .................................... 47Figure 3.2 – Western Interconnection Transmission Congestion Areas/Paths............................. 55Figure 3.3 – Conditional Constraint Areas ................................................................................... 56Figure 4.1 – Contract Capacity in the <strong>2007</strong> Load and <strong>Resource</strong> Balance .................................... 75Figure 4.2 – Changes in Contract Capacity in the Load and <strong>Resource</strong> Balance .......................... 75Figure 4.3 – System Coincident Peak Capacity Chart.................................................................. 82Figure 4.4 – West Coincident Peak Capacity Chart ..................................................................... 83Figure 4.5 – East Coincident Peak Capacity Chart....................................................................... 84Figure 4.6 – Average Monthly and Annual System Energy Balances ......................................... 86Figure 4.7 – Average Monthly and Annual West Energy Balances............................................. 86Figure 4.8 – Average Monthly and Annual East Energy Balances .............................................. 87Figure 5.1 – Proxy Wind Sites and Maximum Capacity Availabilities...................................... 101Figure 5.2 – DSM Decrement, Daily End Use Shape (megawatts)............................................ 107Figure 5.3 – DSM Decrement, Weekly Peaks (megawatts) ....................................................... 108Figure 5.4 – Transmission Options Topology ............................................................................ 114Figure 6.1 – Modeling and Risk Analysis Process ..................................................................... 118Figure 6.2 – System Average Annual Natural Gas Prices: Low, Medium, and High ScenarioValues ................................................................................................................................. 122Figure 6.3 – System Average Annual Electricity Prices for Heavy and Light Load Hour NaturalGas Prices: Low, Medium, and High Scenario Values....................................................... 123Figure 6.4 – Two-Stage Risk Analysis Portfolio Development Process .................................... 129Figure 7.1 – Cumulative <strong>Resource</strong> Additions by Year for Alternative Future Studies .............. 142Figure 7.2 – Cumulative Wind Additions for CAF07 and SAS16 ............................................. 151Figure 7.3 – CEM Fossil Fuel <strong>Resource</strong> Selection Frequency ................................................... 152Figure 7.4 – Wind Capacity Preferences for Alternative Future Scenarios................................ 154Figure 7.5 – Wind Location Preferences for Alternative Future Scenarios................................ 155Figure 7.6 – Class 1 DSM Selection Frequency for Alternative Future Scenarios, <strong>2007</strong>-2016. 156Figure 7.7 – Class 1 DSM Average Megawatts for Alternative Future Scenarios, <strong>2007</strong>-2016.. 157Figure 7.8 – CHP Quantities Selected for Each Alternative Future Scenario, <strong>2007</strong>-2016......... 158Figure 7.9 – Stochastic Mean Cost by CO 2 Adder Case............................................................. 163Figure 7.10 – Customer Rate Impact .......................................................................................... 164Figure 7.11 – Total Capital Cost by Portfolio............................................................................. 166Figure 7.12 – Average Stochastic Cost versus Risk Exposure ................................................... 169Figure 7.13 – Stochastic Cost versus Risk Exposure for the $0 CO 2 Adder Case ..................... 170Figure 7.14 – Stochastic Cost versus Risk Exposure for the $61 CO 2 Adder Case ................... 170Figure 7.15 – Generator CO 2 Emissions by Cost Adder Level, Cumulative for <strong>2007</strong>-2016...... 174Figure 7.16 – Generator CO 2 Emissions by Cost Adder Level, Cumulative for <strong>2007</strong>-2026...... 174Figure 7.17 – Stochastic Average Annual Energy Not Served................................................... 176Figure 7.18 – Upper-Tail Stochastic Mean Energy Not Served ................................................. 177Figure 7.19 – Customer Rate Impact .......................................................................................... 187Figure 7.20 – Total Capital Cost by Portfolio............................................................................. 189x
<strong>PacifiCorp</strong> – <strong>2007</strong> IRPIndex of Tables and FiguresFigure 7.21 – Average Stochastic Cost versus Risk Exposure ................................................... 191Figure 7.22 – Stochastic Cost versus Risk Exposure for the $0 CO 2 Adder Case ..................... 192Figure 7.23 – Stochastic Cost versus Risk Exposure for the $61 CO 2 Adder Case ................... 192Figure 7.24 – Annual CO 2 Emission Trends, <strong>2007</strong>-2026, ($8 CO 2 Adder Case)....................... 194Figure 7.25 – Annual CO 2 Emission Trends, <strong>2007</strong>-2026, ($61 CO 2 Adder Case)..................... 195Figure 7.26 – Annual CO 2 Emissions Trends, <strong>2007</strong>-2016 ($8 CO 2 Adder Case) ...................... 195Figure 7.27 – Annual CO 2 Emissions Trends, <strong>2007</strong>-2016 ($61 CO 2 Adder Case) .................... 196Figure 7.28 – Annual CO 2 Emissions Trends, <strong>2007</strong>-2016 ($8 CO 2 Adder Case) ...................... 196Figure 7.29 – Annual CO 2 Emissions Trends, <strong>2007</strong>-2016 ($61 CO 2 Adder Case) .................... 197Figure 7.<strong>30</strong> – Energy Not Served for the $8 CO 2 Adder Case ................................................... 198Figure 7.31 – Upper-Tail Mean Energy Not Served for the $8 CO 2 Adder Case ...................... 199Figure 7.32 – Current and Projected <strong>PacifiCorp</strong> <strong>Resource</strong> Energy Mix..................................... 207Figure 7.33 – Current and Projected <strong>PacifiCorp</strong> <strong>Resource</strong> Capacity Mix.................................. 208Figure 7.34 – Fleet Average Fossil Fuel Heat Rate Annual Trend by Generator Type ............. 210Figure 7.35 – East Decrement Price Trends ............................................................................... 212Figure 7.36 – West Decrement Price Trends.............................................................................. 212Figure 7.37 – Average Stochastic Cost versus Risk Exposure Across All CO 2 Adder Cases.... 216Figure 7.38 – Stochastic Cost versus Risk Exposure for the $0 CO 2 Adder Case ..................... 216Figure 7.39 – Stochastic Cost versus Risk Exposure for the $61 CO 2 Adder Case ................... 217Figure 7.40 – Annual CO 2 Emission Trends, <strong>2007</strong>-2026 ($0 CO 2 Adder Case)........................ 218Figure 7.41 – Annual CO 2 Emission Trends, <strong>2007</strong>-2026 ($61 CO 2 Adder Case)...................... 218Figure 7.42 – Annual CO 2 Emission Trends, <strong>2007</strong>-2026 (Average for all CO 2 Adder Cases).. 219xi
<strong>PacifiCorp</strong> – <strong>2007</strong> IRPIndex of Tables and Figuresxii
<strong>PacifiCorp</strong> – <strong>2007</strong> IRPChapter 1 – Executive Summary1. EXECUTIVE SUMMARYINTRODUCTION<strong>PacifiCorp</strong>’s <strong>2007</strong> <strong>Integrated</strong> <strong>Resource</strong> <strong>Plan</strong> (IRP) presents a framework of future actions to ensure<strong>PacifiCorp</strong> continues to provide reliable, least-cost service with manageable and reasonablerisk to its customers. Active public involvement from customer interest groups, regulatory staff,regulators and other stakeholders provided considerable guidance in the development of this IRP.The analytical approach used conforms to all State Standards and Guidelines, and resulted in apreferred portfolio that represents a balance of resource additions that meet future customerneeds while minimizing cost, balancing diverse stakeholder interests and addressing environmentalconcerns. This IRP builds on <strong>PacifiCorp</strong>’s prior resource planning efforts and reflectssignificant advancements in portfolio modeling and risk analysis.PLANNING PRINCIPLES AND OBJECTIVESThe mandate for an IRP is to assure, on a long-term basis, an adequate and reliable electricitysupply at the lowest reasonable cost and in a manner “consistent with the long-run public interest.”The main role of the IRP is to serve as a roadmap for determining and implementing thecompany’s long-term resource strategy according to this IRP mandate. In doing so, it accountsfor state commission IRP requirements, the current view of the planning environment, corporatebusiness goals, and MidAmerican Energy Holdings Company (MEHC) transaction commitmentsthat related to IRP activities.As a business planning tool, it supports informed decision-making on resource procurement byproviding an analytical framework for assessing resource investment tradeoffs. As an externalcommunications tool, the IRP engages numerous stakeholders in the planning process and guidesthem through the key decision points leading to <strong>PacifiCorp</strong>’s preferred portfolio of generation,demand-side, and transmission resources.The emphasis of the IRP is to determine the most robust resource plan under a reasonably widerange of potential futures as opposed to the optimal plan for some expected view of the future.The modeling is intended to support rather than overshadow the expert judgment of <strong>PacifiCorp</strong>’sdecision-makers. The preferred portfolio is not meant to be a static planning product, but ratheris expected to evolve as part of the ongoing planning process. As a multi-objective planning effort,the IRP must reach a balanced position upon considering several priorities and accountingfor diverse and sometimes conflicting stakeholder views. In short, the IRP cannot be all things toall people. As the owner of the IRP, <strong>PacifiCorp</strong> is uniquely positioned to determine the resourceplan that best accomplishes IRP objectives on a system-wide basis, thereby meeting customer,community, and investor obligations collectively.THE PLANNING ENVIRONMENTThere are many significant external influences that impact <strong>PacifiCorp</strong>’s long-term resource planning,as well as recent procurement activities driven by the company’s past IRPs. External influencesare comprised of events and trends in the power industry marketplace, along with govern-1
<strong>PacifiCorp</strong> – <strong>2007</strong> IRPChapter 1 – Executive Summaryment policy and regulatory initiatives that influence the environment in which <strong>PacifiCorp</strong> operates.One major issue within the power industry marketplace is capacity resource adequacy and associatedstandards for the Western Electricity Coordinating Council (WECC). The pace of newgeneration additions has begun to slow again in the west, raising the question of future resourceadequacy in certain areas. The Western Electricity Coordinating Council 2006 Power SupplyAssessment indicates that the Rocky Mountain sub-region will show a resource deficit by 2010.Another significant issue is the prospect for long-term natural gas commodity price escalationand continued high volatility. Following an unprecedented increase in natural gas commodityescalation and volatility, forecasters expect a medium-term, temporary drop in natural gas commodityprices due to liquefied natural gas (LNG) facility expansion. Price uncertainty will continuebecause greater LNG imports will strengthen the linkage to volatile global gas and energymarkets.One of the largest issues emerging from governmental policy and regulatory initiatives is how toplan given an eventual, but highly uncertain, climate change regulatory regime. Not only havethere been significant policy developments for currently-regulated pollutants, but there have alsobeen important state-level climate change regulatory initiatives. Other regulatory issues includestate renewable portfolio standards, hydropower relicensing, and major relevant provisions of theEnergy Policy Act of 2005.In conjunction with resource planning efforts, <strong>PacifiCorp</strong> has a greenhouse gas mitigation strategythat includes a public working group to consider emission reduction best practices, carbondioxide scenario analysis for the IRP and procurement programs, renewable generation and demand-sidemanagement resource acquisition plans, and emissions accounting.Transmission constraints, and the ability to address them in a timely manner, represent importantplanning considerations for ensuring that peak load obligations are met on a reliable basis. Variousregional transmission planning processes in the Western Interconnection have developedover the last several years to serve as the primary forums where major transmission projects aredeveloped and coordinated. <strong>PacifiCorp</strong> is engaged in a number of these planning initiatives.The Energy Policy Act of 2005, the first major energy law enacted in more than a decade, includesnumerous provisions impacting electric utilities. Key provisions include (1) the promotionof clean coal technology, renewable energy, and nuclear power, (2) the encouragement of morehydroelectric production through streamlined relicensing procedures and increased efficiency,(3) the use of time-based metering options, and (4) the provision of mandatory reliability standards.<strong>PacifiCorp</strong>’s recent resource procurement activities include requests for proposal for east-sidebase load resources and renewable resources. In addition, requests for proposals have been issuedfor demand-side resource programs.2
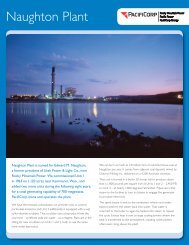
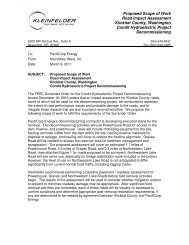
<strong>PacifiCorp</strong> – <strong>2007</strong> IRPChapter 1 – Executive Summary<strong>PacifiCorp</strong>’s planning process is further impacted by the rapid evolution of state-specific resourcepolicies that place, or are expected to place, constraints on <strong>PacifiCorp</strong>’s resource selectiondecisions, and disparate state interests that complicate the company’s ability to address state IRPrequirements to the satisfaction of all stakeholders.RESOURCE NEEDS ASSESSMENTThe total net control area load forecast used in this IRP reflects <strong>PacifiCorp</strong>’s forecasts of loadsgrowing at an average rate of 2.4 percent annually from <strong>2007</strong> to 2016, which is slightly fasterthan the average annual historical growth rate (See Table 1.1). The eastern portion of the Pacifi-Corp system continues to grow faster than the western system, with an average annual energygrowth rate of 3.2 percent and 0.8 percent, respectively, over the forecast horizon.Table 1.1 – Historical and Forecasted Average Energy Growth Rates for LoadAverage AnnualGrowth Rate Total OR WA WY CA UT ID1995-2005 1.6% 0.1% 1.4% 1.4% 1.3% 3.0% 1.3%<strong>2007</strong>-2016 2.4% 0.6% 1.3% 5.6% 1.1% 2.7% 1.0%On both a capacity and energy basis, load and resource balances are calculated using existingresource levels, obligations and reserve requirements. Based on load and resource balance calculations,the company projects a summer peak resource deficit for the <strong>PacifiCorp</strong> system beginningin 2008 to 2010, depending on the capacity planning reserve margin assumed. Table 1.2shows the annual capacity position (megawatt resource surplus or deficit) for the system using a12 percent and 15 percent planning reserve margin, while Figure 1.1 shows the correspondingannual resource and obligation levels.Table 1.2 – Capacity System Position for 12% and 15% <strong>Plan</strong>ning Reserve MarginSystemPosition (MW) <strong>2007</strong> 2008 2009 2010 2011 2012 2013 2014 2015 201612% PRM 665 113 73 (791) (1,038) (2,446) (2,563) (2,794) (2,842) (3,171)15% PRM 415 (147) (188) (1,073) (1,327) (2,768) (2,890) (3,126) (3,176) (3,513)The <strong>PacifiCorp</strong> deficits prior to 2011 to 2012 will be met by additional renewables, demand-sideprograms, and market purchases. The company will consider other options during this timeframe if they are cost-effective and provide other system benefits. This could include accelerationof a natural gas plant to complement the accelerated and expanded acquisition of renewablewind facilities. On an average annual energy basis, the system becomes deficient beginning in2009 (Figure 1.2), based on a 12 percent planning reserve margin. To address these wideningdeficits in a cost-effective and risk-informed manner, a mix of resource types is anticipated.3
<strong>PacifiCorp</strong> – <strong>2007</strong> IRPChapter 1 – Executive SummaryFigure 1.1 – System Capacity Chart14,000Obligation + Reserves (15%)12,000Obligation + Reserves (12%)10,000MW8,0006,000Existing <strong>Resource</strong>s4,0002,0000<strong>2007</strong> 2008 2009 2010 2011 2012 2013 2014 2015 2016Figure 1.2 – Monthly and Annual Average Energy Balance2,0001,5001,000500MWa0(500)(1,000)(1,500)(2,000)(2,500)(3,000)Annual BalanceMonthly BalanceJan-07Apr-07Jul-07Oct-07Jan-08Apr-08Jul-08Oct-08Jan-09Apr-09Jul-09Oct-09Jan-10Apr-10Jul-10Oct-10Jan-11Apr-11Jul-11Oct-11Jan-12Apr-12Jul-12Oct-12Jan-13Apr-13Jul-13Oct-13Jan-14Apr-14Jul-14Oct-14Jan-15Apr-15Jul-15Oct-15Jan-16Apr-16Jul-16Oct-16(3,500)4
<strong>PacifiCorp</strong> – <strong>2007</strong> IRPChapter 1 – Executive SummaryRESOURCE OPTIONSThe company developed cost and performance profiles for supply-side resources, demand-sidemanagement programs, transmission expansion projects, and firm market purchases (front officetransactions) for use in portfolio modeling. Each supply-side option also included the estimationand use of capital cost ranges for each supply-side option. These cost ranges reflect cost uncertainty,and their use in this plan acknowledges the significant construction cost increases that areoccurring.<strong>PacifiCorp</strong> used the Electric Power Research Institute’s Technical Assessment Guide (TAG®),along with recent project experience and consultant studies, to develop its supply-side resourceoptions. The purpose of using TAG data is to rely on consistently-derived cost estimates from awell-respected independent outside source. The TAG database is considered the default sourcefor developing the supply-side resource alternatives used in the <strong>2007</strong> IRP. Values are adjusted asnecessary using information from <strong>PacifiCorp</strong> or other sources that reflects corporate or locationspecificconsiderations. TAG capital costs for certain technologies were adjusted to be more inline with <strong>PacifiCorp</strong>’s recent cost studies and project experience. In addition, TAG emissionestimates were adjusted based on permitting expectations in <strong>PacifiCorp</strong>’s service territory. Theuse of TAG information is new to <strong>PacifiCorp</strong>’s integrated resource planning process.The company also developed transmission resources to support meeting loads with new generationoptions, to integrate wind, to enhance transfer capability and maintain reliability across<strong>PacifiCorp</strong>’s system, and to boost import/export capability with respect to external markets.These transmission resources were entered as options in <strong>PacifiCorp</strong>’s capacity expansion optimizationtool, and were thus allowed to compete directly with other resources for inclusion in portfolios.MODELING AND RISK ANALYSIS APPROACHThe IRP modeling effort seeks to determine the comparative cost, risk, supply reliability, andemissions attributes of resource portfolios.<strong>PacifiCorp</strong> used two modeling tools for portfolio analysis: the Capacity Expansion Module(CEM) and the <strong>Plan</strong>ning and Risk (PaR) Module. The CEM performs a deterministic least-costoptimization with resource options over the twenty-year study period. The CEM operates byminimizing for each year the operating costs for existing resources subject to system load balance,reliability and other constraints. Over the study period, it also optimizes resource additionssubject to resource investment and capacity constraints (monthly peak loads plus a planning reservemargin for a 24-zone model topology). The PaR module is a chronological commitment/dispatchproduction cost model that was operated in probabilistic (stochastic) mode to developrisk-adjusted portfolio performance measures.The <strong>2007</strong> IRP modeling effort consisted of resource screening, risk analysis portfolio development,and detailed production cost and stochastic risk analysis. For resource screening, the companyused the CEM to evaluate generation, load control, price-responsive demand-side management,market purchases, and transmission resources on a comparable basis with the use of “alter-5
<strong>PacifiCorp</strong> – <strong>2007</strong> IRPChapter 1 – Executive Summarynative future” scenarios. The main purpose of these scenarios is to identify general resource patternsattributable to changes in assumptions, and to help identify robust resources—those thatfrequently appear in the model’s optimized portfolios under a range of futures. <strong>PacifiCorp</strong> soughtassistance from public stakeholders to construct the alternative future scenarios, which capturevariations in potential CO 2 regulatory costs, natural gas prices, wholesale electricity prices, retailload growth, and the scope of renewable portfolio standards.Using the results from the alternative future scenario studies, <strong>PacifiCorp</strong> defined risk analysisportfolios for stochastic simulation. The CEM was used to help build fixed resource investmentschedules for wind and distributed resources, and to optimize the selection of other resource optionsaccording to specific resource strategies. Other key portfolio development criteria includeddiversity among the major new resource types and the impact of evolving state resource policies.The resulting portfolios were then simulated using the PaR model. The PaR simulations incorporatestochastic risk in its production cost estimates by using Monte Carlo random sampling offive stochastic variables: loads, commodity natural gas prices, wholesale power prices, hydroenergy availability, and thermal unit availability.<strong>PacifiCorp</strong> devoted considerable effort to model the effect of CO 2 emission compliance strategies.Stochastic simulations were conducted with various CO 2 emission cost adders to capturethe risks associated with potential CO 2 emission compliance regulations. Since the probability ofrealizing a specific CO 2 emissions cost cannot be determined with a reasonable degree of accuracy,potential CO 2 emission costs were treated as a scenario risk in this IRP. <strong>PacifiCorp</strong> definesa scenario risk as an externally-driven fundamental and persistent change to the expected valueof some parameter that is expected to significantly impact portfolio costs. This risk category isintended to embrace abrupt changes to risk factors that are not amenable to stochastic analysis.The practice of combining stochastic simulation with CO 2 cost adder scenario analysis representsadvancement with respect to the modeling approach used for <strong>PacifiCorp</strong>’s 2004 IRP.All risk analysis portfolios were simulated with five CO 2 adder levels—$0/ton, $8/ton, $15/ton,$38/ton, and $61/ton (in 2008 dollars)—and associated forward gas/electricity price forecasts.The company modeled both a cap-and-trade and emissions tax compliance strategy, and expandedits reporting of CO 2 emissions impacts.Portfolio performance was assessed with the following measures: (1) stochastic mean cost (PresentValue of Revenue Requirements), (2) customer rate impact, measured as the levelized netpresent value of the change in the system average customer price due to new resources for <strong>2007</strong>through 2026, (3) emissions externality cost, (4) capital cost, (5) risk exposure, (6) CO 2 and otheremissions, (7) and supply reliability statistics.The preferred portfolio is selected from among the risk analysis portfolios primarily on the basisof relative cost-effectiveness, customer rate impact, and cost/risk balance across the CO 2 adderlevels. The preferred portfolio represents the most robust resource plan under a reasonably widerange of potential futures.6
<strong>PacifiCorp</strong> – <strong>2007</strong> IRPChapter 1 – Executive SummaryMODELING AND PORTFOLIO SELECTION RESULTS<strong>PacifiCorp</strong> assessed “alternative future” scenarios to determine resources and capacity quantitiessuitable for inclusion in risk analysis portfolios. Based on the Capacity Expansion Module’s optimizedinvestment plans, the company selected wind (as a proxy for all renewable resources),combined heat and power, supercritical pulverized coal, combined cycle combustion turbine,single-cycle combustion turbine, integrated gasification combined cycle (IGCC), load controlprograms, transmission additions and short-term market purchases in subsequent portfolio studies.The company studied portfolios using its stochastic production cost simulation model. Theseportfolios were distinguished by a variety of resource strategies intended to address major portfoliorisks, such as carbon regulations and natural gas/electricity price volatility. These resourcestrategies were distinguished by the planning reserve margin level and the quantity and timing ofwind, pulverized coal, front office transactions, and IGCC resources included.The portfolio analysis yielded the following general conclusions:• Diversification of resources helps to balance costs and risks. A combination of supercriticalpulverized coal, additional renewable generation, and gas-fired resources is desired toachieve a low-cost portfolio that effectively addresses all major sources of risk; conversely,portfolios dominated by a single resource type were found to be more expensive and risky forcustomers. Studies also demonstrated that increasing wind capacity and reducing reliance onmarket purchases promotes a better balance of portfolio cost and risk.• Eliminating front office transactions after 2011 decreased risk exposure and increased portfoliocost. To maintain planning flexibility and resource diversity, <strong>PacifiCorp</strong> will continue torely on them as needed to support energy requirements in the west control area, and use themas needed to address peak load requirements in the east control area.• While the portfolio analysis indicated that lowering the planning reserve margin increasedportfolio stochastic risk and reduced reliability, the decision on what margin to adopt is asubjective one that depends on balancing portfolio risk against affordability. The portfoliomodeling also showed that reducing the planning reserve margin from 15% to 12% increasedCO 2 and other emissions due to greater reliance on the company’s existing coal fleet.Based on superior performance with respect to stochastic cost, customer rate impact, cost-versusriskbalance, and supply reliability, a portfolio with the following characteristics was chosen asthe preferred portfolio:• A total of 2,000 megawatts of renewable resources by 2013• An additional 100 megawatts of load control (Class 1 demand-side management) beginningin 2010• A west-side combined cycle combustion turbine in 2011• High-capacity-factor resources in the east in 2012 and 2014• East-side combined cycle combustion turbines in 2012 and 2016• Balance of system need fulfilled by front office transactions beginning in 2010• Transmission additions between 2010 and 2014 to support integration of the resource portfoliowith loads7
<strong>PacifiCorp</strong> – <strong>2007</strong> IRPChapter 1 – Executive SummaryThe preferred portfolio’s specific proxy resources and acquisition timing are shown in Table 1.3.Table 1.3 – <strong>PacifiCorp</strong>’s <strong>2007</strong> IRP Preferred PortfolioSupply and Demand-side Proxy <strong>Resource</strong>sNameplate Capacity, MW<strong>Resource</strong> Type <strong>2007</strong> 2008 2009 2010 2011 2012 2013 2014 2015 2016East Utah pulverized coal Supercritical 340Wyoming pulverized coal Supercritical 527Combined cycle CT 2x1 F class with duct firing 548Combined cycle CT 1x1 G class with duct firing 357Combined Heat and Power Generic east-wide 25Renewable Wind, Wyoming 200 200 200 <strong>30</strong>0Class 1 DSM* Load control, Sch. irrigation 26 25 18Front office transactions** Heavy Load Hour, 3rd Qtr - - - 393 272 97 3 149 192 165West CCCT 2x1 F Type with duct firing 602Combined Heat and Power Generic west-wide 75Renewable Wind, SE Washington <strong>30</strong>0 100Renewable Wind, NC Oregon 100 100 100Class 1 DSM* Load control, Sch. irrigation 12 11 12Front office transactions** Flat annual product - - - 219 64 555 657 247 246 249Annual Additions, Long Term <strong>Resource</strong>s <strong>30</strong>0 <strong>30</strong>0 100 312 839 1,125 318 527 - 357Annual Additions, Short Term <strong>Resource</strong>s - - - 612 336 652 660 396 438 414Total Annual Additions <strong>30</strong>0 <strong>30</strong>0 100 924 1,175 1,777 978 923 438 771* DSM is scaled up by 10% to account for avoided line losses.** Front office transaction amounts reflect purchases made for the year, and are not additive.Transmission Proxy <strong>Resource</strong>s*Transfer Capability, Megawatts<strong>Resource</strong> <strong>2007</strong> 2008 2009 2010 2011 2012 2013 2014 2015 2016East Path C Upgrade: Borah to Path-C South to Utah North <strong>30</strong>0Utah - Desert Southwest (Includes Mona - Oquirrh) 600Mona - Utah North 400Craig-Hayden to Park City 176Miners - Jim Bridger - Terminal 600Jim Bridger - Terminal 500West Walla Walla - Yakima 400West Main - Walla Walla 6<strong>30</strong>Total Annual Additions - - - 700 6<strong>30</strong> 1,776 - 500 - -* Transmission resource proxies represent a range of possible procurement strategies, including new wheeling contractsor construction of transmission facilities by <strong>PacifiCorp</strong> or as a joint project with other parties.The preferred portfolio reflects a diverse resource mix, as evidenced by the increasing contributionof renewables, gas-fired, and front office transactions to system generation. Figure 1.3 comparesthe system energy mixes for <strong>2007</strong> and 2016, which include preferred portfolio resourcesand reflect the average generation across the five CO 2 cost adders modeled.While the preferred portfolio is based on a target planning reserve margin of 12 percent, Pacifi-Corp is targeting a reserve margin range of 12 to 15 percent to increase planning flexibility givena time of rapid public policy evolution and wide uncertainty over the resulting down-stream costimpacts. The preferred portfolio also is consistent with the company’s strategic view on the roleof firm market purchases for meeting capacity needs: that limited use of such purchases is beneficialby increasing planning flexibility and portfolio diversity, but that the company seeks less8
<strong>PacifiCorp</strong> – <strong>2007</strong> IRPChapter 1 – Executive Summaryreliance on them for the long term. Market availability to support the level of firm purchases inthe preferred portfolio is adequate as evidenced by recent purchase offer activity. For example,requests in <strong>2007</strong> for third-quarter projects for <strong>2007</strong>-2012 yielded over 5,000 megawatts in offers.Figure 1.3 – Projected <strong>PacifiCorp</strong> <strong>Resource</strong> Energy Mix<strong>2007</strong> <strong>Resource</strong> Energy Mix with Preferred Portfolio <strong>Resource</strong>s(Average for five CO2 Adder Cases)Gas-CHP0.0%Hydroelectric9.6%InterruptibleClass 1 DSM0.1%>0.0%Renewable3.6%Gas-SCCT0.2%Gas-CCCT8.5%System Balancing Purchases4.5%Existing Purchases8.7%Pulverized Coal64.8%2016 <strong>Resource</strong> Energy Mix with Preferred Portfolio <strong>Resource</strong>s(Average for five CO2 Adder Cases)Hydroelectric6.9%Interruptible0.1%Renewable8.5%Class 1 DSM>0.0%Gas-CHP0.2%Gas-SCCT0.7%Pulverized Coal43.4%Gas-CCCT17.4%System BalancingPurchases14.2%Front Office Transactions2.9%Existing Purchases5.7%9
<strong>PacifiCorp</strong> – <strong>2007</strong> IRPChapter 1 – Executive SummaryACTION PLANThe integrated resource plan is intended to provide guidance for the company’s resource procurementactivities over the next few years. To follow through on the findings of this resourceplan, <strong>PacifiCorp</strong>’s action plan includes:• Reaffirming commitments to renewable resources:– Accelerate its previous commitment to acquire 1,400 megawatts of cost-effective renewableresources from 2015 to 2010,– Increase the amount of cost-effective renewable resources to 2,000 megawatts by 2013,– Actively seek to add transmission infrastructure to deliver wind power to key load areas.Investigate adding flexible generating resources, such as natural gas, to integrate newwind resources– Enhance its integrated resource planning modeling to address renewable portfolio standardsand the impacts of adding large quantities of wind resources to its system● Increased focus on energy efficiency:– Continue to run programs to acquire 250 average megawatts of cost-effective energy efficiency,and– Add an additional 200 average megawatts of cost-effective energy efficiency initiatives● Maintaining and expanding load control programs:– Maintain and build upon the existing 150 megawatts of irrigation and air conditioningload control in Utah and Idaho,– Add 100 megawatts of additional load control split between East and West beginning in2010,– Leverage voluntary demand-side measures, such as demand buyback, to improve systemreliability during peak load hours, and– Incorporate the results of the demand-side management potentials study into the company’sdemand-side management programs and future integrated resource plans.● Studying and addressing environmental issues:– Enhance its integrated resource planning modeling to address new carbon regulations,and– Take a leadership role in discussions on global climate change and continue to investigatecarbon reduction technologies, including nuclear power.● Addressing transmission constraints:– Expand its transmission system to allow the resources identified in the preferred portfolioto serve customer loads in a cost-effective and reliable manner● Adding a diverse mix of base load / intermediate load resources:– Acquire up to 1,700 megawatts of base load / intermediate load resources on the east sideof its system for the term 2012 through 2014, through a mix of thermal resources andpurchases, consistent with the April <strong>2007</strong> filed request for proposal, and,– Acquire 200 to 1,350 megawatts of base load / intermediate load resources on the westside of its system from 2010 to 2014 through a mix of thermal resources and purchases.10
<strong>PacifiCorp</strong> – <strong>2007</strong> IRPChapter 2 – IRP Components, <strong>Plan</strong>ning Principles,Objectives, and Approach2. IRP COMPONENTS, PLANNING PRINCIPLES, OBJECTIVES, ANDAPPROACHChapter Highlights <strong>PacifiCorp</strong>’s IRP mandate is to assure, on a long-term basis, an adequate and reliable electricitysupply at a reasonable cost and in a manner “consistent with the long-run public interest.” As a multi-objective planning effort, the IRP must reach a balanced position upon consideringseveral priorities and accounting for diverse and sometimes conflicting stakeholderviews. The IRP is a roadmap for <strong>PacifiCorp</strong>’s long-term resource strategy, developed accordingto seven planning principles. One of the principles is that it strategically aligns with businesspriorities and meets MEHC transaction commitments. Key analytical and modeling objectives were to (1) evaluate all resources on a comparablebasis using the company’s new resource expansion optimization tool, and (2) enhance uncertaintyand risk analysis. The outcome of <strong>PacifiCorp</strong>’s portfolio analysis is a preferred portfolio that represents thelowest-cost diversified resource plan that accounts for cost/risk trade-offs, system reliability,ratepayer impacts, and CO 2 emissions. The preferred portfolio is also the most robustresource plan under a reasonably wide range of potential futures. <strong>PacifiCorp</strong> continuously seeks to improve the IRP public process; a number of recent initiativesto enhance stakeholder engagement for this IRP are profiled. <strong>PacifiCorp</strong> summarizes the progress towards meeting 18 MEHC transaction commitmentsthat related to IRP activities.INTRODUCTIONThis chapter outlines the components of this <strong>Integrated</strong> <strong>Resource</strong> <strong>Plan</strong> (IRP), and describes thegroundwork for its development: the set of planning principles and analysis objectives that underpinthe IRP development effort, and the overall approach for building it.This IRP builds on <strong>PacifiCorp</strong>’s prior resource planning efforts and reflects significant advancementsin portfolio modeling and risk analysis. It was developed in a collaborative public processwith involvement from regulatory staff, advocacy groups, and other interested parties. <strong>PacifiCorp</strong>is filing this IRP with its state regulatory agencies, and requests that they acknowledge and supportits conclusions, including the Action <strong>Plan</strong>.11
<strong>PacifiCorp</strong> – <strong>2007</strong> IRPChapter 2 – IRP Components, <strong>Plan</strong>ning Principles,Objectives, and Approach<strong>2007</strong> INTEGRATED RESOURCE PLAN COMPONENTSThe basic components of <strong>PacifiCorp</strong>’s <strong>2007</strong> IRP, and where they are addressed in this report, areoutlined below.● The set of IRP principles and objectives that the company adopted for this IRP effort, as wellas a discussion on customer/investor risk allocation (this chapter)● An assessment of the planning environment, including market trends and fundamentals, legislativeand regulatory developments, and current procurement activities (Chapter 3)● A resource needs assessment covering the company’s load forecast, status of existing resources,resource expansion alternatives, and determination of the load and energy positionsfor the 10-year resource acquisition period (Chapter 4)● Profiles and background information for the resource options considered for addressing futurecapacity deficits (Chapter 5)● A description of the IRP modeling and risk analysis approach (Chapter 6)● A summary of modeling results and <strong>PacifiCorp</strong>’s preferred portfolio (Chapter 7)● An action plan linking the company’s preferred portfolio with specific implementation actions(Chapter 8)The IRP appendices, included as a separate volume, comprise base modeling assumptions, supportingtechnical information, detailed Capacity Expansion Module (CEM) modeling results,supplementary portfolio information, studies intended to meet certain state commission IRP acknowledgementrequirements, and status reports on IRP regulatory compliance and action planprogress. <strong>PacifiCorp</strong>’s response to written comments on the draft IRP report is incorporated inAppendix F.THE ROLE OF PACIFICORP’S INTEGRATED RESOURCE PLANNING<strong>PacifiCorp</strong>’s IRP mandate is to assure, on a long-term basis, an adequate and reliable electricitysupply at a reasonable cost and in a manner “consistent with the long-run public interest.” 1 Themain role of the IRP is to serve as a roadmap for determining and implementing the company’slong-term resource strategy according to this IRP mandate. In doing so, it accounts for statecommission IRP requirements, the current view of the planning environment, corporate businessgoals, risk, and uncertainty. As a business planning tool, it supports informed decision-makingon resource procurement by providing an analytical framework for assessing resource investment1 The Oregon and Utah Commissions cite “long run public interest” as part of their definition of integrated resourceplanning. Public interest pertains to adequately quantifying and capturing for resource evaluation any resource costsexternal to the utility and its ratepayers. For example, the Utah Commission cites the risk of future internalization ofenvironmental costs as a public interest issue that should be factored into the resource portfolio decisionmakingprocess.12
<strong>PacifiCorp</strong> – <strong>2007</strong> IRPChapter 2 – IRP Components, <strong>Plan</strong>ning Principles,Objectives, and Approachtradeoffs. As an external communications tool, the IRP engages numerous stakeholders in theplanning process and guides them through the key decision points leading to <strong>PacifiCorp</strong>’s preferredportfolio of generation, demand-side, and transmission resources.Given this role and the long-term planning focus, it is important to note the qualifications associatedwith the IRP so that the planning outcome can be placed in the proper context. First, resourceportfolio analysis seeks to help clarify the unknown future as opposed to predicting it.Consequently, the emphasis of the IRP is to determine the most robust resource plan under areasonably wide range of potential futures as opposed to the optimal plan for some expectedview of the future. In tandem with the robustness concept is the view that selection of the preferredportfolio should not be overly influenced by any particular set of quantitative results giventhe complexity and inherent imprecision of the modeling effort. In other words, modeling is intendedto support and not overshadow the expert judgment of <strong>PacifiCorp</strong>’s decision-makers.A second IRP qualification is that the preferred portfolio is not meant to be a static planningproduct, but rather is expected to evolve as part of the ongoing planning process. As resourcesare acquired and new planning information comes in, the company refreshes the preferred portfolioand action plan based on the set of planning principles enumerated below. Because the IRP isa road mapping effort, it is not intended as a referendum on specific resource decisions. The preferredportfolio represents a snapshot view of <strong>PacifiCorp</strong>’s long-term resource planning strategyinformed by current information. As emphasized in this IRP and prior ones, specific resourceacquisition decisions stem from <strong>PacifiCorp</strong>’s competitive procurement process.A third qualification is that as a multi-objective planning effort, the IRP must reach a balancedposition upon considering several priorities and accounting for diverse and sometimes conflictingstakeholder views. In short, the IRP cannot be all things to all people. As the owner of theIRP, <strong>PacifiCorp</strong> is uniquely positioned to determine the resource plan that best accomplishes IRPobjectives on a system-wide basis, thereby meeting customer and investor obligations collectively.PLANNING PRINCIPLES<strong>PacifiCorp</strong> subscribed to a number of planning principles that guided the overall IRP developmenteffort and resource decision-making process.● Development of the IRP is guided by the state commission rules and guidelines for integratedresource planning, as well as specific IRP process and analysis requirements arising fromstate commission acknowledgement proceedings. At the same time, the company conductedits IRP process with the understanding that commission IRP rules and acknowledgement proceedingsare not intended to usurp its decision-making authority for resource acquisition.● <strong>PacifiCorp</strong> continues to plan on a system-wide basis. However, newly enacted state energyand environment policy mandates (and those under consideration) present considerable challengesfor planning on this basis. This IRP considers such state mandates as part of the portfoliodevelopment and analysis process, acknowledging that the definition of an “optimal”portfolio must be extended to accommodate sometimes disparate state policy goals.13
<strong>PacifiCorp</strong> – <strong>2007</strong> IRPChapter 2 – IRP Components, <strong>Plan</strong>ning Principles,Objectives, and Approach● With portfolio costs increasing due to rapid construction price increases and the move towardsmore expensive alternative technologies to meet new state resource acquisition policies,<strong>PacifiCorp</strong> is more mindful of rate impact considerations for this IRP.● The IRP and associated action plan was developed with <strong>PacifiCorp</strong> and MidAmerican EnergyHolding Company (MEHC) business principles in mind, and meets MEHC transactioncommitments. The business principles that relate to long-term resource planning include (1)improving electricity system reliability, (2) investing in physical assets that bolster corporatestrength and competitiveness, and (3) protecting the environment in a cost-effective manner.● The company subscribes to a portfolio management approach for acquiring resources to meetits future load obligations. It seeks a diversified, low-cost mix of resources that minimizesprice and environmental risk for its customers while enhancing value for its investors.● <strong>PacifiCorp</strong> continues to plan using the proxy resource approach, whereby resource optionsincluded in the IRP models are constituted with generic cost and performance attributes andassume <strong>PacifiCorp</strong> ownership for supply-side alternatives to simplify the analysis. (Some adjustmentsare made to resource attributes to reflect corporate experience or location-specificconsiderations, such as elevation for gas-fired resources.) With this proxy approach, modeledresources are only indicative of the resources that might be procured, the specific attributesof which may be modified to account for conditions at procurement time. Wind was selectedas the proxy resource for all renewables based on wide availability in <strong>PacifiCorp</strong>’sservice territory, relative cost-effectiveness and cost certainty, and technological maturity. Inthe case of modeled transmission options, these are proxies representing a range of procurementstrategies, including new wheeling contracts or construction of transmission facilitiesby <strong>PacifiCorp</strong> or as joint projects with other parties.● <strong>PacifiCorp</strong> believes that CO 2 regulation will come into play during the 10-year resource acquisitionperiod that is the focus of this IRP (<strong>2007</strong> through 2016). Potential carbon dioxideemission costs serve as a major source of portfolio risk that is addressed through scenarioanalysis and balancing this risk against others. <strong>PacifiCorp</strong> also believes that given the state ofknowledge concerning prospective CO 2 regulations, it is prudent to not assign probabilities tospecific CO 2 cost outcomes as part of portfolio risk analysis.● The company continues to seek improvements in the stakeholder engagement process andenhance the level of transparency of the overall process.KEY ANALYTICAL AND MODELING OBJECTIVESThe main analytical objective of the IRP is to determine the preferred resource portfolio for thenext ten years (<strong>2007</strong>-2016) based on a finding of need and a comparative assessment of availableresource opportunities. The preferred portfolio represents the resource plan that has the best balanceof cost and risk.14
<strong>PacifiCorp</strong> – <strong>2007</strong> IRPChapter 2 – IRP Components, <strong>Plan</strong>ning Principles,Objectives, and ApproachA key analytical objective for this IRP was to treat all resource options on a comparable basiswhen developing alternative portfolios. To that end, <strong>PacifiCorp</strong> added a resource expansion optimizationtool (the Capacity Expansion Module, or CEM) into its portfolio modeling framework.This model performs automated economic screening of resources and determines the optimalresource expansion plan based on planning scenarios. This tool enabled thermal generation,renewable generation, market purchases, demand-side management, and transmission to competeagainst each other on the basis of their impact on Present Value of Revenue Requirements(PVRR), the key measure of a portfolio’s performance.Important caveats associated with the CEM are that it does not capture stochastic risks in its optimizationalgorithm, and that it is designed as a high-level screening tool. In contrast to the<strong>Plan</strong>ning and Risk Module (PaR)—<strong>PacifiCorp</strong>’s detailed production costing and market simulationmodel, the CEM cannot incorporate stochastic variables in its solution algorithm and is insteadmeant to address high-level system operational details. (For example, unlike the PaR, itdoes not capture hourly chronological commitment constraints). Consequently, a modeling objectivefor this IRP was to exploit the complementary but different capabilities of the CEM andPaR. Chapter 6 describes the roles that each of these models played throughout <strong>PacifiCorp</strong>’s resourceportfolio analysis.An additional analytical and modeling objective for this IRP was to enhance uncertainty and riskanalysis. <strong>PacifiCorp</strong> accomplished this objective by making the following data and modelingmethodology changes, which are detailed later in this report.● Incorporated stochastic simulation of candidate portfolios at various CO 2 adder levels, incontrast to running deterministic simulations with CO 2 adder levels independently as wasdone for the 2004 IRP.● Introduced stochastic analysis of front office transactions (market purchases), which includescomparing stochastic risk measures of a portfolio with front office transaction resourcesagainst a portfolio in which these resources are replaced with an asset-based coal plant.● Development of low and high capital cost estimates for supply-side resources in recognitionof increased construction cost volatility trends.● Extensive expansion of the number of input sensitivity studies relative to the 2004 IRP, including36 studies using the CEM and 27 stochastic studies using PaR.● Incorporated probability-weighted forward gas price curves into the IRP models; the curvesare based on a weighted average of PIRA Energy’s low, medium, and high gas price cases.A final analytical objective for this IRP was to determine an appropriate level of reliance onmarket purchases given their flexibility benefits and risks. As opposed to the 2004 IRP, wheremarket purchases were treated as a fixed resource, for this IRP they were handled as a competingresource option with associated prices modeled as stochastic variables to capture price risk.15
<strong>PacifiCorp</strong> – <strong>2007</strong> IRPChapter 2 – IRP Components, <strong>Plan</strong>ning Principles,Objectives, and ApproachINTEGRATED RESOURCE PLANNING APPROACH OVERVIEWThe <strong>2007</strong> IRP approach consisted of both analytical and public processes that occurred in tandem.These two processes are described below.Analytical ProcessThe analytical process is comprised of nine major steps that are summarized in Figure 2.1. Chapter3 addresses Step 1, “review the planning environment”. Step 2, “update inputs and assumptions”,is covered largely in Appendices A and J. Chapter 4 covers Step 3, “develop load andresource balance”. Step 4, “define candidate resource list” is treated in Chapter 5. Steps 5through 8, which address the modeling and risk analysis process and results, are covered inChapters 6 and 7.Figure 2.1 – <strong>Integrated</strong> <strong>Resource</strong> <strong>Plan</strong>ning Analytical Process Steps1. Review planning environment2. Update inputs and assumptions3. Develop load and resource balance toidentify annual capacity/energy positions4. Define candidate resource list,including transmission projects5. Develop planning and sensitivity analysis scenarios; use the capacity expansionoptimization tool (CEM) to determine the optimal portfolio for each scenario thateliminates annual capacity deficits according to capacity reserve margin requirements6. Use planning scenario results to help determine a diversifiedresource mix that is robust across the range of alternative futures7. Create risk analysis portfolios based on alternative strategies for managingportfolio risks that can be differentiated through stochastic (Monte Carlo) simulation8. Model risk analysis portfolios using stochastic simulations9. Select a preferred portfolio using evaluation criteria:Cost, risk, system reliability, ratepayer impact, CO 2 emissionsAs shown in the diagram, the outcome of the analytical process is a preferred portfolio thatrepresents the lowest-cost diversified resource plan that accounts for cost, risk, system reliability,ratepayer impacts, and CO 2 emissions.16
<strong>PacifiCorp</strong> – <strong>2007</strong> IRPChapter 2 – IRP Components, <strong>Plan</strong>ning Principles,Objectives, and ApproachPublic ProcessThe core of the <strong>2007</strong> IRP public process was a series of 13 public meetings designed to facilitateinformation sharing, collaboration, and expectations setting for the IRP. The topics covered allfacets of the IRP process, ranging from specific input assumptions to the portfolio modeling andrisk analysis strategies employed.<strong>PacifiCorp</strong> held three of the meetings in 2005—two load forecasting workshops (August 3 andOctober 5) and a <strong>2007</strong> IRP kick-off meeting on December 7. Table 2.1 shows the timeline of thepublic meetings in relation to the overall IRP timeline, commencing with the December 7 IRPkick-off meeting. Appendix F, in the separate appendix volume, provides more details concerningthe public meeting process and individual meetings. Stakeholder engagement efforts arechronicled in the last section of this chapter.Table 2.1 – IRP and Public Process TimelineAug-05 Sept-05 Oct-05 Nov-05 Dec-05 Jan-06 Feb-06 Mar-06 Apr-06 <strong>May</strong>-06 Jun-06IRP TimelinePrepare IRP Assumptions and ModelsPublic Meetings1 Technical Workshop - Load Forecasting, August 3, 2005 X2 Technical Workshop - Load Forecasting, October 5, 2005 X3 General Public Input Meeting, December 7, 2006 X4 Technical Workshop - Renewables, Jan 13, 2006 X5 Technical Workshop - Load Forecasting, Jan. 24, 2006 X6 Technical Workshop - DSM, Feb 10, 2006 X7 General Public Meeting, April 20, 2006 X8 General Public Meeting, <strong>May</strong> 10, 2006 X9 General Public Meeting, June 7, 2006 X10 General Public Meeting, August 23, 200611 General Public Meeting, October 31, 200612 General Public Meeting, February 1, <strong>2007</strong>13 General Public Meeting, April 18, <strong>2007</strong>IRP TimelineJul-06 Aug-06 Sep-06 Oct-06 Nov-06 Dec-06 Jan-07 Feb-07 Mar-07 Apr-07 <strong>May</strong>-07Conduct Analysis / Prepare IRP ReportFile1 Technical Workshop - Load Forecasting, August 3, 20052 Technical Workshop - Load Forecasting, October 5, 20053 General Public Input Meeting, December 7, 20064 Technical Workshop - Renewables, Jan 13, 20065 Technical Workshop - Load Forecasting, Jan. 24, 20066 Technical Workshop - DSM, Feb 10, 20067 General Public Meeting, April 20, 20068 General Public Meeting, <strong>May</strong> 10, 20069 General Public Meeting, June 7, 200610 General Public Meeting, August 23, 2006 X11 General Public Meeting, October 31, 2006 X12 General Public Meeting, February 1, <strong>2007</strong> X13 General Public Meeting, April 18, <strong>2007</strong> X XIn addition to the public meetings, <strong>PacifiCorp</strong> used other channels to facilitate resource planningrelatedinformation sharing and consultation throughout the IRP process. The company maintainsa website (http://www.pacificorp.com/Navigation/Navigation23807.html), e-mail “mailbox”(irp@pacificorp.com), and a dedicated IRP phone line (503-813-5245) to support stakeholdercommunications and address inquiries by public participants.17
<strong>PacifiCorp</strong> – <strong>2007</strong> IRPChapter 2 – IRP Components, <strong>Plan</strong>ning Principles,Objectives, and Approach<strong>PacifiCorp</strong> and its parent company, MidAmerican Energy Holdings Company (MEHC), alsoparticipated in numerous organizations and working groups that address regional planning issuesin the areas of supply, system coordination, energy management, and transmission resources.Table 2.2 lists a number of these organizations by focus area.Table 2.2 – Participation in Regional <strong>Plan</strong>ning Organizations and Working GroupsOrganizationWestern Electricity Coordinating Council/Seams Steering Group– Western Interconnection (SSG-WI)Northwest Power PoolNorthwest Power and Conservation CouncilPacific Northwest Utilities Conference Committee (PNUCC)Northwest Wind Integration Technical WorkgroupBig Sky Carbon Sequestration Partnership Energy Future CoalitionGlobal Climate Change Working Group (MEHC commitment)<strong>Integrated</strong> Gasification Combined Cycle Working Group (MEHCcommitment)Northwest Energy Efficiency AllianceConservation Advisory Council (Energy Trust of Oregon)Utah DSM Advisory GroupWashington DSM Advisory GroupNorthwest Transmission Assessment Committee (NTAC)Rocky Mountain Area Transmission Study (RMATS)Northern Tier Transmission Group (NTTG)Western Regional Transmission Expansion PartnershipEly Energy Center / Robinson Summit – Harry Allen 500 kVTransmission Project Regional <strong>Plan</strong>ning Review GroupUtah <strong>Resource</strong> ForumFocus AreaSystem reliability and adequacySystem reliability and adequacyRegional power systemRegional power systemWindClimate changeClimate changeClean coal technologyEnergy efficiencyEnergy efficiencyEnergy efficiencyEnergy efficiencyTransmissionTransmissionTransmissionTransmissionTransmissionPeak power demand issuesFinally, <strong>PacifiCorp</strong> provided IRP participants the opportunity to critique the draft IRP documentin April <strong>2007</strong>.STAKEHOLDER ENGAGEMENT<strong>PacifiCorp</strong> maintains a strong commitment to improve the value of the IRP public process toexternal stakeholders as well as the company. This is evidenced by a number of initiatives takenby <strong>PacifiCorp</strong> during 2005 and 2006. First, <strong>PacifiCorp</strong> instituted a stakeholder satisfaction surveyin the spring of 2005. The purpose of this survey was to determine if the company was onthe right track with respect to execution of the IRP public process, and to solicit recommendationson improvements to better support stakeholder needs. 2 <strong>PacifiCorp</strong> implemented severalrecommendations for the <strong>2007</strong> IRP, as detailed in Table 2.3.2 A presentation summarizing the survey results can be found on <strong>PacifiCorp</strong>’s Web site. The link to the presentationis http://www.pacificorp.com/File/File52811.pdf.18
<strong>PacifiCorp</strong> – <strong>2007</strong> IRPChapter 2 – IRP Components, <strong>Plan</strong>ning Principles,Objectives, and ApproachTable 2.3 – Public Process Recommendations Implemented for the <strong>2007</strong> IRPPublic Process RecommendationDistribute model run results during thecourse of the IRP modeling phase ratherthan waiting to distribute them at the publicmeetings.Distribute appendices for review alongwith the main draft IRP document.Work to ensure that the participant base ismore evenly balanced as far as representationis concerned; issue personal invitationsto stakeholders as necessary.Send information out earlier to prepare formeetings.Outcome<strong>PacifiCorp</strong> distributed via e-mail a document packageto participants on October 4, 2006 with updatedCEM modeling results and other documentation,including an updated paper that describes the planningscenarios and associated input assumptions.The company also distributed a paper on candidateportfolio development on October 12, 2006 andFebruary 5, <strong>2007</strong>.<strong>PacifiCorp</strong> distributed for review the draft appendicesto support the review of the main document.<strong>PacifiCorp</strong> expanded its meeting invitation andcontact list from about 80 individuals for the 2004IRP to 135 for the <strong>2007</strong> IRP. <strong>PacifiCorp</strong> also addeda video-conference site in Cheyenne, Wyoming, tofacilitate meeting attendance. This list expansionalso encompasses IRP meeting invitations to MEHCtransaction stakeholders per Commitment #48, describedin the next section.<strong>PacifiCorp</strong> maintains a policy of distributing meetinghandouts at least two days in advance of a meeting.Exceptions may occur due to the need for lastminutemanagement reviews of meeting materials.Only one of the 13 public meetings was impacted inthis way.Another <strong>PacifiCorp</strong> initiative was to front-load public meetings during the <strong>2007</strong> IRP scheduleand to focus those meetings on the more contentious, technical, or complex issues. This meetingplan was prompted by the company’s concern during the 2004 IRP process that critical stakeholderinput was provided well after the point where recommendations and concerns could beeasily addressed in the process. Based on the outcome of these meetings, the company found thefront-loading approach beneficial as an early sounding board for its proposed modeling assumptionsand approaches, and intends to build on this approach for the next IRP.MIDAMERICAN ENERGY HOLDINGS COMPANY IRP COMMITMENTSMEHC and <strong>PacifiCorp</strong> committed to continue to produce IRPs according to the schedule andCommission rules and orders at the time the transaction was in process. Other commitmentswere made to (1) encourage stakeholders to participate in the integrated resource planning processand consider transmission upgrades, (2) develop a plan to achieve renewable resource commitments,(3) consider utilization of advanced coal-fuel technology such as IGCC technologywhen adding coal-fueled generation, (4) conduct a market potential study of additional demandsidemanagement and energy efficiency opportunities, (5) evaluate expansion of the BlundellGeothermal resource, and (6) include utility “own/operate” resources as a benchmark in futurerequest for proposals. A detailed description of these commitments and a description of how theyare addressed in the <strong>2007</strong> <strong>Integrated</strong> <strong>Resource</strong> <strong>Plan</strong> are provided in Table 2.4 below.19
<strong>PacifiCorp</strong> – <strong>2007</strong> IRPChapter 2 – IRP Components, <strong>Plan</strong>ning Principles,Objectives, and ApproachTable 2.4 – MidAmerican/<strong>PacifiCorp</strong> Transaction Commitments Addressed in the IRPMEHCCommitmentNumber MEHC Commitment Description<strong>30</strong> <strong>PacifiCorp</strong> will continue to produce <strong>Integrated</strong><strong>Resource</strong> <strong>Plan</strong>s according to the then-currentschedule and the then-current Commission rulesand orders.48 IRP Stakeholder Process: <strong>PacifiCorp</strong> will providepublic notice and an invitation to encouragestakeholders to participate in the <strong>Integrated</strong> <strong>Resource</strong><strong>Plan</strong> (IRP) process. The IRP process willbe used to consider Commitments 34, 39, 40,41, 44, 52 and 53. <strong>PacifiCorp</strong> will hold IRPmeetings at locations or by using communicationstechnologies that encourage broad participation.34 Transmission Investment: MEHC and Pacifi-Corp have identified incremental transmissionprojects that enhance reliability, facilitate the receiptof renewable resources, or enable furthersystem optimization. Subject to permitting andthe availability of materials, equipment andrights-of-way, MEHC and <strong>PacifiCorp</strong> commit touse their best efforts to achieve the followingtransmission system infrastructure improvements:• Path C Upgrade (~$78 million) – IncreasePath C capacity by <strong>30</strong>0 MW (from S.E. Idahoto Northern Utah). The target completion datefor this project is 2010.• Mona - Oquirrh (~$196 million) – Increase theimport capability from Mona into the WasatchFront (from Wasatch Front South to WasatchFront North). This project would enhance theability to import power from new resourcesdelivered at or to Mona, and to import fromSouthern California by “wheeling” over theAdelanto DC tie. The target completion datefor this project is 2011.• Walla Walla - Yakima or Mid-C (~$88 million)– Establish a link between the “WallaWalla bubble” and the “Yakima bubble”How the Commitment is Addressedin the <strong>2007</strong> IRPThis plan complies with variousCommission rules and orders.Public notice for each <strong>Integrated</strong><strong>Resource</strong> <strong>Plan</strong>ning meeting wasprovided to stakeholders. For all<strong>Integrated</strong> <strong>Resource</strong> <strong>Plan</strong>ningmeetings, video conference facilitieswere made available in Portland,Oregon and Salt Lake City,Utah in addition to a telephonelink. Several of the meetings alsoincluded video conference facilitiesin Cheyenne, Wyoming. Considerationof commitments 34, 39, 40,41, 44, 52 and 53 are described below.Each of these three transmissionupgrades has been included in thecompany’s modeling. The Path Cupgrade is included as a plannedtransmission upgrade while theother two projects are options thatcan be selected by the CapacityExpansion Module.20
<strong>PacifiCorp</strong> – <strong>2007</strong> IRPChapter 2 – IRP Components, <strong>Plan</strong>ning Principles,Objectives, and ApproachMEHCCommitmentNumber MEHC Commitment Descriptionand/or reinforce the link between the “WallaWalla bubble” and the Mid-Columbia (at Vantage).Either of these projects presents opportunitiesto enhance <strong>PacifiCorp</strong>’s ability to acceptthe output from wind generators and balancethe system cost effectively in a regionalenvironment. The target completion date forthis project is 2010. (Footnote): It is possiblethat upon further review, a particular investmentmight not be cost-effective, optimal forcustomers or able to be completed by the targetdate. If that should occur, MEHC pledgesto propose an alternative to the Commissionwith a comparable benefit.39 In Commitment 31, MEHC and Pacifi-Corp adopt a commitment to source future<strong>PacifiCorp</strong> generation resources consistent withthe then-current rules and regulations of eachstate. In addition to that commitment, for thenext ten years, MEHC and <strong>PacifiCorp</strong> committhat they will submit as part of any commissionapproved RFPs for resources with a dependablelife greater than 10 years and greater than 100MW—including renewable energy RFPs—a 100MW or more utility “own/operate” alternativefor the particular resource. It is not the intent orobjective that such alternatives be favored overother options. Rather, the option for <strong>PacifiCorp</strong>to own and operate the resource which is thesubject of the RFP will enable comparison andevaluation of that option against other viable alternatives.In addition to providing regulatorsand interested parties with an additional viableoption for assessment, it can be expected thatthis commitment will enhance <strong>PacifiCorp</strong>’s abilityto increase the proportion of cost-effectiverenewable energy in its generation portfolio,based upon the actual experience of MEC andthe “Renewable Energy” commitment offeredbelow.40 MEHC reaffirms <strong>PacifiCorp</strong>’s commitment toacquire 1,400 MW of new cost-effective renewableresources, representing approximately 7%of <strong>PacifiCorp</strong>’s load.MEHC and <strong>PacifiCorp</strong> commit to work with developersand bidders to bring at least 100 MWof cost-effective wind resources in servicewithin one year of the close of the transaction.How the Commitment is Addressedin the <strong>2007</strong> IRPThis commitment is being addressedin the company’s requestfor proposals.This <strong>Integrated</strong> <strong>Resource</strong> <strong>Plan</strong> reflectsthe commitment to acquire1,400 megawatts of new costeffectiverenewable resources. The100 megawatt goal has been met,and the company is within 54megawatts of reaching the 400megawatt goal at the time of this21
<strong>PacifiCorp</strong> – <strong>2007</strong> IRPChapter 2 – IRP Components, <strong>Plan</strong>ning Principles,Objectives, and ApproachMEHCCommitmentNumberMEHC Commitment DescriptionMEHC and <strong>PacifiCorp</strong> expect that the commitmentto build the Walla-Walla and Path Ctransmission lines will facilitate up to 400 MWof renewable resource projects with an expectedin-service date of 2010.MEHC and <strong>PacifiCorp</strong> commit to actively workwith developers to identify other transmissionimprovements that can facilitate the delivery ofcost-effective wind energy in <strong>PacifiCorp</strong>’s servicearea.In addition, MEHC and <strong>PacifiCorp</strong> commit towork constructively with states to implement renewableenergy action plans so as to enable<strong>PacifiCorp</strong> to achieve at least 1,400 MW ofcost-effective renewable energy resources by2015. Such renewable energy resources are notlimited to wind energy resources.41 MEHC supports and affirms <strong>PacifiCorp</strong>’s commitmentto consider utilization of advancedcoal-fuel technology such as super-critical orIGCC technology when adding coal-fueled generation.44 MEHC and <strong>PacifiCorp</strong> commit to conducting acompany-defined third-party market potentialstudy of additional DSM and energy efficiencyopportunities within <strong>PacifiCorp</strong>’s service areas.The objective of the study will be to identifyopportunities not yet identified by the companyand, if and where possible, to recommend programsor actions to pursue those opportunitiesfound to be cost-effective. The study will focuson opportunities for deliverable DSM and energyefficiency resources rather than technicalpotentials that may not be attainable throughDSM and energy efficiency efforts. On-site solarand combined heat and power programs maybe considered in the study. During the threemonthperiod following the close of the transaction,MEHC and <strong>PacifiCorp</strong> will consult withDSM advisory groups and other interested partiesto define the proper scope of the study. Thefindings of the study will be reported back toDSM advisory groups, commission staffs, andother interested stakeholders and will be used bythe Company in helping to direct ongoing DSMHow the Commitment is Addressedin the <strong>2007</strong> IRPreport.The company has included severaltransmission upgrades in <strong>2007</strong> <strong>Integrated</strong><strong>Resource</strong> <strong>Plan</strong>ning analysesthat can facilitate additional renewableresource development. ARenewables Action <strong>Plan</strong> to achieveat least 1,400 megawatts of costeffectiverenewable energy resourceby 2015 was filed concurrentlywith the <strong>2007</strong> IRP.IGCC technology is included as aresource option in the <strong>2007</strong> <strong>Integrated</strong><strong>Resource</strong> <strong>Plan</strong>ning process.Chapter 5 details various clean coalproject activities, including thejoint Wyoming Infrastructure Authority/<strong>PacifiCorp</strong>IGCC project.The demand side management potentialstudy is underway and isexpected to be completed onschedule. The results of the studywill be used to inform future <strong>Integrated</strong><strong>Resource</strong> <strong>Plan</strong>s.22
<strong>PacifiCorp</strong> – <strong>2007</strong> IRPChapter 2 – IRP Components, <strong>Plan</strong>ning Principles,Objectives, and ApproachMEHCCommitmentNumber MEHC Commitment Descriptionand energy efficiency efforts. The study will becompleted within fifteen months after the closingon the transaction, and MEHC shareholderswill absorb the first $1 million of the costs of thestudy.<strong>PacifiCorp</strong> further commits to meeting its portionof the NWPPC’s energy efficiency targetsfor Oregon, Washington and Idaho, as long asthe targets can be achieved in a manner deemedcost-effective by the affected states.In addition, MEHC and <strong>PacifiCorp</strong> commit that<strong>PacifiCorp</strong> and MEC will annually collaborateto identify any incremental programs that mightbe cost-effective for <strong>PacifiCorp</strong> customers. TheCommission will be notified of any additionalcost-effective programs that are identified.52 Upon closing, MEHC and <strong>PacifiCorp</strong> commit toimmediately evaluate increasing the generationcapacity of the Blundell geothermal facility bythe amount determined to be cost-effective.Such evaluation shall be summarized in a reportand filed with the Commission concurrent withthe filing of <strong>PacifiCorp</strong>’s next IRP. This incrementalamount is expected to be at least 11 MWand may be as much as 100 MW. All cost effectiveincreases in Blundell capacity, completedbefore January 1, 2015, should be counted towardsatisfaction of <strong>PacifiCorp</strong>’s 1,400 MW renewableenergy goal, in an amount equal to thecapacity of geothermal energy actually added atthe plant.53 MEHC or <strong>PacifiCorp</strong> commit to commence assoon as practical after close of the transaction asystem impact study to examine the feasibilityof constructing transmission facilities from theJim Bridger generating facilities to Miners Substationin Wyoming. Upon receipt of the resultsof the system impact study, MEHC or Pacifi-Corp will review and discuss with stakeholdersthe desirability and economic feasibility of performinga subsequent facilities study for theBridger to Miners transmission project.How the Commitment is Addressedin the <strong>2007</strong> IRPA report describing the Blundellevaluation was filed in March <strong>2007</strong>with all six states.This commitment was completedby the company on August 23,2006. The Miners substation to JimBridger transmission upgrade is includedas an option in the <strong>2007</strong> <strong>Integrated</strong><strong>Resource</strong> <strong>Plan</strong>ning analysis.23
<strong>PacifiCorp</strong> – <strong>2007</strong> IRPChapter 2 – IRP Components, <strong>Plan</strong>ning Principles,Objectives, and ApproachMEHCCommitmentNumberC22a, O26a,Wy21aC22b, O26b,Wy21bI23, U17,Wy20MEHC Commitment DescriptionConcurrent with its next IRP filing, <strong>PacifiCorp</strong>commits to file a ten-year plan for achieving the1,400 MW renewables target, including specificmilestones over the ten years when resourceswill be added. The filing will include a ten-yearplan for installing transmission that will facilitatethe delivery of renewable energy and theachievement of its 2015 goal of at least 1,400MW of cost-effective renewable energy. Withinsix (6) months after the close of the transaction,MEHC and <strong>PacifiCorp</strong> will file with the Commissiona preliminary plan for achieving the1,400 MW renewable target.<strong>PacifiCorp</strong> commits to address as part of its nextIRP the appropriate role of incremental hydropowerprojects in meeting the 1400 MW renewablestarget.<strong>PacifiCorp</strong> agrees to include the following itemsin the 2006 IRP [<strong>2007</strong> IRP]:a) a wind penetration study to reappraise windintegration costs and cost-effective renewableenergy levels; andb) an assessment of transmission options for<strong>PacifiCorp</strong>’s system identified in the RMATSscenario 1 related to facilitating additional generationat Jim Bridger and, on equal footing,new cost-effective wind resources.How the Commitment is Addressedin the <strong>2007</strong> IRPThe preliminary plan was filed onSeptember 21, 2006. The final planwas filed concurrently with the<strong>2007</strong> IRP filing.A Renewables Action <strong>Plan</strong> toachieve at least 1,400 megawatts ofcost-effective renewable energy resourcesby 2015 was concurrentlywith the <strong>2007</strong> IRP. It will addresshydropower projects in the document.a) Wind supply curves were developedand used to select wind on acomparable basis with other resourcesin the Capacity ExpansionModule. Appendix J addresses thecompany’s wind resource methodologyused in this plan.b) The company included transmissionoptions in southwest andsoutheast Wyoming as potentialupgrades in its modeling in orderto facilitate wind development inWyoming.TREATMENT OF CUSTOMER AND INVESTOR RISKSThe IRP standards and guidelines in Utah require that <strong>PacifiCorp</strong> “identify which risks will beborne by ratepayers and which will be borne by shareholders 3 .” This section addresses this requirement.Three types of risk are covered: stochastic risk, capital cost risk, and scenario risk.3 Since <strong>PacifiCorp</strong> is now a subsidiary of a privately-owned company, this section will refer to <strong>PacifiCorp</strong>’s “investors”as opposed to “shareholders.”24
<strong>PacifiCorp</strong> – <strong>2007</strong> IRPChapter 2 – IRP Components, <strong>Plan</strong>ning Principles,Objectives, and ApproachStochastic RisksOne of the principle sources of risk that is addressed in this IRP is stochastic risk. Stochasticrisks are quantifiable uncertainties for particular variables. The variables addressed in this IRPinclude retail loads, natural gas prices, wholesale electricity prices, hydroelectric generation, andthermal unit availability. Changes in these variables that occur over the long-term are typicallyreflected in normalized revenue requirements and are thus borne by customers. Unexpectedvariations in these elements are normally not reflected in rates, and are therefore borne by investorsunless specific regulatory mechanisms provide otherwise. Consequently, over time, theserisks are shared between customers and investors. Between rate cases, investors bear these risks.Over a period of years, changes in prudently incurred costs will be reflected in rates and customerswill bear the risk.Capital Cost Risks<strong>PacifiCorp</strong> uses proxy resources in its portfolio evaluation and determination of the preferredportfolio. These proxy resources are characterized with generic capital cost estimates that areadjusted to reflect recent project experience and company-specific financial parameters. Theactual cost of a generating or transmission asset is expected to vary from the cost assumed in thisplan. State commissions may determine that a portion of the cost of an asset was imprudent andtherefore should not be included in the determination of rates. The risk of such a determination isborne by investors. To the extent that capital costs vary from those assumed in this IRP for reasonsthat do not reflect imprudence by <strong>PacifiCorp</strong>, the risks are borne by customers.Scenario RisksScenario risks pertain to abrupt or fundamental changes to model inputs that are appropriatelyhandled by scenario analysis as opposed to representation by a statistical process or expectedvalueforecast. The single most important scenario risk facing <strong>PacifiCorp</strong> are government actionsto regulate CO 2 emissions. This scenario risk relates to the uncertainty in predicting the scope,timing, and cost impact of CO 2 emission compliance rules.At the present time, the issue of how the risk associated with uncertain CO 2 regulatory costsshould be allocated to customers and investors is an open one. Complicating factors include thefollowing:• The prospect that a supercritical coal plant that is part of the company’s preferred portfoliocould receive IRP acknowledgement in one state and not another.• The need to weigh resource CO 2 cost risk against the opportunity costs of investing in alternativeresources with their own attendant cost risks (In this IRP, <strong>PacifiCorp</strong> shows that coalplants provide important portfolio risk diversification benefits when paired with other low-CO 2 emitting resources.)• Ratepayer/investor risk allocation may be treated differently among <strong>PacifiCorp</strong>’s jurisdictionsdepending on state resource policies and the evolution of inter-jurisdictional cost allocationapproaches designed to address them.At the combined Climate Change and <strong>Integrated</strong> Gasification Combined Cycle Working Groupmeeting on November 28, 2006, <strong>PacifiCorp</strong> facilitated a public discussion on ratepayer/investorrisk allocation in the event that the company acquires a coal unit that is not able to capture and25
<strong>PacifiCorp</strong> – <strong>2007</strong> IRPChapter 2 – IRP Components, <strong>Plan</strong>ning Principles,Objectives, and Approachstore CO 2 emissions. 4 The outcome of the discussion was that no consensus could be reached onthe risk allocation issue and how the company can effectively proceed with resource planninggiven the regulatory uncertainties; more questions were raised than answers provided.4 <strong>PacifiCorp</strong> arranged this discussion on CO 2 regulatory risk in fulfillment of an MEHC transaction commitment.26
<strong>PacifiCorp</strong> – <strong>2007</strong> IRPChapter 3 – The <strong>Plan</strong>ning Environment3. THE PLANNING ENVIRONMENTChapter Highlights The pace of new generation additions has begun to slow again in the west, raising thequestion of future resource adequacy in certain areas. The Western Electricity CoordinatingCouncil 2006 Power Supply Assessment indicates that the Rockies sub-regionwill show a resource deficit by 2010. Following an unprecedented increase in natural gas commodity escalation and volatility,forecasters expect a medium-term, temporary drop in natural gas commodity pricesdue to liquefied natural gas (LNG) facility expansion. Price uncertainty will continuebecause greater LNG imports will strengthen the linkage to volatile global gas and energymarkets. In conjunction with resource planning efforts, <strong>PacifiCorp</strong> has a greenhouse gas mitigationstrategy that includes a public working group to consider emission reduction bestpractices, carbon dioxide scenario analysis for the IRP and procurement programs, renewablesand demand-side management resource acquisition plans, and emissions accounting. Transmission constraints, and the ability to address them in a timely manner, representimportant planning considerations for ensuring that peak load obligations are met on areliable basis. Various regional transmission planning processes in the Western Interconnectionhave developed over the last several years to serve as the primary forumswhere major transmission projects are developed and coordinated. <strong>PacifiCorp</strong> is engagedin a number of these planning initiatives. The Energy Policy Act of 2005, the first major energy law enacted in more than a decade,includes numerous provisions impacting electric utilities. Key provisions includethe promotion of clean coal technology and renewable energy, the encouragement ofmore hydroelectric production through streamlined relicensing procedures and increasedefficiency, the use of time-based metering options and the provision of mandatoryreliability standards. <strong>PacifiCorp</strong>’s recent resource procurement activities include requests for proposal foreast-side baseload resources and renewable resources. In addition, requests for proposalshave been issued for demand-side resource programs. <strong>PacifiCorp</strong>’s planning process is impacted by (1) rapid evolution of state-specific resourcepolicies that place, or are expected to place, constraints on <strong>PacifiCorp</strong>’s resourceselection decisions, and (2) disparate state interests that complicate the company’s abilityto address state IRP requirements to the satisfaction of all stakeholders.27
<strong>PacifiCorp</strong> – <strong>2007</strong> IRPChapter 3 – The <strong>Plan</strong>ning EnvironmentINTRODUCTIONThis chapter profiles the major external influences that impact <strong>PacifiCorp</strong>’s long-term resourceplanning as well as recent procurement activities driven by the company’s past IRPs. Externalinfluences are comprised of events and trends in the power industry marketplace, along withgovernment policy and regulatory initiatives that influence the environment in which <strong>PacifiCorp</strong>operates.Concerning the power industry marketplace, the major issues addressed include capacity resourceadequacy and associated standards for the Western Electricity Coordinating Council(WECC) and the prospects for long-term natural gas commodity price escalation and continuedhigh volatility. As discussed elsewhere in the IRP, future natural gas prices and the role of gasfiredgeneration and market purchases are some of the critical factors impacting the determinationof the preferred portfolio that best balances low-cost and low-risk planning objectives.On the government policy and regulatory front, the largest emerging issue facing <strong>PacifiCorp</strong> ishow to plan given an eventual, but highly uncertain, climate change regulatory regime. Whilethis chapter reviews the significant policy developments for currently-regulated pollutants, itfocuses on climate change regulatory initiatives, particularly at the state level. A high-levelsummary of the company’s greenhouse gas emissions mitigation strategy follows. Other regulatorytopics covered include state renewable portfolio standards, hydropower relicensing, andmajor relevant provisions of the Energy Policy Act of 2005; namely, those pertaining to cleancoal technologies, renewable energy, demand response programs and advanced metering, fossilfuel generation efficiency standards, and transmission reliability.MARKETPLACE AND FUNDAMENTALS<strong>PacifiCorp</strong>’s system does not operate in an isolated vacuum. Operations and costs are tied to alarger electric system known as the Western Interconnection which functions, on a day-to-daybasis, as a geographically dispersed marketplace. Each month, millions of megawatt-hours ofenergy are traded in the wholesale electricity marketplace of the Western Interconnection. Thesetransactions yield economic efficiency by assuring that resources with the lowest operating costare serving demand in a region and by providing reliability benefits that arise from a larger portfolioof resources.<strong>PacifiCorp</strong> has historically participated in the wholesale marketplace in this fashion, making purchasesand sales to keep its supply portfolio in balance with customers’ constantly varying needs.This interaction with the market takes place on terms and time scales ranging from hourly toyears in advance. Without it, <strong>PacifiCorp</strong> or any other load serving entity would need to constructor own an unnecessarily large margin of supplies that would go unutilized in all but unusual circumstancesand would substantially diminish its capability to efficiently match delivery patternsto the profile of customer demand. The market is not without its risks, as the experiences of the2000-2001 market crisis and several more recent but briefer periods of price escalation in thewest have underscored. Marketplace risks have been amplified in recent years by the growingrole of natural gas fired generation in the Western Interconnection that have tied electricity marketprices increasingly to natural gas commodity prices.28
<strong>PacifiCorp</strong> – <strong>2007</strong> IRPChapter 3 – The <strong>Plan</strong>ning EnvironmentElectricity MarketsTwo overriding issues will tend to influence western electricity markets over the term of thisplan’s decision horizon. One of those is the evolution of natural gas prices, which is discussed inthe next section. The other is the overall balance of generating resources in the Western Interconnectionin relation to demand.A slow pace of generating resource additions during the 1990s and robust growth in demandacross the West were the main ingredients that set up the market crises of 2000-2001, althoughthere were many other well documented contributing factors. Since that crisis, a wave of newcapacity additions and demand side actions have righted the resource imbalance and restoredaggregate planning and operating reserve margins. However, the pace of new generation additionshas begun to slow again, raising the question of future resource adequacy and associatedmarketplace turmoil.The WECC currently reports adequate reserve margins for the Western Interconnection in aggregate,based on existing resources. Currently, the Western Interconnection maintains an adequatemargin of generation over projected demand through 2011 with the existing resource base andnew generation projects currently under construction or in advanced development. However,Southern California, the desert southwest and the Rocky Mountain sub-regions show narrowerprojected margins and are more vulnerable to resource shortfalls or unexpected demand growthspurts, with the potential to propagate market upsets. Indeed, widespread and extremely hot temperaturesin summer 2006 tested resource adequacy and caused a period of elevated marketprices and a few instances of supply inadequacy near misses.The pace and location of future resource additions have the potential to balance supply and demandadequately, but could also significantly undershoot or overshoot demand growth. Majortransmission additions could also contribute to overall supply adequacy, but these have generallylagged generation additions and demand growth in the Western Interconnection.Underlying these issues is the unresolved question of resource adequacy and responsibilitythroughout the Western Interconnection. The WECC does not have a regional planning reserverequirement. Without a system-wide binding standard for resource adequacy and responsibilitywith a multi-year horizon consistent with the multi-year time frame for most resource additions,there is elevated risk that the WECC or some of its sub-regions will experience demand growthin excess of supplies.Uncertainty in magnitude of demand and uncertainty in availability of resources compound theresource adequacy issue. <strong>Resource</strong> uncertainty is especially important in the Northwest, wherehydro accounts for more than half of installed capacity and the average energy availability fromhydro can vary substantially from year to year.The current WECC 2006 Power Supply Assessment analyzes resource adequacy for a number ofpossible future conditions for sub-regions of the Western Interconnection. Under base summerconditions, this assessment indicates that three of the WECC’s sub-regions (Southern California,the desert southwest and Rockies) show resource deficits by 2010. More adverse conditions acceleratethe deficits for these sub-regions to 2008. These results suggest that, even for utilities or29
<strong>PacifiCorp</strong> – <strong>2007</strong> IRPChapter 3 – The <strong>Plan</strong>ning Environmentsub-regions that maintain adequate reserve margins, there is an elevated risk of periods of exposureto high and volatile market prices, and that these risks must be carefully examined in resourceplans.Natural Gas Supply and Demand IssuesOver the last four years North American natural gas markets have demonstrated unprecedentedprice escalation and volatility. Spot gas prices averaged $3.34/MMBtu at the Henry Hubbenchmark in 2002 but more than doubled by 2005, averaging $8.80/MMBtu.Several factors have contributed to these market conditions and their interaction will play a majorrole in setting natural gas prices over the medium-term future. In particular, domestic UnitedStates production has reached a plateau, with growth from the Rocky Mountain region and fromunconventional resources largely offset by declining volumes from conventional mature producingregions. The higher finding and development costs of unconventional resources have alsoraised the price level necessary to stimulate such marginal supply growth. On the demand side,substantial growth of gas-fired generating resources has more than offset declines in industrialdemand for natural gas. This shift has reduced the amount of industrial demand that is mostprice-elastic and increased inelastic generation demand. Substantial oil price escalation over thissame time period has also supported higher natural gas prices, lifting the price of marginallycompetitive gas substitutes and the value of natural gas liquids.Combined, the above factors created a pronounced supply/demand imbalance in North Americanmarkets, raising prices sufficiently high to discourage marginal demand and to attract importsfrom an equally tight global market. This imbalance also made North American markets moresusceptible to upset from weather and other event shocks and tied them more directly to globalgas and energy markets.Most forecasters expect a gradual restoration of better supply/demand balance to North Americanmarkets over the next five years, and this profile is reflected in New York Mercantile Exchange(NYMEX) futures prices. The primary factor contributing to the forecasted price declineis a substantial growth in liquefied natural gas imports over this period. For example, the U.S.Energy Information Administration’s Annual Energy Outlook projects 2010 liquefied natural gas(LNG) imports to grow by <strong>30</strong>0% over 2005 levels.This growth in LNG imports will be supported by rapid expansion of LNG regasification capacitythat is well underway in North America, but will still take several years to reach fruition. Italso requires parallel growth in capital-intensive liquefaction capacity in major producing regions,which is also underway, and sufficient LNG shipping capacity, which is currently overbuilt.North American regasification capacity is now forecasted to be more than adequate withinfive years, and has the potential to substantially overshoot demand for these facilities early in thenext decade. On the other hand, recent delays and cost escalation in major liquefaction facilitieshas added some uncertainty to the forecasted downward price pressure.The momentum behind LNG growth explains the medium-term trend of declining natural gasprices seen in both forward prices, such as natural gas futures prices on the New York MercantileExchange, and in forecasts of prices such as the Department of Energy’s Annual Energy Outlook<strong>30</strong>
<strong>PacifiCorp</strong> – <strong>2007</strong> IRPChapter 3 – The <strong>Plan</strong>ning Environmentand other proprietary forecasts. Besides the downward price trend, the growth in reliance onLNG has other implications for North American natural gas markets. With a larger fraction ofNorth American supply coming from LNG, a stronger linkage to global gas and energy marketsis solidified. How this translates to U.S. gas price volatility is by no means clear, as the contractingstructure and terms and role of LNG spot cargos in global LNG markets is evolving. Recently,delays in commercial arrangements for Alaska North Slope natural gas pipeline developmenthave escalated the potential for LNG market share gains to indefinitely delay Alaska NorthSlope and Mackenzie Delta arctic frontier sources, although these are not now expected to contributeto supplies before 2015 and 2011, respectively, in any case.Several factors besides potential LNG supply delays contribute to a wide range of price uncertaintyover the next five years, including constraints on U.S. production infrastructure, linkagesto oil prices, and supply and demand elasticities. <strong>PacifiCorp</strong> relies on PIRA Energy’s ScenarioService, which describes and quantifies a range of forecasts, as a measure of future natural gasprice uncertainty. Over time PIRA’s natural gas scenarios have depicted a widening range ofprice uncertainty.Given the range of uncertainty over future natural gas prices, it is prudent to recognize possiblehigh and low gas prices as well as the most likely prices. <strong>PacifiCorp</strong> lays out such cases in Chapter5, describing low, medium, and high scenarios for both gas and wholesale electricity prices.In addition, the IRP has adopted a probability-weighted or expected value forecast case, shownin Appendix A, which is higher than the reference or most likely forecast case, implying riskasymmetry towards the up-side.Western regional natural gas markets are likely to remain well-connected to overall NorthAmerican natural gas prices for the medium term outlook. Although Rocky Mountain regionproduction is forecasted to be among the fastest growing in North America, major pipeline expansionsto the mid-west and east are slated for the next five years and these should maintainmarket price correlations between Cheyenne/Opal and Henry Hub. A number of west coast LNGregasification facilities have been proposed, and one in Ensenada, Mexico, is under constructionand expected to begin operation in 2008. Of the other facilities proposed for the west coast,there is relatively low probability that more than one will reach completion over the next fiveyears. In any case, the presence of west coast LNG regasification facilities is not likely to causelarge or abrupt disruptions in the relationship between western regional prices and overall NorthAmerican natural gas prices.FUTURE EMISSION COMPLIANCE ISSUESOver the next decade, <strong>PacifiCorp</strong> faces a changing environment with regard to electricity plantemission regulations. Although the exact nature of these changes remains uncertain, they areexpected to impact the cost of future resource alternatives and the cost of existing resources in<strong>PacifiCorp</strong>’s generation portfolio. No greater uncertainty exists in this area than the potential forglobal climate change and policy actions to control carbon dioxide, the principal emission associatedwith climate change. The section below briefly summarizes issues surrounding currently31
<strong>PacifiCorp</strong> – <strong>2007</strong> IRPChapter 3 – The <strong>Plan</strong>ning Environmentregulated air emissions. The potential for future regulation of CO 2 emissions due to climatechange concerns and <strong>PacifiCorp</strong>’s climate change strategy are then discussed in detail.Currently Regulated EmissionsCurrently, <strong>PacifiCorp</strong>’s generation units must comply with the federal Clean Air Act (CAA)which is implemented by the States subject to Environmental Protection Agency (EPA) approvaland oversight. The Clean Air Act directs EPA to establish air quality standards to protect publichealth and the environment. <strong>PacifiCorp</strong>’s plants must comply with air permit requirements designedto ensure attainment of air quality standards as well as the new source review (NSR) provisionsof the CAA. NSR requires existing sources to obtain a permit for physical and operationalchanges accompanied by a significant increase in emissions.Within the current federal political environment there exists a contentious debate over establishinga new energy policy and revising the CAA in order to reduce overall emissions from thecombustion of fossil fuels. Currently, the debate focuses on emission standards and compliancemeasures for sulfur dioxide (SO 2 ), nitrogen oxides (NO X ), mercury (Hg), particulate matter(PM), and regulation of carbon dioxide emissions. Several proposals to amend the Clean Air Actto limit air pollution emissions from the electric industry are being discussed at the nationallevel. Specifically, a number of alternative proposals for federal multi-pollutant legislation wouldrequire significant reductions in emissions of SO 2 , and NO X , and establish new definitive standardsfor mercury. Some proposals also contain measures to limit CO 2 and to revise certain otherregulatory requirements such as NSR.Within existing law, EPA’s Regional Haze Rule and the related efforts of the Western RegionalAir Partnership will require emissions reductions to improve visibility in scenic areas. Additionally,newly proposed administrative rulemakings by EPA, including the Clean Air Interstate Ruleand the Clean Air Mercury Rule will require significant reductions in emissions from electricalgenerating units. The outcome of the current debate, manifested in new legislation or rulemakings,will shape <strong>PacifiCorp</strong>’s emission requirements over the coming decade. Compliance costsassociated with anticipated future emissions reductions will largely depend on the levels of requiredreductions, the allowed compliance mechanisms, and the compliance time frame.<strong>PacifiCorp</strong> is committed to responding to environmental concerns and investing in higher levelsof protection for its coal-fired plants. <strong>PacifiCorp</strong> and MEHC anticipate spending $1.2 billionover the next ten years to install necessary equipment under future emissions control scenarios tothe extent that it’s cost-effective. The company has started its clean air projects, such as the installationof a baghouse, flue gas desulfurization and low nitrogen-oxide burners at the Huntington2 plant.Climate ChangeClimate change has emerged as an issue that requires attention from the energy sector, includingutilities. Because of its contribution to United States and global carbon dioxide emissions, theU.S. electricity industry is expected to play a critical role in reducing greenhouse gas emissions.In addition, the electricity industry is composed of large stationary sources of emissions that arethought to be often easier and more cost-effective to control than from numerous smallersources. <strong>PacifiCorp</strong> and parent company MidAmerican Energy Holdings Company recognize32
<strong>PacifiCorp</strong> – <strong>2007</strong> IRPChapter 3 – The <strong>Plan</strong>ning Environmentthese issues and have taken voluntary actions to reduce their respective CO 2 emission rates.<strong>PacifiCorp</strong>’s efforts to achieve this goal include adding zero-emitting renewable resources to itsgeneration portfolio such as wind, landfill gas, combined heat and power (CHP) and investing inon-system and customer-based energy efficiency and conservation programs. <strong>PacifiCorp</strong> alsocontinues to examine risk associated with future CO 2 emissions costs. The section below summarizesissues surrounding climate change policies.Impacts and SourcesAs far as sources of emissions are concerned, according to the U.S. Energy Information Administration,CO 2 emissions from the combustion of fossil fuels are proportional to fuel consumption.Among fossil fuel types, coal has the highest carbon content, natural gas the lowest, and petroleumin-between. In the Administration’s Annual Energy Outlook 2006 reference case, the sharesof these fuels change slightly from 2004 to 20<strong>30</strong>, with more coal and less petroleum and naturalgas. The combined share of carbon-neutral renewable and nuclear energy is stable from 2004 to20<strong>30</strong> at 14 percent. As a result, CO 2 emissions increase by a moderate average of 1.2 percent peryear over the period – 5,900 million metric tons in 2004 to 8,114 million metric tons by 20<strong>30</strong>,slightly higher than the average annual increase in total energy use. At the same time, the economybecomes less carbon intensive: the percentage increase in CO 2 emissions is one-third theincrease in GDP, and emissions per capita increase by only 11 percent over the 26-year period.According to the Administration’s Annual Energy Outlook 2006 report, the factors that influencegrowth in CO 2 emissions are the same as those that drive increases in energy demand. Amongthe most significant are population growth; increased penetration of computers, electronics, appliances,and office equipment; increases in commercial floor space; growth in industrial output;increases in highway, rail, and air travel; and continued reliance on coal and natural gas for electricpower generation. The increases in demand for energy services are partially offset by efficiencyimprovements and shifts toward less energy-intensive industries. New CO 2 mitigationprograms, more rapid improvements in technology, or more rapid adoption of voluntary programscould result in lower CO 2 emissions levels than projected here.<strong>PacifiCorp</strong> carefully tracks CO 2 emissions from operations and reports them in its annual emissionsfiling with the California Climate Action Registry.International and Federal PoliciesNumerous policy activities have taken place and continue to develop. At the global level, most ofthe world’s leading greenhouse gas (GHG) emitters, including the European Union (EU), Japan,China, and Canada, have ratified the Kyoto Protocol. The Protocol sets an absolute cap on GHGemissions from industrialized nations from 2008 to 2012 at 7% below 1990 levels. The Protocolcalls for both on-system and off-system emissions reductions. While the U.S. has thus far rejectedthe Kyoto Protocol, numerous proposals to reduce greenhouse gas emissions have beenoffered at the federal level. The proposals differ in their stringency and choice of policy tools.The Bush Administration has proposed an 18% voluntary carbon intensity reduction target, i.e.,emissions per unit of economic output. Such an approach could translate into a tons/MWh approachin the electricity sector.Democratic victories on November 7, 2006 in the House and Senate appear likely to boost effortsto strengthen U.S. global warming policy, but it is far from certain whether the 110 th Congress33
<strong>PacifiCorp</strong> – <strong>2007</strong> IRPChapter 3 – The <strong>Plan</strong>ning Environmentand President Bush will work together over the coming two years to enact a first-ever federal lawto cap greenhouse gas emissions.With Democrats taking over the House and the Senate in January, experts and lawmakers alikeexpect an emboldened legislative branch to advance an entirely new of set environment and energyproposals unlike anything seen during President Bush's previous six years in the WhiteHouse. The Senate Environment and Public Works Committee, chaired by Senator BarbaraBoxer (D-CA), has committed to having a set of intensive hearings on the issue of global warmingduring <strong>2007</strong>.On January 5, <strong>2007</strong>, Senator Bingaman (D-NM) circulated a discussion draft which identifies hiscurrent proposal for mandatory greenhouse gas reduction legislation. On January 12, <strong>2007</strong>, SenatorsLieberman (I-CT) and McCain (R-AZ) reintroduced their proposed federal carbon legislation.5 Senate legislation has also been released by Senators Sanders (I-VT) and Boxer (D-CA) 6and Senators Feinstein (D-CA) and Carper (R-DE). 7On January 18, <strong>2007</strong>, House Speaker Pelosi (D-CA) announced the formation of a new SelectCommittee on Energy Independence and Global Warming. The panel will draw on membersfrom as many as nine existing panels that already have authority over the issue. Rep. Ed Markey(D-Mass.) is expected to lead the new committee, which will only be commissioned for the110th Congress. The speaker also expressed her intent to have legislation through the committeesby July 4, <strong>2007</strong>.Regional InitiativesWestern regional state initiatives were significant in 2006. The most notable developments havebeen the Western Public Utility Commissions’ Joint Action Framework on Climate Change andthe Western Regional Climate Action Initiative.On December 1, 2006, California utility regulators and their counterparts in New Mexico, Oregonand Washington pledged to coordinate efforts to limit greenhouse gas emissions. The regulatorsin those four states will work together to address climate change, from promoting energyefficiency to encouraging the use of clean energy. The respective heads of the California PublicUtilities Commission, the Washington Utilities and Transportation Commission, the OregonPublic Utility Commission, and the New Mexico Regulation Commission signed the agreement.The Joint Action Framework on Climate Change outlines a commitment to regional cooperationto address climate change.On February 26, <strong>2007</strong>, during the annual winter meeting of the National Governors Association,Governors Arnold Schwarzenegger (California), Janet Napolitano (Arizona), Bill Richardson(New Mexico), Ted Kulongoski (Oregon) and Christine Gregoire (Washington) signed the WesternRegional Climate Action Initiative 8 that directs their respective states to develop a regionaltarget for reducing greenhouse gases by August <strong>2007</strong>. By August 2008, they are expected to de-5 S.280, the “Climate Stewardship and Innovation Act of <strong>2007</strong>”6 S.<strong>30</strong>9, the “Global Warming Pollution Reduction Act”7 S.319, the “Electric Utility Cap and Trade Act of <strong>2007</strong>”8 See, http://gov.ca.gov/mp3/press/022607_WesternClimateAgreementFinal.pdf34
<strong>PacifiCorp</strong> – <strong>2007</strong> IRPChapter 3 – The <strong>Plan</strong>ning Environmentvise a market-based program, such as a load-based cap-and-trade program to reach the target.The five states also have agreed to participate in a multi-state registry to track and managegreenhouse gas emissions in their region. The Initiative builds on existing greenhouse gas reductionefforts in the individual states as well as two existing regional efforts. In 2003, California,Oregon and Washington created the West Coast Global Warming Initiative, and in 2006, Arizonaand New Mexico launched the Southwest Climate Change Initiative.In response to limited federal activity, state policy has grown in prominence. While some stateshave adopted policies that address power plant emissions directly by either capping emissions orsetting an emissions rate limit (such as the Northeastern Regional Greenhouse Gas Initiative),other states have sought to reduce carbon emissions through resource selection either by adoptingrenewable portfolio standards or requiring utilities to consider potential carbon costs withintheir integrated resource planning. Within <strong>PacifiCorp</strong>’s service territory, only California hasadopted specific legislation directly regulating utility greenhouse gas emissions. Washington andOregon are expected to consider and possibly adopt climate legislation modeled after the Californialegislation during the <strong>2007</strong> legislative session. Wyoming has its Carbon Committee andUtah’s Governor recently convened a climate council to discuss the state climate policies. California’sgreenhouse gas emissions policies are profiled below.State InitiativesCalifornia Emissions Performance Standard (SB1368)California Senate Bill 1368 (SB 1368), signed into law on September 29, 2006, is an emissionsperformance standard law designed to effectuate a rulemaking at the California Public UtilitiesCommission, Docket No. R.06-04-009 9 , and grants authority to the California Energy Commissionto promulgate a similar emissions performance standard for publicly-owned utilities.<strong>PacifiCorp</strong> has been an active participant within the Commission docket. SB 1368 establishes agreenhouse gas emissions performance standard that prohibits any load serving entity, includingelectrical corporations, community choice aggregators, electric service providers, and local publiclyowned electric utilities, from entering into a long-term financial commitment unless baseload generation complies with a greenhouse gases emission performance standard not exceed therate of emissions of a combined-cycle natural gas facility.A long-term financial commitment is defined as a new ownership investment in base load generationor a new or renewed contract with a term of five or more years, which includes procurementof base load generation. Base load generation includes electricity generation from a powerplant that is designed and intended to provide electricity at an annualized plant capacity factor ofat least 60 percent.SB 1368 precludes the California Public Utilities Commission and the California Energy Commissionfrom approving the construction of or contract for base load generation that does notmeet the greenhouse gas emissions performance standard. Costs incurred for electricity purchaseagreements that are approved by the Public Utilities Commission that comply with the greenhousegas emission performance standard are recognized as procurement costs incurred pursuant9 The California PUC final Emissions Performance Standard Staff Workshop Report, which includes the latest staffstraw proposal, is posted on the PUC website at: www.cpuc.ca.gov/static/energy/electric/climate+change. The directlink to the Report is www.cpuc.ca.gov/published/REPORT/60350.htm.35
<strong>PacifiCorp</strong> – <strong>2007</strong> IRPChapter 3 – The <strong>Plan</strong>ning Environmentto an approved procurement plan and the Public Utilities Commission is required to ensuretimely cost recovery of those costs. Long-term financial commitments entered into through acontract approved by the Public Utilities Commission for electricity generated by a zero- or lowcarbongenerating resource 10 that is contracted for on behalf of consumers in California on acost-of-service basis is recoverable in rates, and the Public Utilities Commission may, after hearing,approve an increase from one-half to one percent in the return on investment by the thirdparty entering into the contract with an electrical corporation relating to its investment in zero- orlow-carbon generation resources.On January 25, <strong>2007</strong>, the California Public Utilities Commission approved the decision of PresidentPeevey and Administrative Law Judge Gottstein in Rulemaking 06-06-009 11 , “Order InstitutingRulemaking to Implement the Commission’s Procurement Incentive Framework and toexamine the Integration of Greenhouse Gas Emissions Standards into Procurement Policies”.The decision adopts an emissions performance standard of 1,100 pounds per megawatt-hour fornew long-term base load (60%) financial commitments. The term “long-term financial commitments”,will also include new financial investments by utilities in their own existing base loadgeneration that extends the life of a plant by five years or more.The Commission also adopted an interpretation of §§ 8341(d)(2) and (5) and clarified that it willdetermine compliance with the standard based on the reasonably projected net emissions over thelife of a facility, but in calculating the net emissions rate, the Commission will not count carbondioxide that is sequestered through injection in geological formations. This allows for a sequestrationproject to become operational after the power plant comes on line or the load serving entityenters into the contract. <strong>PacifiCorp</strong> had argued for such an interpretation as a means of allowingadvanced coal projects to demonstrate compliance with the greenhouse gas emissionsperformance standard even though their carbon sequestering equipment may not be operationalduring the first few years of a project.Regarding § 8341(d)(9)’s multi-jurisdictional utility qualification requirements for alternativecompliance, the Commission adopted the tests proposed by <strong>PacifiCorp</strong>. In fact, the Commissionwent further and concluded that the information provided by <strong>PacifiCorp</strong> during the rulemakingprocess and the Oregon Public Utilities Commission’s January 8, <strong>2007</strong> Order #07-002 12 , whichestablishes a proceeding to examine carbon dioxide risk associated with resource decisions, weresufficient for the Commission to conclude that <strong>PacifiCorp</strong> meets the alternative compliance requirements.As a result, <strong>PacifiCorp</strong> is not obligated to submit an alternative compliance applicationand is only required to file an annual attestation advice letter affirming that it still satisfiesthe alternative compliance requirements by February 1 of each year, beginning in 2008.The California Energy Commission must adopt regulations for municipal utilities consistent withthe Public Utilities Commission rules by June <strong>30</strong>, <strong>2007</strong>. 13 Enforcement of the emission perform-10 Zero- or low-carbon generating resource is defined as an electrical generating resource that will generate electricitywhile producing emissions of greenhouse gases at a rate substantially below the greenhouse gas emission performancestandards, as determined by the PUC.11 See, http://www.cpuc.ca.gov/PUBLISHED/AGENDA_DECISION/63931.htm12 See, http://apps.puc.state.or.us/edockets/orders.asp?ordernumber=07-00213 SB1368, supra note 42.36
<strong>PacifiCorp</strong> – <strong>2007</strong> IRPChapter 3 – The <strong>Plan</strong>ning Environmentance standard begins immediately upon the establishment of the standard. Existing combinedcyclepower plants that are in operation, or have a California Energy Commission final permitdecision to operate as of June <strong>30</strong>, <strong>2007</strong>, are grandfathered under the bill and deemed to be incompliance with the greenhouse gas emission performance standard.California Global Warming Solutions Act of 2006 (AB32)On September 27, 2006, California Governor Arnold Schwarzenegger signed into law AssemblyBill 32 (AB 32), known as the California Global Warming Solutions Act of 2006. California hassince become the focus of climate change policy due to its massive economy, the fact that it isthe 12 th largest emitter of greenhouse gases in the world, and has had a history of catalyzing theformation of national environmental policy and regulation.The bill itself is fairly performance-oriented and could result in a comprehensive, and thus effective,greenhouse gas mitigation strategy beyond the traditional focus solely on utilities. Under thelegislation, greenhouse gas emissions would be reduced to 1990 levels by 2020 (a 25% reduction)and further reduced to 80% below 1990 levels by 2050. In determining and measuring theselevels, the protocols of the California Climate Action Registry are to be incorporated to themaximum extent feasible. AB 32 also sets forth the following milestones for the California Air<strong>Resource</strong>s Board:• By July 1, <strong>2007</strong>, the Air <strong>Resource</strong>s Board forms Environmental Justice and Economic &Technology Advancement advisory committees.• By July 1, <strong>2007</strong>, the Air <strong>Resource</strong>s Board adopts list of discrete early action measures thatcan be adopted and implemented before January 1, 2010.• By January 1, 2008, the Air <strong>Resource</strong>s Board adopts regulations for mandatory greenhousegas emissions reporting. The Air <strong>Resource</strong>s Board defines a 1990 emissions baseline forCalifornia (including emissions from imported power) and adopts that as the 2020 statewidecap.• By January 1, 2009, the Air <strong>Resource</strong>s Board adopts plan indicating how emission reductionswill be achieved from significant sources of greenhouse gas emissions via regulations,market mechanisms and other actions.• During 2009, the Air <strong>Resource</strong>s Board staff drafts rule language to implement its plan andholds a series of public workshop on each measure (including market mechanisms).• By January 1, 2010, early action measures take effect.• During 2010, the Air <strong>Resource</strong>s Board conducts series of rulemakings, after workshops andpublic hearings, to adopt greenhouse gas regulations including rules governing marketmechanisms.• By January 1, 2011, the Air <strong>Resource</strong>s Board completes major rulemakings for reducingGHGs including market mechanisms. The Air <strong>Resource</strong>s Board may revise the rules andadopt new ones after January 1, 2011 in furtherance of the 2020 cap.• By January 1, 2012, greenhouse gas rules and market mechanisms adopted by the Air <strong>Resource</strong>sBoard take effect and are legally enforceable. (Note: This deadline dovetails wellwith the post-2012 Kyoto Protocol negotiations.)• December 31, 2020, is the deadline for achieving the 2020 greenhouse gas emissions capenforced by the Air <strong>Resource</strong>s Board.37
<strong>PacifiCorp</strong> – <strong>2007</strong> IRPChapter 3 – The <strong>Plan</strong>ning EnvironmentFurthermore, prior to creating enforceable mandates or market mechanisms (i.e. cap-and-tradeprograms), AB 32 specifies that the Air <strong>Resource</strong>s Board must evaluate at least the followingfactors:• Impacts on California’s economy, the environment, and public health,• Equity between regulated entities,• Electricity reliability,• Conformance with other environmental laws, and• To ensure that the rules do not disproportionately impact low-income communities.Although AB 32 does not specify a specific market-based policy tool to address greenhouse gasemissions, Governor Schwarzenegger has steered the state regulatory agencies in the direction ofan international cap-and-trade type program by issuing a new executive order related to AB 32 inOctober 2006. The executive order 14 specifies that:• The California Secretary for Environmental Protection shall create a Market Advisory Committeeof national and international experts to make recommendations to the State Air <strong>Resource</strong>sBoard on or before June <strong>30</strong>, <strong>2007</strong>, on the design of a market-based compliance program.• The Air <strong>Resource</strong>s Board shall collaborate with the California Secretary for EnvironmentalProtection and the Climate Action Team to develop a comprehensive market-based complianceprogram with the goal of creating a program that permits trading with the European Union,the Regional Greenhouse Gas Initiative and other jurisdictions.The executive order appears to be well in line with the text of AB 32 and cites “numerous studies”by institutions such as U.C. Berkeley, Stanford, and the Pew Center on Global ClimateChange that indicate that market-based policy mechanisms, such as emissions trading, are themost efficient and effective policy tools to address climate change.California Governor Schwarzenegger has already met with New York Governor Pataki to discussways that the California market mechanism for climate change can potentially tie in with theRegional Greenhouse Gas Initiative’s market-based cap and trade system. Nonetheless, the extentto which these two systems can be integrated remains to be seen.In light of the passage of AB 32, on November 1, 2006 the California Public Utilities Commissionindicated via an administrative law judge’s ruling that they will develop a model rule toeffectuate a state-wide load-based greenhouse gas cap-and-trade program for the electricity sector.The rulemaking will be undertaken as part of the Commission’s existing Docket No. R.06-04-009. 15 <strong>PacifiCorp</strong> has been an active participant within this docket.14 http://gov.ca.gov/index.php?/press-release/4447/15 The California PUC final Emissions Performance Standard Staff Workshop Report, which includes the latest staffstraw proposal, is posted on the PUC website at: www.cpuc.ca.gov/static/energy/electric/climate+change. The directlink to the Report is www.cpuc.ca.gov/published/REPORT/60350.htm.38
<strong>PacifiCorp</strong> – <strong>2007</strong> IRPChapter 3 – The <strong>Plan</strong>ning EnvironmentWashington’s Act Mitigating the Impacts of Climate Change <strong>2007</strong> (SB6001)Washington Governor Christine Gregoire on <strong>May</strong> 3, <strong>2007</strong> signed Senate Bill 6001, which containsprovisions aimed at reducing the state’s greenhouse gas (GHG) emissions. First, the Actestablished the following goals for statewide GHG emissions:• by 2020, reduce emissions to 1990 levels;• by 2035, reduce emissions to 25 percent below 1990 levels; and• by 2050, reduce emissions to 50 percent below 1990 levels, or 70 percent below thestate's expected emissions that year.It then established en employment goal that by 2020, increase the number of clean energy sectorjobs to 25,000 from the 8,400 jobs the state had in 2004.The bill also requires by December 31, <strong>2007</strong>, Department of Energy (DOE) and Department ofCommunity, Trade & Economic Development (CTED) must report to the appropriate committeesof the Legislature the total GHG emissions for 1990, and totals in each major sector for1990. By December 31 of each even-numbered year beginning in 2010, DOE and CTED mustreport to the Governor and the Legislature the total GHG emissions for the preceding two years,and totals in each major source sector.The Governor is also directed to develop policy recommendations on how the state can achievethe specified GHG emissions reduction goals. The recommendations must include such issues ashow market mechanisms would assist in achieving the goals. The recommendations must besubmitted to the Legislature during the 2008 Legislative Session.The bill also establishes a GHG Emissions Performance Standard (EPS). Beginning July 1, 2008,the GHG emissions performance standard for all baseload electric generation for which electricutilities enter into long-term financial commitments on or after such date is the lower of:• 1,100 pounds of GHG per megawatt-hour; or• the average available GHG emissions output as updated by CTED.In general, all baseload electric generation that begins operation after June <strong>30</strong>, 2008, and is locatedin Washington, must comply with the performance standard. The following facilities aredeemed to be in compliance with the performance standard:• all baseload electric generation facilities in operation as of June <strong>30</strong>, 2008, until they arethe subject of long-term financial commitments;• all electric generation facilities or power plants powered exclusively by renewable resources;and• all cogeneration facilities in the state that are fueled by natural gas or waste gas in operationas of June <strong>30</strong>, 2008, until they are the subject of a new ownership interest or are upgraded.The following emissions produced by baseload electric generation do not count against the performancestandard:• emissions that are injected permanently in geological formations;39
<strong>PacifiCorp</strong> – <strong>2007</strong> IRPChapter 3 – The <strong>Plan</strong>ning Environment• emissions that are permanently sequestered by other means approved by DOE; and• emissions sequestered or mitigated under a plan approved by the EFSEC, as specified inthe act.Unlike California’s EPS, the Washington proposal offers some potential emissions mitigationoptions to allow energy from new coal plants to be used in the state. These provisions allow coalpower as long as operators reduce emissions from other sources to meet the EPS. For example, anew base-load coal plant has up to five years after commencing operation to initiate a CO 2 capture-and-sequestrationprocess to meet the law. If the technology is not available at that time, theplant owner has options to mitigate the CO 2 emissions to meet the EPS and stay in the Washingtonenergy market. For example, a plant owner can purchase “verifiable GHG emission reductions”from another power plant located within the Western Interconnection that would not haveoccurred otherwise. Coal plant operators could also purchase CO 2 -emitting power generatorswith the intent to shut them down, and use the avoided CO 2 emissions as offsets to meet the EPSfor a new power plant project.By June <strong>30</strong>, 2008, DOE and Washington State Energy Facility Site Evaluation Council (EFSEC)must coordinate and adopt rules to implement and enforce the GHG emissions performancestandard, including the evaluation of sequestration and mitigation plans. In addition, CTED mustconsult with specified groups, such as the Bonneville Power Administration, and consider theeffects of the standard on system reliability and the overall costs to electricity customers.In order to update the standard, CTED must conduct a survey every five years of new combinedcyclenatural gas thermal electric generation turbines commercially available and offered for saleby manufacturers and purchased in the United States. CTED must use the survey results to adoptby rule the average available GHG emissions output. The survey results must be reported to theLegislature every five years, beginning June <strong>30</strong>, 2013.Electric utilities may not enter into long-term financial commitments for baseload electric generationunless the generation complies with the performance standard. For an investor-ownedutility (IOU), the Washington Utilities and Transportation Commission (WUTC) must review along-term financial commitment in a general rate case. The WUTC must also review an IOU'sproposed decision to acquire electric generation or enter into a power purchase agreement forelectricity, upon application of the utility. The process for reviewing proposed decisions must bespecified in rule and conducted under the Administrative Procedures Act. The WUTC must consultwith DOE when verifying compliance with the performance standard. The WUTC mustadopt all implementing rules by December 31, 2008. The WUTC may exempt a utility from theperformance standard for unanticipated electric system reliability needs, catastrophic events, orthreat of significant financial harm arising from unforeseen circumstances.DOE, in consultation with CTED, EFSEC, the WUTC, and the governing boards of consumerownedutilities, must review the GHG emissions performance standard no less than every fiveyears or upon the implementation of a federal or state law or rule regulating CO 2 emissions ofelectric utilities, and report to the Legislature.40
<strong>PacifiCorp</strong> – <strong>2007</strong> IRPChapter 3 – The <strong>Plan</strong>ning EnvironmentBy December 31, <strong>2007</strong>, the Governor must report to the Legislature the potential benefits of creatingtax incentives to encourage base load electric facilities to upgrade their equipment to reduceCO 2 emissions, the nature and level of tax incentives likely to produce the greatest benefits,and the cost of providing such incentives.Oregon Examination of Treatment of CO 2 Policy Risk within IRP <strong>Plan</strong>ningOn January 8, <strong>2007</strong>, the Oregon Public Utilities Commission issued an order within the <strong>Integrated</strong><strong>Resource</strong> <strong>Plan</strong>ning docket UM 1056. 16 As part of the Order, the Commission announced itwas opening an investigation to review the treatment of carbon dioxide risk in <strong>Integrated</strong> <strong>Resource</strong><strong>Plan</strong>s (per footnote 11, this will apply to future Requests for Proposals), which will ultimatelyreplace the analysis required in Order 93-695. Next, the Commission noted in footnotefive that it had committed to explore a carbon dioxide emissions performance standard for longtermpower supplies in adopting the Joint Action Framework on Climate Change, and that thisinvestigation would follow the proceeding on carbon dioxide risk in <strong>Integrated</strong> <strong>Resource</strong> <strong>Plan</strong>s.On February 8, <strong>2007</strong>, the Oregon Public Utilities Commission announced it would begin workunder docket UM-1<strong>30</strong>2 17 investigating the treatment of carbon dioxide risk in <strong>Integrated</strong> <strong>Resource</strong><strong>Plan</strong>s.Corporate Greenhouse Gas Mitigation Strategy<strong>PacifiCorp</strong> is committed to engage proactively with policymaking focused on GHG emissionsissues through a strategy that includes the following elements.● Policy – <strong>PacifiCorp</strong> has established a Global Climate Change Working Group, meant to examinebest utility practices for addressing carbon risk. The company has also supported legislationthat enables GHG reductions while addressing core customer requirements. <strong>PacifiCorp</strong>will continue to work with regulators, legislators, and other stakeholders to identify viabletools for GHG emissions reductions.● <strong>Plan</strong>ning – <strong>PacifiCorp</strong> has incorporated a reasonable range of values for the cost of CO 2 inthe <strong>2007</strong> IRP in concert with numerous alternative future scenarios to reflect the risk of futureregulations that can affect relative resource costs. Additional voluntary actions to mitigategreenhouse gas emissions could increase customer rates and represent key public policydecisions that the company will not undertake without prior consultation with regulators andlawmakers at state and federal levels.● Procurement – <strong>PacifiCorp</strong> recognizes the potential for future CO 2 costs in requests for proposal(RFPs), consistent with its treatment in the IRP. Commercially available carboncapturingand storage technologies at a utility scale do not exist today. Carbon-capturingtechnologies are under development for both pulverized coal plant designs and for coal gasificationplant designs, but require research to increase their scale for electric utility use.● Accounting – <strong>PacifiCorp</strong> has adopted transparent accounting of GHG emissions by joiningthe California Climate Action Registry. The Registry applies rigorous accounting standards,16 See, http://apps.puc.state.or.us/edockets/orders.asp?ordernumber=07-00217 See, http://apps.puc.state.or.us/edockets/docket.asp?DocketID=1389641
<strong>PacifiCorp</strong> – <strong>2007</strong> IRPChapter 3 – The <strong>Plan</strong>ning Environmentbased in part on those created by the World Business Council on Sustainable Developmentand the World <strong>Resource</strong>s Institute, to the electric sector.The current strategy is focused on meaningful results, including installed renewables capacityand effective demand-side management programs that directly benefit customers. While theseefforts provide multiple benefits of which lower GHG emissions are a part, they are clearly attractivewithin an effective climate strategy and will continue to play a key role in future procurementefforts. As part of <strong>PacifiCorp</strong>’s Global Climate Change Working Group effort, a PreliminaryGlobal Climate Change Action <strong>Plan</strong> will be completed by the company in <strong>2007</strong> andfiled with the six state utility commissions. Within the <strong>Plan</strong>, <strong>PacifiCorp</strong> expects to propose significantchanges to its corporate greenhouse gas mitigation strategy.RENEWABLE PORTFOLIO STANDARDSA renewable portfolio standard (RPS) is a policy that obligates each retail seller of electricity toinclude in its resource portfolio (the resources procured by the retail seller to supply its retailcustomers) a certain amount of electricity from renewable energy resources, such as wind andsolar energy. The retailer can satisfy this obligation by either (1) owning a renewable energyfacility and producing its own power, or (2) purchasing renewable electricity from someoneelse's facility.Some RPS statutes or rules allow retailers to trade their obligation as a way of easing compliancewith the RPS. Under this trading approach, the retailer, rather than maintaining renewable energyin its own energy portfolio, instead purchases tradable credits that demonstrate that someone elsehas generated the required amount of renewable energy.RPS policies are currently implemented at the state level 18 , and vary considerably in their requirementswith respect to time frame, resource eligibility, treatment of existing plants, arrangementsfor enforcement and penalties, and whether they allow trading of renewable energy credits.19 As of late 2006, 23 states and the District of Columbia had adopted RPS regulations. Themost recent adoption occurred in Washington, which passed a ballot measure in November 2006.Two states in <strong>PacifiCorp</strong>’s service territory—California and Washington—now have an RPS inplace. Recent RPS legislative and regulatory activities in California, Washington, and Oregonare summarized below.CaliforniaIn 2006, the California legislature approved, and Governor Schwarzenegger signed into law, abill that codifies an earlier deadline for reaching the state’s renewable energy goals. Existing lawhad established the RPS program and a goal of 20% of retail electric sales from renewable resourcesby 2017. The new legislation, Senate Bill 107 20 , accelerates the target date to December18 Interest in a federal RPS policy is expanding. For example, a bipartisan group of Senators and Representativeshave re-introduced the 25x'25 House and Senate Concurrent Resolutions in January <strong>2007</strong> calling for a new nationalrenewable energy supply goal of 25% by 2025.19 See, http://www.eere.energy.gov/states/maps/renewable_portfolio_states.cfm20 SB 107 as enacted and chaptered is posted on the legislature’s web site at:42
<strong>PacifiCorp</strong> – <strong>2007</strong> IRPChapter 3 – The <strong>Plan</strong>ning Environment31, 2010. The law now comports with earlier decisions by the California Public Utilities Commissionthat established the “20% by 2010” target. Senate Bill 107 requires compliance with thestandard by investor-owned utilities, community choice aggregators, and electric service providers.Municipal utilities are exempt, but must meet expanded reporting requirements on theirplans and accomplishments in supporting the development and use of renewable resources. Otherprovisions of the bill authorize the use of renewable energy credits, “flexible compliance” approaches,and program eligibility for renewable power produced outside the state if it is deliveredto California locations.Existing law requires the California Energy Commission to certify eligible renewable resources,to develop a regional accounting system to verify compliance, and to allocate and award supplementalenergy payments (SEPs) to cover above-market costs of renewables. The bill requires theEnergy Commission to recover all costs of the regional accounting system from user fees. Thebill also requires the Energy Commission to develop tracking, accounting, verification, and enforcementmechanisms for renewable energy credits (RECs). Certain renewable resource facilitieslocated outside the state can be eligible for SEPs, but awards to those facilities are limited to10% of total funds available.<strong>PacifiCorp</strong> filed a proposed compliance plan for meeting the California RPS requirements in2006. In its filing, <strong>PacifiCorp</strong> cited its 2001 eligible 21 renewable resource generation as approximately4% of its retail sales in California. <strong>PacifiCorp</strong> is currently required to deliver 20% of itsCalifornia load from eligible renewable resources by 2010. It is also worth noting that the Californialegislature is currently considering legislation that would establish a 33% requirement by2020.OregonAt the request of Governor Kulongoski, a number of state agencies were asked to develop a RenewableEnergy Action <strong>Plan</strong> (REAP) with input from stakeholders. These agencies—Agriculture, PUC, Economic Development, Energy, Environmental Quality, Forestry and Water<strong>Resource</strong>s—prepared several drafts, which were sent to interested individuals, businesses andorganizations and posted on the Oregon Department of Energy Web site. Public comment andstakeholder input was taken and a series of public meetings were held before finalizing thedocument. The final Renewable Energy Action <strong>Plan</strong> was released in April of 2005.The REAP contains numerous renewable energy policy goals for the state and also a mandate to"support a Renewable Energy Working Group to be coordinated through the Governor's Officeand the Oregon Department of Energy to guide the implementation of this <strong>Plan</strong>." A long list ofactions for state agencies is included in the <strong>Plan</strong>, as well as numerous tasks for the RenewableEnergy Working Group.A Renewable Energy Working Group was formed through a collaborative process involving theOregon Department of Energy and the Governor's Office. The primary mission of the RenewableEnergy Working Group (REWG) was to guide implementation of the Renewable Energy Actionhttp://www.leginfo.ca.gov/pub/bill/sen/sb_0101-0150/sb_107_bill_20060926_chaptered.pdf21 The California RPS stipulated resources eligible for inclusion in meeting the RPS requirement. It should be notedthat the only eligible hydro resources are those with capacity less than <strong>30</strong> megawatts.43
<strong>PacifiCorp</strong> – <strong>2007</strong> IRPChapter 3 – The <strong>Plan</strong>ning Environment<strong>Plan</strong>. Group members were tasked by the Governor to develop a legislative proposal for a RPSthat would be 25 percent of retail sales by 2025. The Renewable Energy Working Group’s legislativeproposal was introduced during the <strong>2007</strong> legislative session and is currently under consideration.The proposal would establish an RPS with the schedule of at least 5% of load by January1, 2011, at least 15% by January 1, 2015, at least 20 percent by January 1, 2020, and at least 25percent by January 1, 2025.In addition to its renewable energy focus, Oregon's proposed RPS also provides the frameworkfor the further expansion of cost-effective conservation activity in the state by electric utilities. Itallows the Commission to authorize an electric company to include in its rates the costs of fundingor implementing cost-effective energy conservation measures beyond those currently fundedthrough the state's public purpose charge—established under the state's restructuring legislationin 2002—and delivered by the Energy Trust of Oregon. If approved, Oregon's portfolio standardmay allow conservation investments up to the potential conservation opportunity within thestate, further adding to the demand-side resources available to address <strong>PacifiCorp</strong>’s demandgrowth in the state.WashingtonIn November 2006, Washington voters approved ballot initiative I-937 22 , which would establishan RPS with the schedule of at least 3% of load by January 1, 2012, at least 9% by January 1,2016, and at least 15% by January 1, 2020. The annual targets are based on the average of theutility’s load for the previous two years. The Washington Utilities and Transportation Commissionundertook rulemaking UE-061895 to effectuate the referendum.Federal Renewable Portfolio StandardCongress is expected to take up federal energy policy legislation, including the possibility of afederal RPS, as early as summer <strong>2007</strong>. On the House side, Rep. Tom Udall (D-N.M.) has introducedlegislation creating a 20% standard by 2020. Senate Energy and Natural <strong>Resource</strong>s CommitteeChairman Jeff Bingaman (D-N.M.) has indicated he is planning legislation with a level of15 percent by 2020.The Senate has approved an RPS several times, most recently as part of the 2005 energy bill, butit died in conference with the House. Even so, environmentalists see the Democratic Congress asan opportunity for a host of initiatives that have failed in recent years. But the fate and timing ofan RPS in the Energy and Commerce Committee, which has jurisdiction over the issue, is farfrom clear because a key committee leader and others have been skeptical of the need for anRPS.TRANSMISSION PLANNING<strong>Integrated</strong> <strong>Resource</strong> <strong>Plan</strong>ning PerspectiveTransmission constraints, and the ability to address them in a timely manner, represent importantplanning considerations for ensuring that peak load obligations are met on a reliable basis. With22 See, http://www.secstate.wa.gov/elections/initiatives/text/i937.pdf44
<strong>PacifiCorp</strong> – <strong>2007</strong> IRPChapter 3 – The <strong>Plan</strong>ning Environmentthis in mind, <strong>PacifiCorp</strong>’s IRP team has increased its coordination with transmission planningpersonnel to more closely align long-term generation and transmission planning activities. Theresult for this IRP is a set of transmission resources for portfolio modeling that addresses Pacifi-Corp’s control area needs as well as enables a first-cut evaluation of the impacts of a large multistatetransmission project. As discussed in the next section, <strong>PacifiCorp</strong> is engaged in a number ofregional transmission planning initiatives intended to address transmission issues and projectopportunities. Future IRP analysis efforts will be informed by these transmission planning initiatives.Interconnection-Wide Regional <strong>Plan</strong>ningVarious regional planning processes have developed over the last several years in the WesternInterconnection. It is expected that, in the future, these processes will be the primary forumswhere major transmission projects are developed and coordinated. In the Western Interconnection,regional planning has evolved into a two tiered approach where an interconnection-wideentity, Western Electricity Coordinating Council (WECC) conducts regional planning at a veryhigh level and several sub-regional planning groups focus with greater depth on their specificareas.Last year, WECC took on the responsibility for interconnection-wide transmission expansionplanning. WECC’s role in meeting the region’s need for regional economic transmission planningand analyses is to provide impartial and reliable data, public process leadership, and analyticaltools and services. The activities of WECC in this area are guided and overseen by aboard-level committee, the Transmission Expansion <strong>Plan</strong>ning Policy Committee (TEPPC).TEPPC’s three main functions include: (1) overseeing database management, (2) providing policyand management of the planning process, and (3) guiding the analyses and modeling forWestern Interconnection economic transmission expansion planning. These functions complimentbut do not replace the responsibilities of WECC members and stakeholders to develop andimplement specific expansion projects.TEPPC organizes and steers WECC regional economic transmission planning activities. Specificresponsibilities include:• steering decisions on key assumptions and the process by which economic transmissionexpansion planning data are collected, coordinated and validated;• approving study plans, including study scope, objectives, priorities, overall methods/approach,deliverables, and schedules;• steering decisions on analytical methods and on selecting and implementing productioncost and other models found necessary;• ensuring the economic transmission expansion planning process is impartial, transparent,properly executed and well communicated;• ensuring that regional experts and stakeholders participate, including state/provincial energyoffices, regulators, resource and transmission developers, load serving entities, environmentaland consumer advocate stakeholders through a stakeholder advisory group;• steering report writing and other communications that include communications betweenthe TEPPC and the sub-regional planning groups;• advising the WECC Board on policy issues affecting economic transmission expansionplanning;45
<strong>PacifiCorp</strong> – <strong>2007</strong> IRPChapter 3 – The <strong>Plan</strong>ning Environment• recommending budgets for WECC’s economic transmission expansion planning process;• organizing and coordinate activities with sub-regional planning processes; and• approving recommendations to improve the economic transmission expansion planningprocess.TEPPC analyses and studies will focus on plans with west-wide implications and will include ahigh level assessment of congestion and congestion costs. The analyses and studies will alsoevaluate the economics of resource and transmission expansion alternatives on a regional,screening study basis. <strong>Resource</strong> and transmission alternatives may be targeted at relieving congestion,minimizing and stabilizing regional production costs, diversifying fuels, achieving renewableresource and clean energy goals, or other purposes. Alternatives may draw from stateenergy plans, integrated resource plans, large regional expansion proposals, sub-regional plansand studies, and other sources such as individual control areas if relevant in a regional context.TEPPC’s role does not include:1. conducting sub-regional or detailed project-specific studies,2. prioritizing and advocating specific economic expansion projects,3. identifying potential “winners” and “losers,”4. developing or advocating cost allocations,5. developing or advocating cost allocation criteria,6. providing mechanisms to obtain funding,7. assigning transmission rights,8. providing backstop permitting or approval authority, or9. performing reliability analysis outside of what is being done today.TEPPC includes transmission providers, policy makers, governmental representatives, and otherswith expertise in planning, building new economic transmission, evaluating the economics oftransmission or resource plans; or managing public planning processes.Sub-regional <strong>Plan</strong>ning GroupsRecognizing that planning the entire interconnection in one forum is impractical due to theoverwhelming scope of the task, a number of smaller sub-regional groups have been formed toaddress specific problems in various areas of the interconnection. Generally all of these forumsprovide similar regional planning functions, including the development and coordination of majortransmission plans within their areas. It is these sub-regional forums where the majority oftransmission projects are expected to be developed. These forums will be informally coordinatedwith each other directly through liaisons and through TEPPC. A current list of sub-regionalgroups is provided below.• CCPG – Colorado Coordinated <strong>Plan</strong>ning Group• CG – Columbia Grid• NTAC - Northwest Transmission Assessment Committee• NTTG – Northern Tier Transmission Group• STEP - Southwest Transmission Expansion <strong>Plan</strong>ning• SWAT – Southwest Area Transmission Study46
<strong>PacifiCorp</strong> – <strong>2007</strong> IRPChapter 3 – The <strong>Plan</strong>ning EnvironmentThe geographical areas covered by these sub-regional planning groups are approximately asshown in Figure 3.1 below. In addition to the above groups, California is attempting to coordinatethe overall planning for their state.Figure 3.1 – Sub-regional Transmission <strong>Plan</strong>ning Groups in the WECCCGColumbiaGridNTACNorthwest TransmissionAssessment CommitteeCASTEPSouthwest TransmissionExpansion <strong>Plan</strong>ningNTTGNorthern TierTransmission GroupCCPGColorado Coordinated<strong>Plan</strong>ning GroupSWATSouthwest AreaTransmission StudyHYDROELECTRIC RELICENSINGThe issues involved in relicensing hydroelectric facilities are multifaceted. They involve numerousfederal and state environmental laws and regulations, and participation of numerous stakeholdersincluding agencies, Indian tribes, non-governmental organizations, and local communitiesand governments.The value to relicensing hydroelectric facilities is continued availability of hydroelectric generation.Hydroelectric projects can often provide unique operational flexibility as they can be calledupon to meet peak customer demands almost instantaneously and provide back-up for intermittentrenewable resources such as wind. In addition to operational flexibility, hydroelectric generationdoes not have the emissions concerns of thermal generation. Relicensing or decommissioningof many of <strong>PacifiCorp</strong>’s projects are nearing completion as Federal Energy RegulatoryCommission (FERC) licenses or Orders are expected to be issued for the majority of the portfolioover the next 1 to 3 years.47
<strong>PacifiCorp</strong> – <strong>2007</strong> IRPChapter 3 – The <strong>Plan</strong>ning EnvironmentFERC hydroelectric relicensing is administered within a very complex regulatory framework andis an extremely political and often controversial public process. The process itself requires thatthe project’s impacts on the surrounding environment and natural resources, such as fish andwildlife, be scientifically evaluated, followed by development of proposals and alternatives tomitigate for those impacts. Stakeholder consultation is conducted throughout the process. If resolutionof issues cannot be reached in this process, litigation often ensues which can be costly andtime-consuming. There is only one alternative to relicensing, that being decommissioning. Bothchoices, however, can involve significant costs.The FERC has sole jurisdiction under the Federal Power Act to issue new operating licenses fornon-federal hydroelectric projects on navigable waterways, federal lands, and under other certaincriteria. The FERC must find that the project is in the broad public interest. This requires weighing,with “equal consideration,” the impacts of the project on fish and wildlife, cultural activities,recreation, land-use, and aesthetics against the project’s energy production benefits. However,because some of the responsible state and federal agencies have the ability to place mandatoryconditions in the license, the FERC is not always in a position to balance the energy and environmentalequation. For example, the National Oceanic and Atmospheric Administration Fisheriesagency and the U.S. Fish and Wildlife Service have the authority within the relicensing torequire installation of fish passage facilities (fish ladders and screens) at projects. This is oftenthe largest single capital investment that will be made in a project and can render some projectsuneconomic. Also, because a myriad of other state and federal laws come into play in relicensing,most notably the Endangered Species Act and the Clean Water Act, agencies’ interests maycompete or conflict with each other leading to potentially contrary, or additive, licensing requirements.<strong>PacifiCorp</strong> has generally taken a proactive approach towards achieving the best possiblerelicensing outcome for its customers by engaging in settlement negotiations with stakeholders,the results of which are submitted to the FERC for incorporation into a new license.Potential ImpactRelicensing hydroelectric facilities involves significant process costs. The FERC relicensingprocess takes a minimum of five years and generally takes nearly ten or more years to complete,depending on the characteristics of the project, the number of stakeholders, and issues that ariseduring the process. As of December 31, 2006, <strong>PacifiCorp</strong> had incurred $79.0 million in costs forongoing hydroelectric relicensing, which are included in Construction work-in-progress on<strong>PacifiCorp</strong>'s Consolidated Balance Sheet. As relicensing efforts continue, additional processcosts are being incurred that will need to be recovered from customers. Also, new requirementscontained in FERC licenses or decommissioning Orders could amount to over $2 billion over thenext <strong>30</strong> to 50 years. Such costs include capital and operations and maintenance investmentsmade in fish passage facilities, recreational facilities, wildlife protection, cultural and flood managementmeasures as well as project operational changes such as increased in-stream flow requirementsto protect fish resulting in lost generation. About 90 percent of these relicensing costsrelate to <strong>PacifiCorp</strong>’s three largest hydroelectric projects: Lewis River, Klamath River and NorthUmpqua.Treatment in the IRPThe known or expected operational impacts mandated in the new licenses are incorporated in theprojection of existing hydroelectric resources discussed in Chapter 4.48
<strong>PacifiCorp</strong> – <strong>2007</strong> IRPChapter 3 – The <strong>Plan</strong>ning Environment<strong>PacifiCorp</strong>’s Approach to Hydroelectric RelicensingAs noted, <strong>PacifiCorp</strong> continues to manage this process by pursuing negotiated settlements as partof the relicensing process. <strong>PacifiCorp</strong> believes this proactive approach, which involves meetingagency and others’ interests through creative solutions is the best way to achieve environmentalimprovement while managing costs. <strong>PacifiCorp</strong> also has reached agreements with licensingstakeholders to decommission projects where that has been the most cost-effective outcome forcustomers.ENERGY POLICY ACT OF 2005The Energy Policy Act of 2005 (EPAct), the first major energy law enacted in more than a decade,documents the tone of the current political/social environment. More than 1,700 pages long,the Act has hundreds of provisions. With respect to electric utilities the major provisions of theact include the following.• Promote clean coal technology and provides incentives for renewable energy such as biomass,wind, solar and hydroelectricity and by requiring net metering options• Encourage more hydropower production by improving current procedures for hydroelectricproject licensing and calling for plans to improve the efficiency of existing projects.• Requires state commissions to consider adopting five new standards dealing with net metering,interconnection, fossil fuel generation efficiency, time-based metering and telecommunication,and fuel sources.• Provide for enforceable mandatory reliability standards, incentives for transmission grid improvementsand reform of transmission siting rules. These improvements will attract new investmentinto the industry and ensure the reliability of our nation’s electricity grid in order tostop future blackouts.• Provides research and development support and a production tax credit for advanced nuclearpower facilitiesThis section covers the major EPAct provisions that impact <strong>PacifiCorp</strong> and how the company isaddressing them.Clean Coal ProvisionsThe EPAct contains a number of provisions to encourage development of clean coal technologies.These provisions cover not only power generation technologies, but other coal-based technologiesto encourage national energy security, reduced dependency on premium fossil fuelssuch as oil and natural gas, increased efficiency, and reductions in emissions. The primary focusof the clean coal provisions of the EPAct is on gasification, but other advanced technologies suchas ultra-supercritical boiler technologies are also considered.Under Title IV of the EPAct, financial assistance is made available to qualifying projects. Theprimary focus for the financial assistance is for advanced combustion systems and processes thatreduce air pollution. Financial assistance can consist of cost sharing or loans.49
<strong>PacifiCorp</strong> – <strong>2007</strong> IRPChapter 3 – The <strong>Plan</strong>ning EnvironmentUnder Title XIII of the EPAct, a number of tax incentives are established. These incentives areprimarily focused on development of gasification technologies both for electric power generationand coal-based gasification processes that produce liquid and gaseous fuels as well as primarychemical feedstocks. Available credits will be allocated on a first-come, first-served basis takinginto account Department of Energy (DOE) balancing of the EPAct policy goals (fuel diversity,location, technology, CO 2 capture, project economics), i.e. integrated gasification combined cycle(IGCC) projects that include greenhouse gas capture, increase by-product utilization, andother benefits will be given high priority in the allocation of credits for IGCC projects.Under the guidelines there are three separate application periods (2006, <strong>2007</strong>, and 2008); theapplication date for each application period is June <strong>30</strong> of each year. Based on the overwhelmingresponse the DOE received in 2006, the availability of investment tax credits (ITCs) is expectedto diminish with time.<strong>PacifiCorp</strong> submitted confidential applications on June 29, 2006 to the DOE for ITCs under thissection of the Act for IGCC facilities at both the Hunter and Jim Bridger plant sites. <strong>PacifiCorp</strong>also indicated an interest in Energy Northwest’s planned development of the Pacific MountainEnergy Center IGCC project. The proposed location for this project is in Port Kalama, Washington.Energy Northwest submitted a confidential application to the DOE for ITCs under this portionof the Act for that portion of the plant which would not be owned by public power entities.Section 413 of EPAct also authorizes, subject to appropriations, funding support for a demonstrationproject to be built in the Western U.S. The Wyoming Infrastructure Authority (WIA)issued an RFP for a Wyoming Coal Gasification Demonstration Project on July 17, 2006. TheWIA’s intent for this RFP process was to identify one or more Wyoming based projects for thepurpose of seeking Section 413 funding. <strong>PacifiCorp</strong> provided an expression of interest in responseto this RFP on August 17, 2006, followed by a confidential proposal to the WIA in October2006. As described in Chapter 5, the WIA recently selected <strong>PacifiCorp</strong> to participate in thejoint IGCC project.In addition to the ITC programs available for qualifying IGCC or advanced clean coal technologies,the EPAct makes available $350 million for ITCs for qualifying industrial gasification projects(not necessarily for power generation).Title XVII of the EPAct provides for loan guarantees for innovative technologies, such as(IGCC) or technologies that reduce or sequester pollutants or greenhouse gases. <strong>PacifiCorp</strong> hasreviewed the potential application of loan guarantees for potential IGCC projects under considerationand has determined that loan guarantees provide little value to the company and wouldentail significant regulatory complications.Renewable Energy ProvisionsThe renewable energy production tax credit (PTC), which was set to expire at the end of 2005,was extended through the end of <strong>2007</strong>. (The U.S. Congress extended it again through the end of2008 as part of the Tax Relief and Health Care Act of 2006.) Additionally, the eligibility periodfor power production from open-loop biomass, geothermal, small irrigation, landfill gas and municipalsolid waste projects is increased from 5 to 10 years. Finally, incremental hydropower50
<strong>PacifiCorp</strong> – <strong>2007</strong> IRPChapter 3 – The <strong>Plan</strong>ning Environmentproduction resulting from efficiency improvements or capacity expansion at existing dams wasadded to the list of production technologies eligible for the PTC.<strong>PacifiCorp</strong> expects that extension of the PTC should aid the procurement of new wind and otherrenewable resources with a relatively short development lead-time. Nevertheless, dependence onyear-to-year extensions represents a significant challenge for developing renewable resourceswith longer design/procure/construction periods, such as geothermal projects. Given the uncertainfuture of the PTC, <strong>PacifiCorp</strong>, along with other utilities, is attempting to acquire as mucheconomic renewables as possible prior to the expiration date.HydropowerThe bill includes a major reform of the federal licensing procedure for hydroelectric dams. Themodifications allow an applicant to propose an alternative to mandatory conditions placed onhydropower licenses by federal resource agencies (Departments of Interior, Commerce and Agriculture).If a proposed alternative met the statutory environmental and resource protection standards,the alternative would be accepted. Hydro licensing reform has been a goal of the industryfor years, but has been highly controversial with the environmental community.The bill also includes incentives for improving the efficiency of existing hydroelectric dams andfor modifying existing dams to produce electricity. (See Renewable Energy Provisions, above.)Public Utility Regulatory Policies Act ProvisionsThe bill establishes market conditions necessary to eliminate the Public Utility Regulatory PoliciesAct’s (PURPA) mandatory purchase obligation. The EPAct also includes amendments thatestablish market conditions that eliminate the requirement for utilities to buy power from independentrenewable energy and cogeneration plants where FERC determines that competitivemarket conditions exist, and revises the criteria for new qualifying facilities seeking to sell powerunder the mandatory purchase obligation. Unfortunately, competitive markets may not supportthe long-term contracts that many renewable generators need to secure financing at affordablerates.Title XII of EPAct also amends a section of PURPA by adding five new ratemaking standardsfor electric utilities. State regulatory commissioners are to determine whether the new standardsare appropriate for their states. The five standards include net metering, fuel source diversity,fossil fuel generation efficiency and interconnection service to customers with their own on-sitegenerating facilities.Metering ProvisionsSection 1252, “Smart Metering”, of the EPAct requires that all utilities provide a time-based rateto all customer classes within 18 months of the enactment. In all states, <strong>PacifiCorp</strong> has met thebasic requirements of the EPAct in regards to time-based rate schedule offerings.Furthermore, the EPAct requires state commissions to conduct an investigation as to whether atime-based rate schedule and accompanying meter equipment is appropriate to implement andinstall within 18 months after date of enactment. The following time-based rates must be considered:51
<strong>PacifiCorp</strong> – <strong>2007</strong> IRPChapter 3 – The <strong>Plan</strong>ning Environment• “Time-of-use pricing” – Prices for specific periods and typically changed twice a year• “Critical peak pricing” – Prices for peak days, discounts for reducing peak period consumption• “Real-time pricing” – Prices may change hourly• “Credits” – Large load customers who reduce a utility’s planned capacity obligations<strong>PacifiCorp</strong> has actively participated in all requested state commission investigations and/or technicalconferences. These meetings must be completed by February <strong>2007</strong> with the commissionrecommendations provided by August <strong>2007</strong>.Section 110, “Daylight Savings”, amends the Uniform Time Act of 1966 by extending DaylightSavings Time (DST) by four weeks beginning in <strong>2007</strong>. DST will begin the second Sunday ofMarch and end the first Sunday of November. This section also requires the Department of Energyto file a report to Congress nine months after enactment on the impact of this section onenergy consumption in the U.S. Congress retains the right to revert DST back to the 2005 timeonce the report is complete.To meet the requirements of Section 110, all of <strong>PacifiCorp</strong>’s time-of-use and interval meterswould be required to be replaced and/or reprogrammed to align the internal calendars with thenew dates. With the possibility of Congress reverting to 2005 time, the exposure for cost to reprogramthe meters is significant.To mitigate the costs of meter replacement and programming until such time as a formal decisionis made, <strong>PacifiCorp</strong> has filed, or will be filing, interim tariff modifications in all states. If accepted,the modifications will keep the existing 2005 DST dates within the applicable tariffs untilsuch time that a formal decision is made. <strong>PacifiCorp</strong> will comply with the requirements of thedecision at that time.Fuel Source DiversitySection 111(d)(12), “Fuel Sources”, requires electric utilities to develop “a plan to minimize dependenceon 1 fuel source and to ensure that the electric energy it sells to consumers is generatedusing a diverse range of fuels and technologies, including renewable technologies.” Within threeyears of enactment, state regulatory authorities must decide whether to enact this standard ordetermine that a comparable standard meets this objective.During 2006, <strong>PacifiCorp</strong> reviewed this amendment with states and other interested partiesthrough technical conferences sponsored by the state commissions. <strong>PacifiCorp</strong> believes that thestate IRP standards and guidelines reflect a comparable standard that fulfills the requirement fora fuel source diversity plan. The Public Service Commission of Utah concurred with this view,issuing a determination that the current Utah IRP guidelines constitute a comparable standard. 23During the October 17, 2006 technical conference, the company agreed to include a section inthe IRP that discusses how fuel diversity is addressed in the planning process. This section isincluded in Chapter 8, “Action <strong>Plan</strong>.”23 Public Service Commission of Utah, “Determination Concerning the PURPA Fuel Sources Standard” (Docket No.06-999-03), issued March 13, <strong>2007</strong>.52
<strong>PacifiCorp</strong> – <strong>2007</strong> IRPChapter 3 – The <strong>Plan</strong>ning EnvironmentFossil Fuel Generation Efficiency StandardThe PURPA amendments include a requirement that each electric utility develop and implementa 10-year plan to increase the efficiency of its fossil fuel generation plants. States must determinewhether to adopt this standard by August 8, 2008. States do not have to comply if the statehas already adopted or considered a comparable provision. 24 <strong>PacifiCorp</strong> has been reviewing thisamendment with states and other interested parties through technical conferences sponsored bythe state commissions. <strong>PacifiCorp</strong> believes that the IRP currently serves as a comparable provisionwith respect to fleet efficiency improvements arising from new generation and retirement ofold, less efficient fossil units.In discussions with Utah Public Service Commission staff, <strong>PacifiCorp</strong> agreed to report in thisIRP the 20-year forecasted average heat rate trend for the company’s fossil fuel generator fleet.This forecasted average heat rate represents the individual generator heat rates weighted by theirannual generation, accounting for new IRP resources and current planned retirements of existingfossil fuel generators. For existing fossil fuel resources, four-year average historical heat ratecurves are used, whereas new resources use expected heat rates accounting for degradation overtime. This fleet-wide heat rate trend information is provided in Figure 7.34 in Chapter 7, “Results.”In <strong>PacifiCorp</strong>’s subsequent integrated resource plans, the company will summarize its efficiencyimprovement plans, as well as report heat rate trends using forward-looking heat rates that accountfor these plans.Transmission and Electric Reliability ProvisionsThis portion of the EPAct is intended to:• Help ensure that consumers receive electricity over a dependable, modern infrastructure;• Remove outdated obstacles to investment in electricity transmission lines;• Make electric reliability standards mandatory instead of optional; and• Give Federal officials the authority to site new power lines in DOE-designated nationalcorridors in certain limited circumstances.Two sections of this legislation pertain specifically to the development of major new transmissionlines: Section 368a, which defines “energy corridors”, and Section 1221, which attempts toidentify and address transmission congestion.Section 368a, Energy CorridorsSection 368a directs the Secretaries of Agriculture, Commerce, Defense, Energy, and the Interior(the Agencies) to designate under their respective authorities corridors on Federal land in the 11Western States for oil, gas and hydrogen pipelines and electricity transmission and distributionfacilities (energy corridors). The legislation sets the timetable for corridor designation in theeleven Western States at no later than two (2) years after enactment, or August <strong>2007</strong>.24 Edison Electric Institute, Energy Policy Act of 2005, Summary of Title XII – Electricity, Title XVIII – Studies, andRelated Provisions (August 3, 2005), page 10.53
<strong>PacifiCorp</strong> – <strong>2007</strong> IRPChapter 3 – The <strong>Plan</strong>ning EnvironmentThe Agencies determined that designating corridors as required by Section 368a of the Act constitutesa major Federal action which may have a significant impact upon the environment withinthe meaning of the National Environmental Policy Act (NEPA). For this reason, the Agencies arepreparing a draft Programmatic Environmental Impact Statement (PEIS) to identify the impactsassociated with designating energy corridors. Based upon the information and analyses developedin the PEIS, the Agencies will designate energy corridors by amending their respective landuse plans.Public scoping meetings were held in October and November 2005. Potential energy corridorlocations were depicted on draft maps and circulated for comment (See the following DOE website for these maps: http://corridoreis.anl.gov/eis/pdmap/index.cfm). The draft PEIS was releasedfor comments last fall. Final energy corridors will be identified in the final EIS which is scheduledto be released in August <strong>2007</strong>. The majority of the preliminary energy corridors utilize existingcorridors and/or rights-of-way; however, there are a small number of potential new corridorlocations.Section 1221, National Transmission Congestion StudySection 1221 of the EPAct of 2005 required DOE to issue a national transmission congestionstudy for comment by August 2006 and every three years thereafter. Based on the study and publiccomments, DOE may designate selected geographic areas as "National Interest ElectricTransmission Corridors." Applicants for projects proposed within designated corridors that arenot acted upon by state siting authorities within one year may request FERC to exercise federal"backstop" siting authority. For the Western Interconnection, DOE relied on the Western CongestionAssessment Task Force (WCATF), which is an ad-hoc group formed primarily byWECC members, to complete the congestion study. The WCATF produced several work productsfor DOE including a summary of major studies, a report describing historical congestion,and the results of SSG-WI production cost studies conducted for the years 2008 and 2015. Figure3.2 is a map provided to DOE showing the major areas of congestion in the Western Interconnection.Based on the WCATF report and other information, the DOE produced a national transmissioncongestion report that shows congested areas across the Western Interconnection. The only criticalcongestion area highlighted in the Western Interconnection was in southern California. Inaddition to the congestion in southern California, it was noted that there are conditional constraintsin the <strong>PacifiCorp</strong> area in association with exporting potential new coal and wind resourcesfrom the states of Montana and Wyoming (See Figure 3.3)The effect of Section 1221 on <strong>PacifiCorp</strong> is unclear at this point, but it is expected to be beneficialas it should speed up the permitting process for new transmission facilities.54
<strong>PacifiCorp</strong> – <strong>2007</strong> IRPChapter 3 – The <strong>Plan</strong>ning EnvironmentFigure 3.2 – Western Interconnection Transmission Congestion Areas/PathsSource: Western Congestion Analysis Task Force, Western Interconnection Congestion Areas: Summary Tables 1, 2and 3 with Congestion Area Map, prepared for the U.S. Department of Energy, <strong>May</strong> 8, 2006.55
<strong>PacifiCorp</strong> – <strong>2007</strong> IRPChapter 3 – The <strong>Plan</strong>ning EnvironmentFigure 3.3 – Conditional Constraint AreasSource: U.S. Department of Energy, National Electric Transmission Congestion Study, August,2006.Climate ChangeThe EPAct established a Climate Change Technology Advisory Committee to identify statutory,regulatory, economic and other barriers to the commercialization and deployment of technologiesand practices that would reduce the intensity of greenhouse gas production. Additionally,the new law directs the State Department to act as lead agency for integrating into U.S. foreignpolicy the goal of reducing greenhouse gas intensity in developing countries, and directs DOE toconduct an inventory of greenhouse gas intensity reducing technologies for transfer to developingcountries.56
<strong>PacifiCorp</strong> – <strong>2007</strong> IRPChapter 3 – The <strong>Plan</strong>ning EnvironmentRECENT RESOURCE PROCUREMENT ACTIVITIESSupply-Side <strong>Resource</strong>s2012 Request for Proposals for Base Load <strong>Resource</strong>sAs a consequence of the update to the 2004 <strong>Integrated</strong> <strong>Resource</strong> <strong>Plan</strong> (filed in November 2005),<strong>PacifiCorp</strong> suspended the 2009 Request for Proposal and is preparing a new RFP for acquisitionof east-side base load resources for 2012, 2013, and 2014.The base load RFP seeks to acquire up to 1,700 megawatts of cost-effective resources for theterm of 2012 through 2014, consisting of a combination of generation assets, generation assetson the company’s sites and market purchases (i.e., front office transactions). 25 The company hasincluded two benchmark resources in the RFP. The benchmark resource for 2012 is 340 megawatts,representing the Intermountain Power <strong>Plan</strong>t Unit 3 and the benchmark resource for 2014 is575 megawatts, representing Bridger 5. The company issued its base load RFP on April 5, <strong>2007</strong>.Renewables Request for Proposal 2003B<strong>PacifiCorp</strong> amended the renewables Request for Proposal 2003B in March 2006 to assist inmeeting renewable procurement targets, including those related to the MidAmerican transactioncommitment to acquire economic renewable resources. As a result of the bids received, Pacifi-Corp considered nearly twenty competing offers.Demand-side <strong>Resource</strong>sThe 2005 DSM RFP to procure Class 1, 2 and 3 resources was issued according to the actionplan in the 2004 IRP (See 2004 IRP, Table 9.3). The RFP was structured to solicit proposals forboth specific resources types—for example, comprehensive residential equipment and serviceprogram—as well as an “all comers” request for each resource type. The most notable programaddition originating from the 2005 DSM RFP is the Home Energy Savers program, filed andapproved in 2006 in Idaho, Washington and Utah, and, pending commission approval, to be offeredin California and Wyoming in <strong>2007</strong>. The company also accepted a proposal to enhancebusiness program penetration of the new construction market. In addition, there remain a selectfew program proposals from the 2005 DSM RFP that may be pursued provided the Companyreceives supporting information through their system-wide demand-side management potentialstudy indicating that sufficient opportunity, customer interest, and delivery price points exist tosupport the proposals. The system-wide demand-side management potential study, a Mid-American Energy Holdings Company commitment made during its acquisition of <strong>PacifiCorp</strong> inMarch 2006, is scheduled to be completed in June <strong>2007</strong>. The Company intends to use the informationfrom this study to assist in the refinement of their current demand-side programs (expandand improve their performance) as well as identify additional cost-effective and system relevantprogram opportunities across all program types, e.g., energy efficiency, demand control or management,and demand response.25 The RFP covers power purchase agreements, tolling service agreements, asset purchases, load curtailment contracts,and Qualifying Facility contracts. See Chapter 4, Action <strong>Plan</strong>, for more details concerning the Base LoadRFP.57
<strong>PacifiCorp</strong> – <strong>2007</strong> IRPChapter 3 – The <strong>Plan</strong>ning EnvironmentTHE IMPACT OF STATE RESOURCE POLICIES ON SYSTEM-WIDE PLANNINGA new planning issue that <strong>PacifiCorp</strong> is dealing with for this IRP cycle is the rapid evolution ofstate-specific resource policies that place, or are expected to place, constraints on <strong>PacifiCorp</strong>’sresource selection decisions. As discussed earlier in this chapter, these policies cover CO 2 emissions,renewable energy, energy efficiency, load control, distributed generation, and the promotionof advanced clean coal and carbon sequestration technologies. Table 3.1 represents an inventoryof state policy actions and events that occurred in 2006, and so far in <strong>2007</strong>, that impact<strong>PacifiCorp</strong>’s integrated resource planning process now and in the future.Considerable complexity is added to system-wide resource planning and the supporting modelingprocess as a result of these policies. In addition, disparate state interests, as expressed in priorIRP acknowledgement proceedings and throughout the <strong>2007</strong> IRP development cycle, complicatesthe company’s ability to address state IRP requirements to the satisfaction of all stakeholders.Table 3.1 – State <strong>Resource</strong> Policy Developments for 2006 and <strong>2007</strong>2006 <strong>2007</strong>January: Oregon PUC, in its 2004 IRP acknowledgementorder, does not acknowledgea near-term “high-capacity-factor” resource,and requires that <strong>PacifiCorp</strong> explorecoal deferral options until IGCC is commercializedJanuary: Oregon PUC rejects the 2004 IRPUpdate Action <strong>Plan</strong>February: Oregon Renewable Energy WorkingGroup is formedMarch: Oregon, California, and Washingtonjoin other petitioners in asking the U.S. SupremeCourt whether the U.S. EnvironmentalProtection Agency has the authorityto regulate carbon dioxide and other air pollutantsassociated with climatechangeApril: Idaho moratorium on coal-firedplants is issued.August: Utah Blue Ribbon Advisory Councilon Climate Change formedSeptember: California adopts a carbon cap(AB 32)January: The California PUC adopts agreenhouse gas emission performancestandard for generatorsJanuary: The Oregon PUC rejects Pacifi-Corp’s 2012 RFPJanuary: The Oregon Carbon AllocationTask Force recommends a CO 2 load-basedcap-and-trade model ruleFebruary: The Washington Governorsigns Executive Order 07-02 setting climatechange-related rules, including greenhousegas emissions capsFebruary: Washington introduces legislationsetting carbon caps and a GHG emissionsperformance standardFebruary: the Western Regional ClimateChange Action Initiative announced byCalifornia, Oregon, Washington, NewMexico, and ArizonaFebruary: Utah, Wyoming, Nevada, andNorth Dakota announce the NextGen EnergyAlliance, which is to promote ad-58
<strong>PacifiCorp</strong> – <strong>2007</strong> IRPChapter 3 – The <strong>Plan</strong>ning Environment2006 <strong>2007</strong>vanced coal technologies and economicutilization of carbon dioxideNovember: the Oregon governor announcesa renewable portfolio standard planNovember: Washington adopts a renewableportfolio standardDecember: Western Public Utility CommissionJoint Action Framework on ClimateChange (California, Oregon, Washington,New Mexico) launchedDecember: The Utah PSC issues suggestedmodifications to <strong>PacifiCorp</strong>’s 2012 base loadRFPMarch: Oregon RPS and carbon-relatedlegislation introduced (a cap and greenhousegas emissions performance standard)April: The U.S. Supreme ruled that theEPA has the authority to regulate CO 2emissions59
<strong>PacifiCorp</strong> – <strong>2007</strong> IRPChapter 4 – <strong>Resource</strong> Needs Assessment4. RESOURCE NEEDS ASSESSMENTChapter Highlights On an energy basis, <strong>PacifiCorp</strong> expects a system-wide average load growth of 2.5 percentper year from <strong>2007</strong> through 2016. Wyoming shows the largest load growth overthe <strong>2007</strong> to 2016 at 5.6 percent average annual rate. Utah load is projected to grow atan average annual rate of about 3 percent, while the other states where the company operates—Oregon,Washington, Idaho, and California—have load growth projected atabout 1 percent. System peak load is expected to grow at a faster rate than overall load due to the changingmix of appliances over time. <strong>PacifiCorp</strong>’s eastern system peak is expected to continuegrowing faster than its western system peak, with average annual growth rates of3.2 percent and 0.8 percent, respectively, over the forecast horizon. <strong>PacifiCorp</strong> anticipates a system peak resource capacity of 12,131 megawatts for thesummer of <strong>2007</strong>. Near-term resource changes include the following:– Conversion of the Currant Creek facility from a single cycle combustion turbine toa combined cycle combustion turbine (June 2006)– The addition of the Lake Side combined cycle combustion turbine (expected commercialoperation in June <strong>2007</strong>)– The addition of the Leaning Juniper 1 and Marengo wind projects– Expiration of the 400-megawatt power purchase agreement with TransAlta EnergyMarketing expires in June <strong>2007</strong>– Expiration of the 575 megawatt BPA peaking contract in August 2011– Expiration of the West Valley plant lease in <strong>May</strong> 2008 On both a capacity and energy basis, load and resource balances are calculated usingexisting resource levels, obligations, and reserve requirements. Contract expirationsalso impact these calculations. The company projects a summer peak resource deficit for the <strong>PacifiCorp</strong> system beginningin 2008 to 2010, depending on the capacity planning reserve margin assumed. Beginningin 2009, the company becomes energy deficient on an annual basis. The <strong>PacifiCorp</strong> deficits prior to 2011 to 2012 will be met by additional renewables,demand side programs, and market purchases. Then beginning in 2011 to 2012, baseload, intermediate load, or both types of resource additions will be necessary to coverthe widening capacity and energy deficits.61
<strong>PacifiCorp</strong> – <strong>2007</strong> IRPChapter 4 – <strong>Resource</strong> Needs AssessmentINTRODUCTIONThis chapter presents <strong>PacifiCorp</strong>’s assessment of resource need, focusing on the first 10 years ofthe IRP’s 20-year study period, <strong>2007</strong> through 2016. The company’s long-term load forecasts(both energy and coincident peak load) for each state and the system as a whole are addressedfirst, followed by a profile of <strong>PacifiCorp</strong>’s existing resources. Finally, load and resource balancesfor capacity and energy are presented. These balances are comprised of a year-by-year comparisonof projected loads against the resource base without new additions. This comparison indicatedwhen <strong>PacifiCorp</strong> is expected to be either deficit or surplus on both a capacity and energybasis for each year of the planning horizon.LOAD FORECASTMethodology Overview<strong>PacifiCorp</strong> estimates total load by starting with customer class sales forecasts in each state andthen adds line losses to the customer class forecasts to determine the total load required at thegenerators to meet customer demands. <strong>PacifiCorp</strong> uses different approaches in forecasting salesfor different customer classes. <strong>PacifiCorp</strong> also employs different methods to forecast the growthover different forecast horizons. Near-term forecasts rely on statistical time series and regressionmethodologies while longer term forecasts are dependent on end-use and econometric modelingtechniques. These models are driven by county and state level forecasts of employment and incomethat are provided by public agencies or purchased from commercial econometric forecastingservices. 26 Appendix A provides additional details on methodologies and state level forecasts.<strong>Integrated</strong> <strong>Resource</strong> <strong>Plan</strong>ning Load ForecastsThrough the course of the <strong>2007</strong> integrated resource planning cycle, <strong>PacifiCorp</strong> relied on two loadforecasts for the development of the load and resource balance and portfolio evaluations. Thefirst official load forecast used in this IRP cycle, released in <strong>May</strong> 2006, was used to support portfolioanalysis from <strong>May</strong> 2006 to February <strong>2007</strong>. Between <strong>May</strong> 2006 and March <strong>2007</strong>, eventstranspired that resulted in the need to revise the load forecast. Because of the magnitude of theforecast changes and the extended IRP filing schedule granted by the state commissions, thecompany decided that it was prudent to incorporate load forecast updates in the IRP. Consequently,<strong>PacifiCorp</strong>’s IRP analysis from February <strong>2007</strong> onward reflects the new March <strong>2007</strong>load forecast.The primary changes to the original <strong>May</strong> 2006 load forecast result from recent trends and conditionson the east side of <strong>PacifiCorp</strong>’s service territory. Growth in Utah was slowing from whatwas previously planned; therefore, its growth rates were reduced. This was mainly associatedwith the growth in the commercial class and a slowing of the service activity in the state. Offsettingthis were requests for service in the oil and gas industries of Wyoming. Higher prices, fuelsupply uncertainty both nationally and worldwide resulted in plans to increase the developmentof the fields in Wyoming. Additionally, portions of Wyoming are experiencing air quality problemswith existing extraction practices that require electrification of the existing services in the26 <strong>PacifiCorp</strong> relies on county and state level economic and demographic forecasts provided by Global Insight, inaddition to state office of planning and budgeting sources.62
<strong>PacifiCorp</strong> – <strong>2007</strong> IRPChapter 4 – <strong>Resource</strong> Needs Assessmentfields. The load requests from customers in these areas total over 1,000 megawatts in 2012.While these state trends largely offset each other on a total projected load basis, the revisedWyoming load growth affects the timing of the resource need. That is why the company decidedto incorporate the new load forecast in the IRP.The following sections describe the March <strong>2007</strong> energy and coincident peak load forecasts, aswell as summarize the differences with respect to the original <strong>May</strong> 2006 forecast.Energy ForecastTable 4.1 shows average annual energy load growth rates for the <strong>PacifiCorp</strong> system and individualstates. Growth rates are shown for the historical period 1995 through 2005, and the forecastperiod <strong>2007</strong> through 2016.Table 4.1 – Historical and Forecasted Average Energy Growth Rates for LoadAverage AnnualGrowth Rate Total OR WA WY CA UT ID1995-2005 1.6% 0.1% 1.4% 1.4% 1.3% 3.0% 1.3%<strong>2007</strong>-2016 2.4% 0.6% 1.3% 5.6% 1.1% 2.7% 1.0%The total net control area load forecast used in this IRP reflects <strong>PacifiCorp</strong>’s forecasts of loadsgrowing at an average rate of 2.4 percent annually from fiscal year <strong>2007</strong> to 2016. This is slightlyfaster than the average annual historical growth rate experienced from 1995 to 2005. During thishistorical period the total load for these states increased at an average annual rate of 1.6 percent.Table 4.2 shows the forecasted load for each specific year for each state served by <strong>PacifiCorp</strong>and the average annual growth (AAG) rate over the entire time period.Table 4.2 – Annual Load Growth in Megawatt-hours for 2006 and forecasted <strong>2007</strong> through2016Year Total OR WA WY CA UT ID2006 58,466,744 15,388,512 4,637,218 8,818,396 991,346 22,958,123 5,673,149<strong>2007</strong> 58,244,203 14,745,256 4,556,816 9,043,776 944,252 23,407,514 5,546,5892008 60,003,127 14,774,141 4,577,294 10,035,331 948,959 24,070,475 5,596,9272009 61,824,270 14,813,056 4,608,889 11,157,044 953,801 24,653,183 5,638,2972010 63,939,431 14,927,068 4,821,004 12,019,398 979,509 25,494,009 5,698,4432011 65,638,416 15,041,955 4,900,526 12,842,214 988,843 26,114,702 5,750,1762012 67,027,436 15,157,677 4,944,106 13,347,838 998,372 26,767,715 5,811,7282013 68,<strong>30</strong>4,861 15,274,258 4,988,967 13,718,417 1,008,170 27,453,851 5,861,1982014 69,525,861 15,391,817 5,033,291 13,991,101 1,018,178 28,175,184 5,916,2902015 70,776,423 15,510,250 5,077,689 14,245,983 1,028,365 28,938,113 5,976,0232016 72,<strong>30</strong>5,522 15,629,572 5,125,690 14,712,173 1,038,612 29,745,665 6,053,810AAG<strong>2007</strong>-2016AAG2016-20262.4% 0.6% 1.3% 5.6% 1.1% 2.7% 1.0%2.0% 1.3% 1.3% 2.0% 1.6% 2.7% 1.1%63
<strong>PacifiCorp</strong> – <strong>2007</strong> IRPChapter 4 – <strong>Resource</strong> Needs AssessmentAs can be seen from the average annual growth rates at the bottom of the Table 4.2, the easternsystem continues to grow faster than the western system, with an average annual growth rate of3.2 percent and 0.8 percent, respectively, over the forecast horizon.System-Wide Coincident Peak Load ForecastThe system peaks are the maximum load required on the system in any hourly period. Forecastsof the system peak for each month are prepared based on the load forecast produced using themethodologies described in Appendix A. From these hourly forecasted values, forecast peaksfor the maximum usage on the entire system during each month (the coincidental system peak)and the maximum usage within each state during each month are extracted.The system peak load is expected to grow from the 2005 peak of 8,937 megawatts at a faster ratethan overall load due to the changing mix of appliances over time. Table 4.3 shows that for thesame time period the total peak is expected to grow by 2.6 percent. The system peak, which previouslyoccurred in the winter, has switched to the summer as a result of these changes in appliancemix. The change in seasonal peak is due to an increasing demand for summer space conditioningin the residential and commercial classes and a decreasing demand for electric relatedspace conditioning in the winter. This trend in space conditioning is expected to continue. Therefore,the disparity in summer and winter load growth will result in system peak demand growingfaster than overall load. However, once the demand in space conditioning equipment stabilizes,the total load and system peak growth rates should equalize.Table 4.3 – Historical and Forecasted Coincidental Peak Load Growth RatesAverage AnnualGrowth Rate Total OR WA WY CA UT ID1995-2005 1.9% (1.1)% (1.0)% (0.9)% 1.9% 7.3% 5.8%<strong>2007</strong>-2016 2.6% 1.2% 1.2% 5.8% 1.2% 2.9% 1.2%Again, <strong>PacifiCorp</strong>’s eastern system peak is expected to continue growing faster than its westernsystem peak, with average annual growth rates of 3.2 percent and 1.2 percent, respectively, overthe forecast horizon. This is similar to historical growth patterns as Table 4.3 reflects. East systempeak growth during this time has been faster than west system peak growth. Of course, peakgrowth is somewhat masked in Table 4.3 if you consider that the peak has shifted from wintermonths to summer months.Table 4.4 shows the average annual coincidental peak growth occurring in the summer monthsfor 1995 through 2005. This shows that some of what appears to be a decrease in peak load inmany states is due to the shift from winter to summer, and that growth in peak is truly occurring.It also shows that faster growth is continuing to occur in the eastern portion of the system whereaverage historical growth has been 2.8 percent, while the western portion of the system grew at1.1 percent on average. This pattern is expected to continue as discussed previously.64
<strong>PacifiCorp</strong> – <strong>2007</strong> IRPChapter 4 – <strong>Resource</strong> Needs AssessmentTable 4.4 – Historical Coincidental Peak Load - SummerAverage AnnualGrowth Rate Total OR WA WY CA UT ID1995-2005 2.2% 0.8% 1.7% 0.0% 2.2% 5.2% 1.5%The system peak load is expected to grow at a slightly faster rate than the overall load due to thechanging mix of appliances over time. Table 4.5 below shows that for the same time period thetotal peak is expected to grow by 2.6 percent. Until recently, the system peak occurred in thewinter months. Due to a changing appliance mix from an increasing demand for summer spaceconditioning in the residential and commercial classes, and a reduction in electric related spaceconditioning in winter months, the system peak has started occurring in summer months. Pacifi-Corp expects this condition to continue. Therefore, the increasing summer load and decreasingwinter loads are expected to result in a faster growing system peak than total load until changesin space conditioning equipment mix ends.Table 4.5 – Forecasted Coincidental Peak Load in MegawattsYear Total OR WA WY CA UT ID SE-ID2006 9,577 2,684 816 1,094 156 4,011 561 256<strong>2007</strong> 9,243 2,076 699 1,044 147 4,298 632 3472008 9,440 2,075 702 1,145 147 4,409 631 3312009 9,752 2,235 702 1,282 159 4,420 678 2762010 10,261 2,254 729 1,416 141 4,720 696 <strong>30</strong>52011 10,488 2,314 757 1,473 128 4,932 573 3112012 10,836 2,320 766 1,569 155 4,973 686 3672013 10,989 2,328 767 1,613 156 5,061 693 3712014 11,157 2,331 773 1,648 158 5,184 708 3552015 11,296 2,326 774 1,669 171 5,337 719 <strong>30</strong>02016 11,619 2,314 775 1,733 163 5,547 745 342AAG<strong>2007</strong>-2016 2.6% 1.2% 1.2% 5.8% 1.2% 2.9% 1.8% -0.2%AAG2016-2026 2.2% 1.5% 1.6% 1.9% 0.4% 2.9% 1.4% 1.0%One noticeable aspect of the states contribution to the system coincidental peak forecast is thatthey do not continuously increase from year to year, even though the total system peak and eachstate’s individual peak loads generally increase from year to year. This behavior occurs becausestate level coincident peaks do not occur at the same time as the system level coincident peak,and because of differences among the states with regard to load growth and customer mix. Whileeach state’s peak load is forecast to grow each year when taken on its own, its contribution to thesystem coincident peak will vary since the hour of system peak does not coincide with the hourof peak load in each state. As the growth patterns of the class and states change over time, thepeak will move within the season, month or day, and each state’s contribution will move accordingly,sometimes resulting in a reduced contribution to the system coincident peak from year toyear in a particular state. This is seen in a few areas in the forecast as well as experienced in history.For example, the Idaho state load is driven in the summer months by the activity in the irrigationclass. The planting and irrigating practices usually cause this state to experience the65
<strong>PacifiCorp</strong> – <strong>2007</strong> IRPChapter 4 – <strong>Resource</strong> Needs Assessmentmaximum load in late June or early July. This load then quickly decreases week by week. Consequently,there can be as much as 150 megawatts of load difference between the maximum loadand the loads during the last weeks of July. This anomaly can be seen when comparing the Idahocontribution to the system coincident peak in 2010 and 2011.Another noticeable aspect is the decline in the loads from the actual period to the first forecastyear. This is noticeable in Oregon when the <strong>2007</strong> is compared to the 2006 value. There may beseveral things that can impact this. In the Oregon case, a large industrial customer is expected tocease operations during <strong>2007</strong>. This large customer and the associated multiplier effect of thiscustomer will cause a decline in load for Oregon. Other factors contributing to the decline includethe changing time of the system peak demand in <strong>2007</strong>, variability in jurisdictional contributionto the peak demand over time, and weather effects to the Oregon contribution in 2006.Jurisdictional Peak Load ForecastThe economies, industry mix, appliance and equipment adoption rates, and weather patterns aredifferent for each jurisdiction that <strong>PacifiCorp</strong> serves. Because of these differences the jurisdictionalhourly loads have different patterns than the system coincident hourly load. In addition,the growth for the jurisdictional peak demands can be different from the growth in the jurisdictionalcontribution to the system peak demand. Table 4.6 reports the historical growth rates foreach of the jurisdictional peak demands, while Table 4.7 reports the jurisdictional peak demandgrowth over the forecast horizon.Table 4.6 – Historical Jurisdictional Peak LoadAverage AnnualGrowth Rate OR WA WY CA UT ID1995-2005 0.6% 0.7% -0.4% 0.6% 4.4% 1.9%Table 4.7 – Jurisdictional Peak Load in Megawatts for 2006 and forecast <strong>2007</strong> through2016Year OR WA WY CA UT ID2006 2,7<strong>30</strong> 818 1,208 179 4,357 723<strong>2007</strong> 2,393 751 1,185 191 4,347 6782008 2,405 744 1,372 190 4,409 6802009 2,457 750 1,572 194 4,483 7362010 2,455 782 1,627 199 4,791 7552011 2,472 795 1,681 201 4,932 7702012 2,536 807 1,757 200 5,044 7472013 2,533 807 1,778 205 5,172 7572014 2,541 805 1,817 207 5,267 7702015 2,552 808 1,844 209 5,416 7802016 2,536 803 1,908 208 5,658 81166
<strong>PacifiCorp</strong> – <strong>2007</strong> IRPChapter 4 – <strong>Resource</strong> Needs AssessmentYear OR WA WY CA UT IDAAG<strong>2007</strong>-2016 0.6% 0.7% 5.4% 1.0% 3.0% 2.0%AAG2016-2026 1.4% 1.5% 1.9% 1.8% 3.0% 0.9%Additional detailed information about the load forecast can be found in Appendix A, Base Assumptions.<strong>May</strong> 2006 Load Forecast ComparisonTables 4.8 and 4.9 show the respective state annual peak load and energy differences betweenthe March <strong>2007</strong> forecast and those for the <strong>May</strong> 2006 forecast. The impacts of slowing serviceactivity in Utah and greater forecasted demand in Wyoming mentioned above are evident forboth capacity and energy trends. For example, Utah continues to have one of the strongesteconomies in the nation and will likely continue to do so; however, there have been subtle signsof some slowing of very robust growth. As published in the Salt Lake City Tribune 27 , the UtahDepartment of Workforce Services reported job growth of 4.5 percent for the year that ended inMarch <strong>2007</strong>, which is down significantly from a peak of 5.4 percent in June 2006. An additionalindicator of slightly slowing growth is in residential building permits in Utah, which declined by6.9 percent in 2006 from the 2005 level. Statistics from the Bureau of Economic and BusinessResearch at the University of Utah continue to show slowing when compared to 2006 throughFebruary <strong>2007</strong>. This trend is also evident in <strong>PacifiCorp</strong> sales growth in Utah from 2006 into<strong>2007</strong>. Taken together, these trends helped drive the slight slowing of the peak growth from a 3.0percent average annual growth rate from <strong>2007</strong> to 2016 in the <strong>May</strong> 2006 forecast to a 2.9 percentaverage annual growth in the March <strong>2007</strong> forecast. From an energy perspective, the averageannual load growth rate from 3.0 percent in the <strong>May</strong> 2006 forecast decreased to a 2.7 percentaverage annual growth rate for <strong>2007</strong> to 2016 in the March <strong>2007</strong> forecast.Regarding the energy forecast difference for Oregon, the March <strong>2007</strong> forecast is based on anexpected lower growth rate for residential electric heating usage. This lower usage is causing animpact on energy while the coincident peak demand remains relatively unchanged. In addition,long-term industrial retail sales are expected to be lower due to a further deterioration in the paperproducts and lumber industries in the west. This deterioration has less of an impact on peak,weather responsive demand than on total energy.Table 4.8 – Changes from <strong>May</strong> 2006 to March <strong>2007</strong>: Forecasted Coincidental Peak Load(Megawatts)Year Total OR WA WY CA UT ID<strong>2007</strong> (182) 1 (41) (76) (2) (43) (21)2008 (338) (36) (36) (23) (4) (216) (23)2009 (273) 24 6 (107) 13 (254) 4527 Mitchell, Lesley. “Utah's job growth rate stays ahead of nation.” Salt Lake City Tribune. April 17, <strong>2007</strong>.http://www.sltrib.com/search/ci_569149967
<strong>PacifiCorp</strong> – <strong>2007</strong> IRPChapter 4 – <strong>Resource</strong> Needs AssessmentYear Total OR WA WY CA UT ID2010 17 72 48 (17) 13 (53) (46)2011 7 19 50 1 (21) (13) (29)2012 213 78 75 88 14 22 (64)2013 170 57 69 115 14 (20) (65)2014 140 36 67 140 14 (56) (61)2015 82 (33) 49 165 16 (167) 522016 105 (104) 40 204 6 (140) 99AAG<strong>2007</strong>-2016 0.3% (0.5)% 1.2% 2.3% 0.6% (0.2)% 2.0%AAG2016-2026 (0.3)% 0.5% 0.1% 0.8% (1.6)% (0.9)% (0.1)%Table 4.9 – Changes from <strong>May</strong> 2006 to March <strong>2007</strong>: Forecasted Load Growth(Average Megawatts)Year Total OR WA WY CA UT ID<strong>2007</strong> (49) 1 4 (21) (1) (25) (8)2008 (101) (34) 7 1 (1) (67) (7)2009 (70) (12) (9) 26 (1) (62) (13)2010 (4) (20) 12 80 1 (65) (12)2011 60 (26) 18 152 1 (75) (10)2012 74 (33) 18 192 1 (93) (11)2013 84 (40) 19 222 0 (107) (11)2014 85 (47) 19 242 0 (117) (12)2015 109 (55) 19 277 0 (121) (11)2016 128 (67) 17 315 (0) (126) (12)AAG<strong>2007</strong>-2016 0.3% (0.4)% 0.3% 2.6% 0.0% (0.3)% (0.1)%AAG2016-2026 0.1% 0.0% (0.1)% 1.0% (0.2)% 0.0% (0.2)%EXISTING RESOURCESIn <strong>2007</strong> <strong>PacifiCorp</strong> owns, or has interest in, resources with a system peak capacity of 12,131megawatts. Table 4.10 provides anticipated system peak capacity ratings by resource category asof July <strong>2007</strong>.Table 4.10 – Capacity Ratings of Existing <strong>Resource</strong>s<strong>Resource</strong> Type MW* PercentPulverized Coal 6,097 50.3%Purchases** 1,836 15.1%Gas-CCCT 1,698 14.0%68
<strong>PacifiCorp</strong> – <strong>2007</strong> IRPChapter 4 – <strong>Resource</strong> Needs Assessment<strong>Resource</strong> Type MW* PercentGas-SCCT 385 3.2%Hydroelectric 1,556 12.8%Interruptible 233 1.9%Renewable*** 173 1.4%Class 1 DSM 153 1.3%Total 12,131 100%* Represents the capacity available at the time of system peak.** Purchases constitute contracts that do not fall into other categoriessuch as hydroelectric, renewables, and natural gas.*** Renewables capacity reflects the capacity contribution at the timeof peak load.Thermal <strong>Plan</strong>tsIn June 2006, the company converted the Currant Creek facility from a single cycle combustionturbine to a combined cycle combustion turbine, which increased the capability of the plant by231 megawatts. The Lake Side combined cycle combustion turbine is expected to begin commercialoperation in June <strong>2007</strong>, adding 535 megawatts of additional capacity to the system. Thelease for the West Valley plant expires in <strong>May</strong> 2008, reducing the company’s total thermal plantcapacity by 202 megawatts. Appendix A, Table A.12, provides operational characteristics ofthermal plants and other generation resources for which <strong>PacifiCorp</strong> has an ownership interest.Renewables<strong>PacifiCorp</strong> is committed to renewable energy resources as a viable, economic and environmentallyprudent means of generating electricity. <strong>PacifiCorp</strong>’s renewable resources, presented byresource type, are described below.Wind<strong>PacifiCorp</strong> acquires wind power from <strong>PacifiCorp</strong>-owned wind plants and various purchaseagreements. For the year ended December 31, 2006, <strong>PacifiCorp</strong> received 118,610 megawatthoursfrom an owned wind project. In the same period, 394,973 megawatt-hours were purchasedfrom other wind projects.Since the 2004 <strong>Integrated</strong> <strong>Resource</strong> <strong>Plan</strong>, <strong>PacifiCorp</strong> has acquired large wind resources at LeaningJuniper 1 in Oregon (100.5 megawatts) and Marengo (140.4 megawatts) in Washington.Leaning Juniper was acquired in November 2006, while Marengo is expected to come on line in<strong>2007</strong>. The company also entered into a 20-year power purchase agreement for the total output atthe Wolverine Creek plant in Idaho (64.5 megawatts).<strong>PacifiCorp</strong> also has wind integration, storage and return agreements with Bonneville Power Administration,Eugene Water and Electric Board, Public Service Company of Colorado, and SeattleCity Light. For the year ended December 31, 2006, electricity under these agreements totaled552,835 megawatt-hours in addition to the wind energy generated or purchased for <strong>PacifiCorp</strong>’sown use.69
<strong>PacifiCorp</strong> – <strong>2007</strong> IRPChapter 4 – <strong>Resource</strong> Needs AssessmentGeothermal<strong>PacifiCorp</strong> owns and operates the Blundell Geothermal <strong>Plan</strong>t in Utah, which uses naturally createdsteam to generate electricity. The plant has a net generation capacity of 23 megawatts.Blundell is a fully renewable, zero-discharge facility. The bottoming cycle, which will increasethe output by 11 megawatts, is currently under construction and is expected to be in service bythe end of <strong>2007</strong>.BiomassSince the 2004 IRP, <strong>PacifiCorp</strong> has acquired power through power purchase agreements, as wellas from several small biomass facilities under Qualifying Facility Agreements. Examples includethe 20 megawatt Roseburg Lumber power purchase agreement and the 10 megawatt Freres Lumberpower purchase agreement.Solar<strong>PacifiCorp</strong> has invested in Solar II, the world’s largest solar energy plant, located in the MojaveDesert, and continues to assess the economic viability of such solar resources. At present, absentstate-specific incentives, central-station solar resources continue to appear uneconomic whencompared to other renewable resource alternatives. However, advances in solar technology canreasonably be expected to continue, and state-specific incentives may result in economic projectsfor consideration.Regarding distributed photovoltaic (PV) applications, the company has installed panels of photovoltaic(PV) cells in its service area, including The High Desert Museum in Bend Oregon,<strong>PacifiCorp</strong> office in Moab, Utah, an elementary school in Green River, Wyoming, and hasworked with Jackson County Fairgrounds and the Salt Palace in Salt Lake City, Utah on photovoltaicsolar panels. Other locations in the service territory with solar include a 60 unit apartmentin Salt Lake City, Utah and the North Wasco School district at Mosier, Oregon. Currently, thereare 410 net meters throughout the company, mostly residential, and most have solar technologyfollowed by wind and hydroelectric.Hydroelectric Generation<strong>PacifiCorp</strong> owns or purchases 1,556 megawatts of hydroelectric generation. These resourcesaccount for approximately 13 percent of <strong>PacifiCorp</strong>’s total generating capability, in addition toproviding operational benefits such as flexible generation, spinning reserves and voltage control.Hydroelectric plants are located in California, Idaho, Montana, Oregon, Washington, Wyoming,and Utah.The amount of electricity <strong>PacifiCorp</strong> is able to generate from its hydroelectric plants is dependentupon a number of factors, including the water content of snow pack accumulations in themountains upstream of its hydroelectric facilities and the amount of precipitation that falls in itswatershed. When these conditions result in above average runoff, <strong>PacifiCorp</strong> is able to generate ahigher than average amount of electricity using its hydroelectric plants. However, when thesefactors are unfavorable, <strong>PacifiCorp</strong> must rely to a greater degree on its more expensive thermalplants and the purchase of electricity to meet the demands of its customers.70
<strong>PacifiCorp</strong> – <strong>2007</strong> IRPChapter 4 – <strong>Resource</strong> Needs Assessment<strong>PacifiCorp</strong> has added approximately 10 megawatts of additional capacity to its hydroelectricportfolio since the release of the 2004 IRP. This additional capacity is the result of turbine upgradesat its J.C. Boyle hydroelectric plant.Demand-side ManagementDemand-side management programs vary in their dispatchability, reliability of results, term ofload reduction benefit and persistence over time. Each has its value and place in effectively managingutility investments, resource costs and system operations. Those that have greater persistenceand firmness (can count on them to be delivered) can be relied upon as base resources forplanning purposes; those that do not are well-suited as system reliability tools only. Reliabilitytools are used to avoid outages or high resource costs as a result of weather conditions, plantoutages, market prices, and unanticipated system failures. These programs are divided into fourgeneral classes.● Class 1 DSM: Fully dispatchable or scheduled firm – Class 1 programs are those forwhich capacity savings occur as a result of active company control or advanced scheduling.Once customers agree to participate in Class 1 DSM programs, the timing and persistence ofthe load reduction is involuntary on their part within the agreed limits and parameters of theprogram. In most cases, loads are shifted rather than avoided. Examples include residentialand commercial central air conditioner load control programs (“Cool Keeper”) that are dispatchablein nature and irrigation load management and interruptible or curtailment programs(scheduled firm).● Class 2 DSM: Non-dispatchable, firm energy efficiency programs – Class 2 programs arethose for which energy and capacity savings are achieved through facilitation of technologicaladvancements in equipment, appliances, lighting and structures. These types of programsprovide an incentive to customers to replace existing customer owned facilities (or to upgradein new construction) to more efficient lighting, motors, air conditioners, insulation levels,windows, etc. Savings will endure over the life of the improvement (firm). Program examplesinclude air conditioning efficiency programs (“Cool Cash”), comprehensive commercialand industrial new and retrofit energy efficiency programs (“Energy FinAnswer”) and refrigeratorrecycling programs (“See ya later refrigerator”).● Class 3 DSM: Price responsive programs – Class 3 DSM programs seek to achieve shortduration(hour by hour) energy and capacity savings from actions taken by customers voluntarily,based on a financial incentive or penalty. Savings are measured at a customer-bycustomerlevel (via metering), and customers are compensated or charged in accordance witha program’s pricing parameters. As a result of their voluntary nature, savings are less predictable,making them less suitable to incorporate into resource planning exercises, at least untilsuch time that their size and customer behavior profile provide sufficient information to constructa diversity factor suitable for modeling purposes. Savings endure only for the durationof the incentive offering and loads tend to be shifted rather than avoided. Program examplesinclude large customer energy bid programs (“Energy Exchange”), time-of-use pricing plans,critical peak pricing plans, and inverted tariff designs.● Class 4 DSM: Energy efficiency education and non-incentive based voluntary curtailmentprograms – These programs represent energy and capacity reductions achieved71
<strong>PacifiCorp</strong> – <strong>2007</strong> IRPChapter 4 – <strong>Resource</strong> Needs Assessmentthrough behavioral actions by customers in response to their desire to reduce their energydemands and costs, or voluntary compliance with a company request to conserve or shifttheir usage to off peak hours. Program savings are difficult to measure and aren’t activelytracked in most cases. As a result, they can’t be relied upon for planning purposes. The valueof Class 4 DSM is longer-term in nature. Class 4 programs help foster an understanding andappreciation as to why utilities seek customer participation in Class 1-3 programs. Programexamples include Utah’s PowerForward program, company brochures with energy savingstips, customer news letters focusing on energy efficiency, case studies of customer energy efficiencyprojects, and public education and awareness programs such as “Do the brightthing.”<strong>PacifiCorp</strong> has been operating successful DSM programs since the late 1980s. While the company’sDSM focus has remained strong over this time, since the 2001 western energy crisis, thecompany’s DSM pursuits have been expanded in terms of investment level, state presence,breadth of DSM resources pursued (Classes 1-4) and resource planning considerations. Companyinvestments have increased four times (from $50 million to $200 million) over the last five years(2002-2006) compared to the preceding five years (1997-2001) as the company has expandedDSM activity in the states of Utah, Washington and Idaho and transitioned existing DSM activitiesin Oregon over to the Energy Trust of Oregon.The company is currently working with the state of Wyoming on a DSM application which seeksto expand company investments in Wyoming and which was filed in December 2006 and, ispending Commission approval by <strong>May</strong> <strong>2007</strong>. Additionally, the company is working to expandDSM programs in California and is preparing a DSM application with expanded program offeringsfor filing with the California Public Utilities Commission in <strong>May</strong> <strong>2007</strong>. In addition, thecompany has recently introduced new programs such as the Home Energy Savers program inIdaho, Washington, Utah and soon Wyoming and California, as well as expanding the Idaho irrigationload management program into Utah for the <strong>2007</strong> summer season. The following representsa brief summary of the existing resources by class. Appendix A provides a detailed list ofexisting DSM programs available and resource targets for Classes 1 through 3.Class 1 Demand-side ManagementThere are currently three types of Class 1 programs in operation. Utah’s “Cool Keeper” residentialand small commercial air conditioner load control program provided nearly 80 megawatts ofdispatchable load control (at the generator) during the summer of 2006 and is expected to deliverthe anticipated 90 megawatts by summer <strong>2007</strong>. Idaho’s irrigation load management programachieved 55 megawatts of “scheduled” relief during the summer of 2006 and has recently addeda “dispatchable” event option to compliment the “scheduled” options in an effort to increase thatamount in <strong>2007</strong>. As noted above, the company has expanded the “schedule” option to Utah beginningin <strong>2007</strong>. First-year participation is expected to be modest; however, the company hopesto grow the program overtime to 15 megawatts. In addition to these two programs, the companyhas 233 megawatts of firm curtailable resources under contract with a select set of large industrialcustomers. Contracted curtailable loads are expected to increase to <strong>30</strong>8 megawatts by 2009.72
<strong>PacifiCorp</strong> – <strong>2007</strong> IRPChapter 4 – <strong>Resource</strong> Needs AssessmentClass 2 Demand-side ManagementThe cumulative historical energy and capacity savings (1992-2006) associated with Class 2 DSMresource acquisitions are over <strong>30</strong>0 average megawatts of energy and 390 megawatts respectively(at the generator). The company projects that through the 2016 planning period, existing Class 2programs will yield, on average, an additional 23 MWa and <strong>30</strong> megawatts each year in energyand capacity reductions, respectively. The company is actively seeking new Class 2 programsand improvements to existing programs in an effort to nearly double this amount, provided thoseresources can be acquired cost-effectively.Class 3 Demand-side ManagementThe company has numerous Class 3 programs currently available. They include metered time-ofdayand time-of-use pricing plans (in all states, availability varies by customer class), a seasonalinverted rate program (Utah), year-around inverted rate programs (Oregon, Washington andCalifornia) and Energy Exchange programs (Oregon, Utah and Washington). Savings associatedwith these programs are captured within the company’s load forecast, with the exception of theEnergy Exchange program. The impacts of these programs are thus captured in the integratedresource planning framework. Future savings associated with new programs, or added savings ofexisting programs, are relied upon as reliability resources as opposed to base resources. Currentsystem-wide participation in metered time-of-day and time-of-use programs exceeds 23,000 customers,up from 15,000 in 2004. Approximately 1.25 million residential customers—89% of thecompany’s residential customer base—are currently subject to inverted rate plans either seasonallyor year-around.<strong>PacifiCorp</strong> continues to evaluate Class 3 programs for applicability to long-term resource planning.As discussed in subsequent chapters, a variety of these programs were included as resourceoptions in scenario modeling.Class 4 Demand-side ManagementEducating customers regarding energy efficiency and load management opportunities is an importantcomponent of the Company’s long-term resource acquisition plan. A variety of channelsare used to educate customers including television, radio, newspapers, bill inserts, bill messages,newsletters, school education programs, and personal contact. Specific firm load reductions dueto education will show up in other Class 4 DSM program results and changes in the load forecastover time.Table 4.11 summarizes the existing DSM programs, and describes how they are accounted for asa planned resource.Table 4.11 – Existing DSM Summary, <strong>2007</strong>-2016ProgramClass1DescriptionEnergy Savings or Capacityat GeneratorIncluded as Base <strong>Resource</strong>s for<strong>2007</strong>-2016 PeriodResidential/small commercial100 MW summer peak Yesair conditioner loadcontrolIrrigation loadmanagement55 MW summer peak YesInterruptible contracts 233 MW building to <strong>30</strong>8 MW Yes73
<strong>PacifiCorp</strong> – <strong>2007</strong> IRPChapter 4 – <strong>Resource</strong> Needs AssessmentProgramClassDescriptionCompany and EnergyTrust of Oregon programs2 Historic acquisitions towards450 MWa (2004-2006 only)34Energy Savings or Capacity Included as Base <strong>Resource</strong>s forat Generator<strong>2007</strong>-2016 Periodpeak availability227 MWa and 295 MW No, captured as decrement tofuture load forecast95 MWa and 123 MW No, accounted for in load forecastingEnergy Exchange 0-65 MW No, leveraged as economic andreliability resource dependent onmarket prices/system loadsTime-based pricing MWa/MW unavailable23,000 customersNo, historical behavior captured inload forecastInverted rate pricing MWa/MW unavailable No, historical behavior captured in1.25 million residential load forecastPowerForward 0-78 MW summer peak No, leveraged as economic andreliability resource dependent onmarket prices/system loadsEnergy Education MWa/MW unavailable No, captured in load forecast overtime and other Class 1 and Class 2program resultsContracts<strong>PacifiCorp</strong> obtains the remainder of its energy requirements, including any changes from expectations,through long-term firm contracts, short-term firm contracts, and spot market purchases.Listed below are the major contract expirations occurring within the next 10 years.• The 202 megawatt West Valley lease expires in <strong>May</strong> 2008• The 400 megawatt power purchase agreement with TransAlta Energy Marketing expires inJune <strong>2007</strong>• The 575 megawatt BPA peaking contract expires in August 2011Figure 4.1 presents the contract capacity in place for <strong>2007</strong> through 2016 as of April 2006. Asshown, major capacity reductions in purchases and hydro contracts occur. (For planning purposes,<strong>PacifiCorp</strong> assumes that current Qualifying Facility and interruptible load contracts areextended to the end of the IRP study period.) Note that renewable wind contracts are shown attheir capacity contribution levels.74
<strong>PacifiCorp</strong> – <strong>2007</strong> IRPChapter 4 – <strong>Resource</strong> Needs AssessmentFigure 4.1 – Contract Capacity in the <strong>2007</strong> Load and <strong>Resource</strong> Balance3,0002,5002,000PurchaseHydroInterruptibleQFRenewableMW1,5001,0005000<strong>2007</strong> 2008 2009 2010 2011 2012 2013 2014 2015 2016Figure 4.2 shows the year-to-year changes in contract capacity. Early year fluctuations are due tochanges in short-term balancing contracts of one year or less, and expiration of the contractscited above.Figure 4.2 – Changes in Contract Capacity in the Load and <strong>Resource</strong> Balance4002000(200)MW(400)(600)(800)(1,000)(1,200)PurchaseHydroInterruptibleQFRenewable<strong>2007</strong> 2008 2009 2010 2011 2012 2013 2014 2015 201675
<strong>PacifiCorp</strong> – <strong>2007</strong> IRPChapter 4 – <strong>Resource</strong> Needs AssessmentLOAD AND RESOURCE BALANCECapacity and Energy Balance OverviewThe purpose of the load and resource balance is to compare the annual obligations for the firstten years of the study period with the annual capability of <strong>PacifiCorp</strong>’s existing resources, absentnew resource additions. This is done with respect to two views of the system, the capacity balanceand energy balance.The capacity balance compares generating capability to expected peak load at time of systempeak load hours. It is a key part of the load and resource balance because it provides guidance asto the timing and severity of future resource deficits. It was developed by first determining thesystem coincident peak load hour for each of the first ten years (<strong>2007</strong>-2016) of the planning horizon.The peak load and the firm sales were added together for each of the annual system peakhours to compute the annual peak-hour obligation. Then the annual firm-capacity availability ofthe existing resources was determined for each of these annual system peak hours. The annualresource deficit (surplus) was then computed by multiplying the obligation by the planning reservemargin, and then subtracting the result from the existing resources.The energy balance shows the average monthly on-peak and off-peak surplus (deficit) of energyover the first ten years of the planning horizon (<strong>2007</strong>-2016). The average obligation (load plussales) was computed and subtracted from the average existing resource availability for eachmonth and time-of-day period. This was done for each side of the <strong>PacifiCorp</strong> system as well as atthe system level. The energy balance complements the capacity balance in that it also indicateswhen resource deficits occur, but it also provides insight into what type of resource will best fillthe need. The usefulness of the energy balance is limited as it does not address the cost of theavailable energy. The economics of adding resources to the system are addressed with the studiesand results of those studies described in Chapters 6 and 7 respectively.Load and <strong>Resource</strong> Balance ComponentsThe capacity and energy balances make use of the same load and resource components in theircalculation. The main component categories consist of the following: existing resources, obligation,reserves, position, and reserve margin. This section provides a description of these variouscomponents.Existing <strong>Resource</strong>sThe firm capacities of the existing resources by resource category are summed to show the totalavailable existing resource capacity for the east, west and for the <strong>PacifiCorp</strong> system. A descriptionof each of the resource categories follows:● Thermal – This includes all thermal plants that are wholly-owned or partially-owned by<strong>PacifiCorp</strong>. The capacity balance counts them at maximum dependable capability at time ofsystem peak. The energy balance also counts them at maximum dependable capability, butderates them for forced outages and maintenance. This includes the existing fleet of 11 coalfiredplants, four natural gas-fired plants, and two co-generation units. These thermal re-76
<strong>PacifiCorp</strong> – <strong>2007</strong> IRPChapter 4 – <strong>Resource</strong> Needs Assessmentsources account for roughly two-thirds of the firm capacity available in the <strong>PacifiCorp</strong> system.● Hydro – This includes all hydroelectric generation resources operated in the <strong>PacifiCorp</strong> systemas well as a number of contracts providing capacity and energy from various counterparties.The capacity balance counts these resources by the maximum capability that is sustainablefor one hour at time of system peak. The energy associated with critical level streamflow is estimated and shaped by the hydroelectric dispatch from the Vista Decision SupportSystem model. Over 90 percent of the hydroelectric capacity is situated on the west side ofthe <strong>PacifiCorp</strong> system.● Demand-side Management (DSM) – There are about 160 megawatts of Class 1 demandsidemanagement programs included as existing resources. Both the capacity balance and theenergy balance count DSM programs by program capacity. DSM resources directly curtailload and thus planning reserves are not held for them.● Renewable – This category contains two geothermal plants (the existing Blundell plant withthe bottoming-cycle upgrade, and the Cove Fort project), eight existing wind projects andthree planned wind projects from the MEHC commitments. The capacity balance counts thegeothermal plants by the maximum dependable capability while the energy balance countsthe maximum dependable capability after forced outages. Project-specific capacity credits forthe wind resources were determined in a wind capacity planning contribution study (AppendixJ). Wind energy is counted according to hourly generation data used to model the projects.● Purchase – This includes all of the major contracts for purchases of firm capacity and energyin the <strong>PacifiCorp</strong> system. The capacity balance counts these by the maximum contract availabilityat time of system peak. The energy balance counts the optimum model dispatch. Purchasesare considered firm and thus planning reserves are not held for them.● Qualifying Facilities (QF) – All Qualifying Facilities that provide capacity and energy areincluded in this category. Like other power purchases, the capacity balance counts them atmaximum system peak availability and the energy balance counts them by optimum modeldispatch. It is assumed that all Qualifying Facility agreements will stay in place for the entireduration of the 20-year planning period. It should be noted that three of the Qualifying Facilityresources (Kennecott, Tesoro and US Magnesium) are considered non-firm and thus donot contribute to capacity planning.● Interruptible – There are three east-side load curtailment contracts in this category. Theseagreements with Monsanto, MagCorp and Nucor provide about <strong>30</strong>0 megawatts of load interruptioncapability at time of system peak. Both the capacity balance and energy balancecount these resources at the level of full load interruption on the executed hours. Interruptibleresources directly curtail load and thus planning reserves are not held for them.77
<strong>PacifiCorp</strong> – <strong>2007</strong> IRPChapter 4 – <strong>Resource</strong> Needs AssessmentObligationThe obligation is the total electricity demand that <strong>PacifiCorp</strong> must serve consisting of forecastedretail load and firm contracted sales of energy and capacity. The following are descriptions ofeach of these components:● Load – The largest component of the obligation is the retail loads of the load forecast. Describedin the beginning of this chapter the load forecast is an hourly description of electricloads in the <strong>PacifiCorp</strong> system for the 20-year IRP study period (<strong>2007</strong>-2026). The capacitybalance counts the load (MW) at the hour of system coincident peak load. The energy balancecounts the load as an average of monthly time-of-day energy (MWa).● Sales – This component includes all contracts for the sale of firm capacity and energy. Thecapacity balance counts these contracts by the maximum obligation at time of system peakand the energy balance counts them by optimum model dispatch. All sales contracts are firmand thus planning reserves are held for them for the capacity balance. Note that for the <strong>2007</strong>IRP there was a reporting change for the delivery portion of exchange contracts. Exchangecontract deliveries are no longer reported in the Purchase and Renewable components as wasdone for the 2004 IRP and 2004 IRP Update. These delivery amounts now appear in theSales component.ReservesThe reserves are the total megawatts of planning and non-owned reserves that must be held forthis load and resource balance. A description of the two types of reserves follows:● <strong>Plan</strong>ning reserves – This is the total reserves that must be held to provide the planning reservemargin. 28 It is the net firm obligation multiplied by the planning reserve margin as inthe following equation:<strong>Plan</strong>ning reserves = (Obligation – Purchase – DSM – Interruptible) x PRM● Non-owned reserves – There are a number of counterparties that operate in the <strong>PacifiCorp</strong>control areas that purchase operating reserves. This amounts to an annual reserve obligationof about 7 megawatts and 71 megawatts on the west and east-sides, respectively.PositionThe position is the resource surplus (deficit) resulting from subtracting the existing resourcesfrom the obligation. While similar, the position calculation is slightly different for the capacityand energy views of the load and resource balance. Thus, the position calculation for each of theviews will be presented in their respective sections.Reserve MarginThe reserve margin is the ratio of existing resources to the obligation. A positive reserve marginindicates that existing resources exceeds obligation. Conversely, a negative reserve margin indi-28 <strong>PacifiCorp</strong> models operating reserve requirements, which are based on minimum WECC Operating Reserves thatcover Contingency Reserves and Regulating Reserves. <strong>PacifiCorp</strong> also includes incremental reserves for supportingwind, which is documented in Appendix J.78
<strong>PacifiCorp</strong> – <strong>2007</strong> IRPChapter 4 – <strong>Resource</strong> Needs Assessmentcates that existing resources do not meet obligation. If existing resources equals the obligation,then the reserve margin is zero percent. It should be pointed out that the reserve margin can benegative when the corresponding position is non-negative. This is because the reserve margin ismeasured relative to the obligation, while the position is measured relative to the obligation plusreserves.Capacity Balance DeterminationMethodologyThe capacity balance is developed by first determining the system coincident peak load hour foreach of the first ten years of the planning horizon. Then the annual firm-capacity availability ofthe existing resources is determined for each of these annual system peak hours and summed asfollows:Existing <strong>Resource</strong>s = Thermal + Hydro + DSM + Renewable + Purchase + QF + InterruptibleThe peak load and firm sales are then added together for each of the annual system peak hours tocompute the annual peak-hour obligation:Obligation = Load + SalesThe amount of reserves to be added to the obligation must then be calculated. This is done byfirst removing the firm purchase and load curtailment components of the existing resources fromthe obligation. This resulting net obligation is then multiplied by the planning reserve margin.The non-owned reserves are then added to this result to yield the megawatts of required reserves.The formula for this calculation is the following:Reserves = (Obligation – Purchase – DSM – Interruptible) x PRM + Non-owned reservesFinally, the annual capacity position is then computed by adding the computed reserves to theobligation and then subtracting the existing resources as in the following formula:Capacity Position = Existing <strong>Resource</strong>s – Obligation – ReservesLoad and <strong>Resource</strong> Balance AssumptionsThe assumptions underlying the current load and resource balance are generally the same asthose from the 2004 IRP Update with a few exceptions. The following is a summary of theseassumption changes.● Front Office Transactions – For the <strong>2007</strong> IRP, front office transactions were taken out ofthe existing load and resource balance in order to treat them as potential resources that theCapacity Expansion Module can pick from. This was done in order to treat the front officetransactions on a comparable basis to other supply-side resources.● Wind Commitment – In the 2004 IRP Update, 1,400 megawatts of wind were included asplanned resources in the initial load and resource balance. For the <strong>2007</strong> IRP, 400 megawattsof the overall 1,400-megawatt commitment are included in the initial load and resource bal-79
<strong>PacifiCorp</strong> – <strong>2007</strong> IRPChapter 4 – <strong>Resource</strong> Needs Assessmentance. The remaining 1,000 megawatts are treated as part of the overall wind resource potentialevaluated in portfolio modeling.● Clark County Load Service Contract – In the 2004 IRP Update, the Clark County loadservice contract including the River Road combined-cycle gas resource was modeled. Thiscontract ends in <strong>2007</strong> and affects little of the 20-year planning horizon. Also, the energy fromthe component resources and load obligation balances out. Thus, this contract is not part ofthis load and resource balance.● <strong>Plan</strong>ning Reserve Calculation for Firm Transactions and Load Curtailment Contracts –In the <strong>2007</strong> IRP, the company represents front office transactions as firm purchases. Consistentwith current market practices, the seller, rather than the company as the purchaser, carriesthe operating reserve obligation. 29 Load curtailment contracts and DSM programs directlyreduce firm load. Thus, the planning reserve margin is not applied to firm purchases,DSM programs and interruptible resources. This was not done in the 2004 IRP Update.● Non-owned Reserves – The <strong>2007</strong> IRP includes the modeling of capacity obligation resultingfrom the holding of reserves for counterparties within the <strong>PacifiCorp</strong> control areas. This wasnot done in the 2004 IRP Update.● <strong>Plan</strong>ning Reserve Margin – The planning reserve margin is the generating capability thatexceeds the expected peak load for each year. The 2004 IRP and 2004 IRP Update assumed a15 percent planning reserve margin. However, the <strong>2007</strong> IRP considers resource portfolios at12 and 15 percent levels. <strong>PacifiCorp</strong> views this percentage range as a prudent and reasonablerange for planning purposes when considering both supply reliability and economic impact tocustomers. <strong>30</strong>Capacity Balance ResultsTable 4.12 shows the annual capacity balances and component line items using a planning reservemargin of 12 percent to calculate the planning reserve amount. Balances for the system aswell as <strong>PacifiCorp</strong>’s east and west control areas are shown. (It should be emphasized that whilewest and east balances are broken out separately, the <strong>PacifiCorp</strong> system is planned for and dispatchedon a system basis.) For comparison purposes, Table 4.13 shows the system-level capacitybalance assuming a 15 percent planning reserve margin.Figures 4.3 through 4.5 display the annual capacity positions (resource surplus or deficits) for thesystem, west control area, and east control area, respectively. The associated obligation with both12 and 15 percent planning reserve margins are shown. The decrease in resources in 2008 iscaused by the expected expiration of the West Valley lease agreement. The slight increase in29 Recently, there have been proposals made to the Western Electricity Coordinating Council board of directors tochange the current market practice that would require the operating reserve obligation to be calculated based on theload serving entity’s load, and the obligation would be independent of purchases or sales. If this change is adopted,the company will need to modify its assumptions in future integrated resource plans to calculate the operating reserveobligation based on its load.<strong>30</strong> To provide context, note that the IRP Benchmarking Study in Appendix C of the 2004 IRP Update identifiednumerous planning reserve margins used by utilities that range from 11 to 20 percent. Also, the Pacific Northwest<strong>Resource</strong> Adequacy Forum recently developed a regional pilot capacity adequacy standard that included a 19 percentplanning reserve margin for summer peak planning for the Pacific Northwest.80
<strong>PacifiCorp</strong> – <strong>2007</strong> IRPChapter 4 – <strong>Resource</strong> Needs Assessment2009 is due to executed front office transactions and an increase in the curtailment portion of theMonsanto contract. The large decrease in 2012 is primarily due to the expiration of the BPApeaking contract in August 2011. Additionally, Figure 4.4 highlights a decrease in obligation inthe west starting in 2014. This is due to the expiration of the Sacramento Municipal Utility Districtand City of Redding power sales contracts.Table 4.12 – Capacity Load and <strong>Resource</strong> Balance (12% <strong>Plan</strong>ning Reserve Margin)Calendar Year <strong>2007</strong> 2008 2009 2010 2011 2012 2013 2014 2015 2016EastThermal 6,134 5,941 5,941 5,941 5,941 5,941 5,941 5,941 5,941 5,941Hydro 135 135 135 135 135 135 135 135 135 135DSM 153 163 163 163 163 163 163 163 163 163Renewable 65 109 109 109 109 109 109 109 105 105Purchase 904 679 778 548 543 343 343 343 343 322QF 106 106 106 106 106 106 106 106 106 106Interruptible 233 233 <strong>30</strong>8 <strong>30</strong>8 <strong>30</strong>8 <strong>30</strong>8 <strong>30</strong>8 <strong>30</strong>8 <strong>30</strong>8 <strong>30</strong>8East Existing <strong>Resource</strong>s 7,7<strong>30</strong> 7,366 7,540 7,310 7,<strong>30</strong>5 7,105 7,105 7,105 7,101 7,080Load 6,321 6,515 6,657 7,137 7,289 7,595 7,738 7,895 8,026 8,366Sale 849 811 702 666 631 595 595 595 595 595East Obligation 7,170 7,326 7,359 7,803 7,920 8,190 8,333 8,490 8,621 8,961<strong>Plan</strong>ning reserves 706 750 733 814 829 885 902 921 937 980Non-owned reserves 71 71 71 71 71 71 71 71 71 71East Reserves 776 821 804 885 899 956 973 992 1,007 1,051East Obligation + Reserves 7,946 8,147 8,163 8,688 8,819 9,146 9,<strong>30</strong>6 9,482 9,628 10,012East Position (217) (781) (623) (1,378) (1,514) (2,041) (2,201) (2,377) (2,528) (2,932)East Reserve Margin 9% 1% 4% -6% -7% -13% -14% -16% -17% -21%WestThermal 2,046 2,046 2,046 2,046 2,046 2,046 2,046 2,046 2,046 2,046Hydro 1,421 1,421 1,414 1,328 1,357 1,225 1,249 1,243 1,244 1,242DSM 0 0 0 0 0 0 0 0 0 0Renewable 108 108 108 108 108 84 84 84 84 84Purchase 786 800 800 799 749 112 141 107 107 107QF 40 40 40 40 40 40 38 38 38 38West Existing <strong>Resource</strong>s 4,401 4,415 4,408 4,321 4,<strong>30</strong>0 3,506 3,558 3,519 3,519 3,518Load 2,922 2,924 3,095 3,124 3,199 3,240 3,251 3,262 3,271 3,252Sale 299 299 299 290 290 258 258 258 158 108West Obligation 3,221 3,223 3,394 3,414 3,489 3,498 3,509 3,520 3,429 3,360<strong>Plan</strong>ning reserves 292 291 311 314 329 406 404 409 399 390Non-owned reserves 7 7 7 7 7 7 7 7 7 7West Reserves 299 297 318 320 335 413 411 416 405 397West Obligation + Reserves 3,520 3,520 3,712 3,734 3,824 3,911 3,920 3,936 3,834 3,757West Position 881 895 696 587 476 (405) (362) (417) (314) (239)West Reserve Margin 39% 40% 33% 29% 26% 0% 2% 0% 3% 5%SystemTotal <strong>Resource</strong>s 12,131 11,780 11,948 11,631 11,605 10,611 10,663 10,624 10,620 10,598Obligation 10,391 10,549 10,753 11,217 11,409 11,688 11,842 12,010 12,050 12,321Reserves 1,075 1,118 1,122 1,205 1,234 1,369 1,384 1,408 1,412 1,447Obligation + Reserves 11,466 11,667 11,874 12,421 12,643 13,057 13,226 13,417 13,462 13,768System Position 665 113 73 (791) (1,038) (2,446) (2,563) (2,794) (2,842) (3,171)Reserve Margin 18% 13% 13% 5% 3% -9% -10% -11% -12% -14%81
<strong>PacifiCorp</strong> – <strong>2007</strong> IRPChapter 4 – <strong>Resource</strong> Needs AssessmentTable 4.13 – System Capacity Load and <strong>Resource</strong> (15% <strong>Plan</strong>ning Reserve Margin)Calendar Year <strong>2007</strong> 2008 2009 2010 2011 2012 2013 2014 2015 2016SystemTotal <strong>Resource</strong>s 12,131 11,780 11,948 11,631 11,605 10,611 10,663 10,624 10,620 10,598Obligation 10,391 10,549 10,753 11,217 11,409 11,688 11,842 12,010 12,050 12,321Reserves 1,324 1,378 1,383 1,487 1,524 1,691 1,710 1,740 1,746 1,790Obligation + Reserves 11,715 11,927 12,136 12,703 12,932 13,380 13,552 13,750 13,796 14,111System Position 415 (147) (188) (1,073) (1,327) (2,768) (2,890) (3,126) (3,176) (3,513)Reserve Margin 19% 14% 13% 5% 3% -9% -9% -11% -11% -14%Figure 4.3 – System Coincident Peak Capacity Chart14,000Obligation + Reserves (15%)12,000Obligation + Reserves (12%)10,000MW8,0006,000Existing <strong>Resource</strong>s4,0002,0000<strong>2007</strong> 2008 2009 2010 2011 2012 2013 2014 2015 2016<strong>Resource</strong>s 12,131 11,780 11,948 11,631 11,605 10,611 10,663 10,624 10,620 10,598Obligation+Reserves12% PRMObligation+Reserves15% PRM12%SystemPosition15%SystemPosition11,466 11,667 11,874 12,421 12,643 13,057 13,226 13,417 13,462 13,76811,715 11,927 12,136 12,703 12,932 13,380 13,552 13,750 13,796 14,111665 113 73 (791) (1,038) (2,446) (2,563) (2,794) (2,842) (3,171)415 (147) (188) (1,073) (1,327) (2,768) (2,890) (3,126) (3,176) (3,513)82
<strong>PacifiCorp</strong> – <strong>2007</strong> IRPChapter 4 – <strong>Resource</strong> Needs AssessmentFigure 4.4 – West Coincident Peak Capacity Chart14,00012,00010,000MW8,0006,000West Obligation + Reserves (15%)4,0002,000Existing <strong>Resource</strong>sWest Obligation + Reserves (12%)0<strong>2007</strong> 2008 2009 2010 2011 2012 2013 2014 2015 2016<strong>Resource</strong>s 4,401 4,415 4,408 4,321 4,<strong>30</strong>0 3,506 3,558 3,519 3,519 3,518Obligation+ Reserves12% PRMObligation+Reserves15% PRM3,520 3,520 3,712 3,734 3,824 3,911 3,920 3,936 3,834 3,7573,593 3,593 3,789 3,812 3,906 4,013 4,021 4,038 3,933 3,85412% PRMPosition881 895 696 587 476 (405) (362) (417) (314) (239)15% PRMPosition808 822 618 509 394 (506) (463) (519) (414) (336)83
<strong>PacifiCorp</strong> – <strong>2007</strong> IRPChapter 4 – <strong>Resource</strong> Needs AssessmentFigure 4.5 – East Coincident Peak Capacity Chart14,00012,000East Obligation + Reserves (15%)10,000MW8,000East Obligation + Reserves (12%)6,0004,000Existing <strong>Resource</strong>s2,0000<strong>2007</strong> 2008 2009 2010 2011 2012 2013 2014 2015 2016<strong>Resource</strong>s 7,7<strong>30</strong> 7,366 7,540 7,310 7,<strong>30</strong>5 7,105 7,105 7,105 7,101 7,080Obligation+ Reserves12% PRMObligation+ Reserves15% PRM12% PRMPosition15% PRMPosition7,946 8,147 8,163 8,688 8,819 9,146 9,<strong>30</strong>6 9,482 9,628 10,0128,123 8,334 8,346 8,891 9,027 9,367 9,531 9,712 9,863 10,257(217) (781) (623) (1,378) (1,514) (2,041) (2,201) (2,377) (2,528) (2,932)(393) (969) (806) (1,581) (1,722) (2,262) (2,427) (2,607) (2,762) (3,177)84
<strong>PacifiCorp</strong> – <strong>2007</strong> IRPChapter 4 – <strong>Resource</strong> Needs AssessmentEnergy Balance DeterminationMethodologyThe energy balance shows the average monthly on-peak and off-peak surplus (deficit) of energy.The on-peak hours are weekdays and Saturdays from hour-ending 7:00 am to 10:00 pm; off-peakhours are all other hours. The existing resource availability is computed for each month and dailytime block without regard to economic considerations. Peaking resources such as the Gadsbyunits are counted only for the on-peak hours. This is calculated using the formulas that follow.Please refer to the section on load and resource balance components for details on how energyfor each component is counted.Existing <strong>Resource</strong>s = Thermal + Hydro + DSM + Renewable + Purchase + QF + InterruptibleThe average obligation is computed using the following formula:Obligation = Load + SalesThe energy position by month and daily time block is then computed as follows:Energy Position = Existing <strong>Resource</strong>s – Obligation – Reserve Requirements (12% PRM)Energy Balance ResultsFigures 4.6 through 4.8 show the energy balances for the system, west control area, and east controlarea, respectively. They show the energy balance on a monthly average basis across allhours, and also indicate the average annual energy position. The cross-over point, where the systembecomes energy deficient on an average annual basis, is 2009, absent any economic considerations.85
<strong>PacifiCorp</strong> – <strong>2007</strong> IRPChapter 4 – <strong>Resource</strong> Needs AssessmentFigure 4.6 – Average Monthly and Annual System Energy Balances2,0001,5001,000500MWa0(500)(1,000)(1,500)(2,000)(2,500)(3,000)Annual BalanceMonthly BalanceJan-07Apr-07Jul-07Oct-07Jan-08Apr-08Jul-08Oct-08Jan-09Apr-09Jul-09Oct-09Jan-10Apr-10Jul-10Oct-10Jan-11Apr-11(3,500)Jul-11Oct-11Jan-12Apr-12Jul-12Oct-12Jan-13Apr-13Jul-13Oct-13Jan-14Apr-14Jul-14Oct-14Jan-15Apr-15Jul-15Oct-15Jan-16Apr-16Jul-16Oct-16Figure 4.7 – Average Monthly and Annual West Energy Balances2,0001,5001,000500MWa0(500)(1,000)(1,500)(2,000)(2,500)(3,000)Annual BalanceMonthly BalanceJan-07Apr-07Jul-07Oct-07Jan-08Apr-08Jul-08Oct-08Jan-09Apr-09Jul-09Oct-09Jan-10Apr-10Jul-10Oct-10Jan-11Apr-11Jul-11Oct-11Jan-12Apr-12Jul-12Oct-12Jan-13Apr-13Jul-13Oct-13Jan-14Apr-14Jul-14Oct-14Jan-15Apr-15Jul-15Oct-15Jan-16Apr-16Jul-16Oct-16(3,500)86
<strong>PacifiCorp</strong> – <strong>2007</strong> IRPChapter 4 – <strong>Resource</strong> Needs AssessmentFigure 4.8 – Average Monthly and Annual East Energy Balances2,0001,5001,000500MWa0(500)(1,000)(1,500)(2,000)(2,500)(3,000)Annual BalanceMonthly Balance(3,500)Jan-07Apr-07Jul-07Oct-07Jan-08Apr-08Jul-08Oct-08Jan-09Apr-09Jul-09Oct-09Jan-10Apr-10Jul-10Oct-10Jan-11Apr-11Load and <strong>Resource</strong> Balance ConclusionsJul-11Oct-11Jan-12Apr-12Jul-12Oct-12Jan-13Apr-13Jul-13Oct-13Jan-14Apr-14Jul-14Oct-14Jan-15Apr-15Jul-15Oct-15Jan-16Apr-16Jul-16Oct-16The company projects a summer peak resource deficit for the <strong>PacifiCorp</strong> system beginning in2008 to 2010, depending on the planning reserve margin assumed. The <strong>PacifiCorp</strong> deficits priorto 2011 to 2012 will be met by additional renewables, demand side programs, and market purchases.The company will consider other options during this time frame if they are cost-effectiveand provide other system benefits. This could include acceleration of a natural gas plant to complementthe accelerated and expanded acquisition of renewable wind facilities. Then beginningin 2011 to 2012, base load, intermediate load, or both types of resource additions will be necessaryto cover the widening capacity and annual energy deficits. The capacity balance at a 12 percentplanning reserve margin indicates the start of a deficit beginning in 2010—the system isshort by 791 megawatts. This capacity deficit increases to 2,400 megawatts in 2012 and then toalmost 3,200 megawatts in 2016. On an annual basis, and disregarding economic considerations,the company becomes deficit with respect to energy by 2009.87
<strong>PacifiCorp</strong> – <strong>2007</strong> IRPChapter 5 – <strong>Resource</strong> Options5. RESOURCE OPTIONSChapter Highlights For use in portfolio modeling, <strong>PacifiCorp</strong> developed cost and performance profiles forsupply-side resources, demand-side management programs, transmission expansionprojects, and market purchases (front office transactions). <strong>PacifiCorp</strong> used the Electric Power Research Institute’s Technical Assessment Guide(TAG®), along with recent project experience and consultant studies, to develop itssupply-side resource options. The use of TAG information is new to <strong>PacifiCorp</strong>’s integratedresource planning process. Also new to the company’s integrated planning process is the estimation and use ofcapital cost ranges for each supply-side option. These cost ranges reflect cost uncertainty,and their use in this plan acknowledges the significant construction cost increasestaking place. The company commissioned Quantec LLC to construct proxy supply curves for Class 1(fully dispatchable or scheduled firm) and Class 3 (price-responsive) demand-sidemanagement programs. The company developed transmission resources to support new generation options, toenhance transfer capability and reliability across <strong>PacifiCorp</strong>’s system, and to boost import/exportcapability with respect to external markets. These transmission resourceswere entered as options in <strong>PacifiCorp</strong>’s capacity expansion optimization tool, and werethus allowed to compete directly with other resources for inclusion in portfolios.INTRODUCTIONThis chapter provides background information on the various resources considered in the IRP formeeting future capacity and energy needs. Organized by major category, these resources consistof supply-side generation, demand-side management programs, transmission expansion projects,and market purchases. For each resource category, the chapter discusses the criteria for resourceselection, presents the options and associated attributes, and describes the technologies. In addition,for supply-side resources, the chapter describes how <strong>PacifiCorp</strong> addressed long-term costtrends and uncertainty in deriving cost figures. The chapter concludes with a discussion on theuse and impact of physical and financial hedging strategies.89
<strong>PacifiCorp</strong> – <strong>2007</strong> IRPChapter 5 – <strong>Resource</strong> OptionsSUPPLY-SIDE RESOURCES<strong>Resource</strong> Selection CriteriaThe list of supply-side resource options has been reduced in relation to previous IRP resourcelists to reflect the realities evidenced through previous studies and to help efficiently manage thecomputer processing time involved in developing detailed portfolios. For instance, subcriticalpulverized coal resources are not included since it is felt than any new, large (greater than 500megawatts) pulverized coal plant will utilize a supercritical boiler based on the increased efficiencyand superior environmental performance of the supercritical designs. Similarly, naturalgas based options based on smaller, less efficient combustion turbines have not been includedsince previous IRP exercises have demonstrated that the superior heat rate and cost performanceof larger combustion turbines will cause the larger machines to be selected over the smaller options.Derivation of <strong>Resource</strong> AttributesThe supply-side resource options were developed from a combination of resources. The processbegan with the list of major electrical generating resources from the 2004 IRP Update. This resourcelist was reviewed and, in some cases, simplified. Once the basic list of resources was determinedthe cost and performance attributes for each resource was estimated. A number of informationsources were used to identify parameters needed to model these resources. <strong>PacifiCorp</strong>has conducted a number of engineering studies to understand the cost of coal and gas resourcesin recent years. Recent experience with the construction of the 2x1 combined cycle plants at CurrantCreek and Lake Side as well as other recent simple cycle projects at Gadsby and West Valleyhas provided <strong>PacifiCorp</strong> with insight into the current cost of new power generating facilities.For newer technologies (integrated gasification combined cycle (IGCC) plants and supercriticalpulverized coal plants) a study performed by WorleyParsons was used along with internal studiesto review the cost estimates of these resources.In order to refresh the modeling data used in the 2004 IRP Update, <strong>PacifiCorp</strong> purchased a licenseto utilize the Electric Power Research Institute (EPRI) new resource data base called theTechnical Assessment Guide® (TAG). The TAG contains information on capital cost, heat rate,availability, and fixed and variable operating and maintenance cost estimates. The data in theTAG must be customized for each application by adjusting basic financial parameters as well asphysical parameters for each potential site, such as coal quality, water availability, and elevation.The 2006 TAG data were used to develop a cost and performance profile for each potential resource.The results of the TAG runs were compared to the actual cost data from recent projectsas well as internal <strong>PacifiCorp</strong> studies of site specific generation options. The TAG results werecustomized to give results approximately in agreement to these recent studies. The customizationwas primarily done for capital costs, and reflects market conditions as of late spring of 2006. Ofparticular concern with the capital costs contained in the TAG database was the apparent lag inthe TAG results in recognizing the recent trend of increases in capital costs for power generatingequipment. It was apparent from numerous discussions with engineering and construction companiesin the power industry that construction costs have increased substantially in the last two tothree years. These increases, on the order of 25 to 35 percent with respect to the costs reported inthe 2004 IRP Update, are due to increased construction activity stemming from shortages of90
<strong>PacifiCorp</strong> – <strong>2007</strong> IRPChapter 5 – <strong>Resource</strong> Optionsequipment, material, and skilled construction labor. The TAG numbers, in general, did not addressthis recent capital cost trend. The TAG methodology does allow for customization to accountfor this increase. Therefore, costs were adjusted in the TAG to be consistent with otherstudies. Heat rate, availability, and operating and maintenance costs were, in general, calculatedby the TAG.TAG runs were created for all technologies in the supply-side resource table except as noted belowfor combined heat and power plants.Handling of Technology Improvement Trends and Cost UncertaintyAs mentioned above, the capital cost uncertainty for many of the proposed projects is increasing.Additionally, some technologies, such as IGCC, have a greater uncertainty because only a fewdemonstration units have been built and operated. A range of estimated capital costs is displayedin the supply-side resource options table. This range of capital cost was adjusted by factors reflectingthe potential cost of various technologies as compared to a combined cycle natural gasplant. The combined cycle natural gas plant is the easiest technology to predict capital costs forsince there is less field labor and <strong>PacifiCorp</strong> has recent (Currant Creek) and on-going (LakeSide) experience with this kind of project.The cost factors used to reflect technology risk in the uncertainty range for various resource optionswere taken from a U.S Energy Information Administration paper “Assumptions to the AnnualEnergy Outlook 2006, DOE/EIA-0554(2006), March 2006”. In addition to the technologyfactors the TAG capital cost estimates were adjusted by 5 percent on the low end and 10 percenton the high end to give an overall range.There is a potential for future relative cost decreases for certain technologies such as IGCC. Asthe technology matures and more plants are built and operated the costs of such new technologiesmay decrease relative to more mature options such as pulverized coal. The supply-side optionstable does not consider the potential for such savings since the benefits are not expected tobe realized until the next generation of new plants are built and operated for a period of time.Any such benefits are not expected to be available until after 2020 and future IRPs will be able toincorporate the benefit of such future cost reductions.<strong>Resource</strong> Options and Associated AttributesTables 5.1 and 5.2 present cost and performance attributes for supply-side resource options designatedfor <strong>PacifiCorp</strong>’s east and west control areas, respectively. Tables 5.3 and 5.4 present thetotal resource cost attributes for supply-side resource options, and are based on estimates of thefirst-year real levelized cost per megawatt-hour of resources, stated in June 2006 dollars. Optionsincluded in <strong>PacifiCorp</strong>’s IRP models are highlighted. As mentioned above, the attributes weremainly derived from the EPRI TAG database with certain technologies adjusted to be more inline with <strong>PacifiCorp</strong>’s recent cost studies and project experience. Cost and performance valuesreflect analysis concluded by July 2006. Additional explanatory notes for the tables are as follows:• The second 600-megawatt Utah supercritical pulverized coal resource is modeled as a 340-megawatt share to emulate the Intermountain Power Project acquisition opportunity.91
<strong>PacifiCorp</strong> – <strong>2007</strong> IRPChapter 5 – <strong>Resource</strong> Options• Capital costs are intended to be all-inclusive, and account for Allowance for Funds UsedDuring Construction (AFUDC), land, EPC (Engineering, Procurement, and Construction)cost premiums, owner’s costs, etc. Capital costs in Tables 5.1 and 5.2 reflect mid-2006 currentdollars, and do not include escalation from the current year to the year of commercialoperation.• Wind sites are modeled with differing peak load carrying capability levels. These levels arereported for each wind site in the Wind Capacity <strong>Plan</strong>ning Contribution section of AppendixJ.• For customer-owned standby generators, the 40 megawatts of capacity is the assumed aggregateavailability of dispatchable megawatts rather than an average capacity per plant. Thecapital cost listed includes interconnection and emission control upgrade costs. The variableoperations and maintenance (O&M) cost reflects the cost of #2 fuel oil, which is based on anaverage forecasted monthly fuel price of $13.9/MMBtu for the <strong>2007</strong> to 2026 period.• Certain resource names are listed as acronyms. These include:PC – pulverized coalIGCC – integrated gasification combined cycleSCCT – simple cycle combustion turbineCCCT – combined cycle combustion turbineCHP – combined heat and power (cogeneration)• For the CHP resources, a steam credit is applied against the variable O&M cost, or, in thecase of the west-side topping cycle combustion turbine, against the heat rate.• The costs presented do not include any investment tax credits.• The heat rate for the solar trough resource with CCCT backup (11,750 Btu/kWh) reflects gasoperation only, and comes directly from the EPRI TAG database. Gas backup for solar is lessefficient than for a standalone CCCT.• For the nuclear option, costs do not include fuel disposal.• The capital cost columns in Tables 5.3 and 5.4 reports averages of the low and high capitalcost estimates presented in Tables 5.1 and 5.2.92
<strong>PacifiCorp</strong> – <strong>2007</strong> IRP Chapter 5 – <strong>Resource</strong> OptionsTable 5.1 – East Side Supply-Side <strong>Resource</strong> Options(2006 Dollars)DescriptionLocation/TimingInstallationLocationEarliest In-Service Date(Mid-Year)AverageCapacity(MW)<strong>Plan</strong>t DetailsDesign <strong>Plan</strong>tLife in YearsAve. AnnualHeat Rate(Btu/kWh)Outage InformationMaint.OutageRateEast Side Options (4500')CoalUtah PC Supercritical 1 (600 MW) Utah 2012 600 40 9,169 5% 4% $ 1,940 $ 2,266 $ 2.41 $ 35.65 0.062 0.070 0.600 205.35Utah PC Supercritical 2 (600 MW) Utah 2012 600 40 9,169 5% 4% $ 1,940 $ 2,266 $ 2.41 $ 35.65 0.062 0.070 0.600 205.35Utah IGCC (Min. Carbon Prep/Level II Controls) Utah 2014 508 40 8,732 5% 6% $ 2,269 $ 2,690 $ 1.10 $ 81.31 0.014 0.014 0.<strong>30</strong>0 205.35Utah IGCC (Min. Carbon Prep/Level II - no spare gas.) Utah 2014 508 40 8,732 10% 11% $ 2,141 $ 2,538 $ 1.10 $ 76.71 0.014 0.014 0.<strong>30</strong>0 205.35Utah IGCC with Carbon Capture & Sequestration Utah 2014 470 40 9,917 5% 6% $ 2,901 $ 3,439 $ 6.28 $ 114.50 0.014 0.014 0.<strong>30</strong>0 20.54Wyoming PC Supercritical (750 MW) Wyoming 2014 750 40 9,427 5% 4% $ 1,9<strong>30</strong> $ 2,256 $ 2.08 $ 41.06 0.062 0.070 0.600 205.35Wyoming IGCC (Min. Carbon Prep/Level II Controls) Wyoming 2014 497 40 8,915 5% 6% $ 2,471 $ 2,929 $ 1.08 $ 81.32 0.013 0.013 0.<strong>30</strong>0 205.35Natural GasMicroturbine Utah <strong>2007</strong> 0.03 15 12,885 1% 1% $ 929 $ 1,076 $ 2.00 $ 200.00 0.001 0.101 0.255 118.00Small Non-CT CHP Utah 2009 25 25 5,156 5% 10% $ 824 $ 945 $ 0.20 $ 29.49 0.001 0.080 0.255 118.00Small Industrial CHP Utah 2008 4 25 12,590 7% 2% $ 1,454 $ 1,669 $ (0.32) $ 8.22 0.001 0.138 0.255 118.00Small Commercial CHP Utah 2008 1 25 10,035 3% 1% $ 1,167 $ 1,339 $ (0.03) $ 1.35 0.001 0.220 0.255 118.00Fuel Cell - Small (Solid Oxide) Utah 2008 0.3 25 7,820 1% 2% $ 1,577 $ 1,913 $ 0.03 $ 9.70 0.001 0.003 0.255 118.00Fuel Cell - Large (Solid Oxide) Utah 2012 25 25 6,250 2% 3% $ 1,117 $ 1,355 $ 0.03 $ 8.40 0.001 0.003 0.255 118.00SCCT Aero Utah 2009 79 25 10,744 7% 10% $ 701 $ 804 $ 7.08 $ 20.91 0.001 0.011 0.255 118.00Intercooled Aero SCCT Utah 2009 78 25 9,436 3% 2% $ 698 $ 801 $ 2.58 $ 29.02 0.001 0.011 0.255 118.00Internal Combustion Engines Utah 2009 153 25 8,390 5% 1% $ 824 $ 946 $ 5.20 $ 12.80 0.001 0.017 0.255 118.00SCCT Frame (2 Frame "F") Utah 2009 <strong>30</strong>2 35 11,509 7% 10% $ 465 $ 534 $ 10.86 $ 5.78 0.001 0.050 0.255 118.00CCCT (Wet "F" 1x1) Utah 2010 222 35 7,223 7% 5% $ 834 $ 957 $ 2.60 $ 16.42 0.001 0.011 0.255 118.00CCCT Duct Firing (Wet "F" 1x1) Utah 2010 50 35 8,868 7% 5% $ 277 $ 318 $ 0.11 $ - 0.001 0.011 0.255 118.00CCCT (Wet "F" 2x1) Utah 2010 448 35 7,164 7% 5% $ 759 $ 870 $ 2.60 $ 9.98 0.001 0.011 0.255 118.00CCCT Duct Firing (Wet "F" 2x1) Utah 2010 100 35 8,868 7% 5% $ 255 $ 292 $ 0.11 $ - 0.001 0.011 0.255 118.00CCCT (Wet "G" 1x1) Utah 2010 297 35 7,075 7% 5% $ 789 $ 905 $ 2.55 $ 12.42 0.001 0.011 0.255 118.00CCCT Duct Firing (Wet "G" 1x1) Utah 2010 60 35 8,868 7% 5% $ 292 $ 335 $ 0.11 $ - 0.001 0.011 0.255 118.00Other - RenewablesSW Wyoming Wind Wyoming 2008 50 20 n/a n/a n/a $ 1,556 $ 1,919 $ - $ 29.78 - - - -Idaho Wind Utah 2008 50 20 n/a n/a n/a $ 1,556 $ 1,919 $ - $ 29.78 - - - -Geothermal, Dual Flash Utah 2009 35 35 n/a 3% 1% $ 3,101 $ 3,591 $ 5.50 $ 22.60 - - - -Battery Storage Utah 2009 20 <strong>30</strong> 12,000 2% 5% $ 1,298 $ 1,503 $ 10.00 $ 1.00 0.100 0.400 3.000 205.35Pumped Storage Nevada 2017 350 50 13,000 5% 5% $ 1,104 $ 1,278 $ 4.<strong>30</strong> $ 4.<strong>30</strong> 0.100 0.400 3.000 205.35Compressed Air Energy Storage (CAES) Wyoming 2010 350 25 11,670 7% 10% $ 698 $ 808 $ 5.50 $ 3.80 0.001 0.011 0.255 118.00Nuclear, Passive Safety Utah 2022 600 40 10,710 7% 8% $ 2,382 $ 2,889 $ 0.38 $ 109.72 - - - -Solar Thermal Trough with Natural Gas Backup Utah 2010 200 <strong>30</strong> 11,750 n/a n/a $ 3,541 $ 4,337 $ 3.10 $ 26.10 - - - -EquivalentForced OutageRate (EFOR)Low EstimateCapital Cost($/kW)CostsHigh EstimateCapital Cost($/kW)Var. O&M($/MWh)Fixed O&M($/kW-yr)SO2lbs/MMBTUNOxlbs/MMBTUEmissionsHglbs/TbtuCO 2lbs/MMBTU93
<strong>PacifiCorp</strong> – <strong>2007</strong> IRP Chapter 5 – <strong>Resource</strong> OptionsTable 5.2 – West Side Supply-Side <strong>Resource</strong> Options(2006 Dollars)DescriptionWest Side Options (1500')Natural GasMicroturbine Northwest <strong>2007</strong> 0.03 15 12,885 1% 1% $ 845 $ 978 $ 1.82 $ 181.82 0.001 0.101 0.255 118.00Fuel Cell - Small (Solid Oxide) Northwest 2008 0.225 25 7,820 1% 2% $ 1,433 $ 1,739 $ 0.03 $ 8.82 0.001 0.003 0.255 118.00SCCT Aero Northwest 2009 87 25 10,744 7% 10% $ 637 $ 731 $ 6.44 $ 19.01 0.001 0.011 0.255 118.00Intercooled Aero SCCT Northwest 2009 86 25 9,436 3% 2% $ 635 $ 728 $ 2.35 $ 26.38 0.001 0.011 0.255 118.00Internal Combustion Engines Northwest 2009 168 25 8,390 5% 1% $ 749 $ 860 $ 5.20 $ 12.80 0.001 0.017 0.255 118.00SCCT Frame (2 Frame "F") Northwest 2009 332 35 11,509 7% 10% $ 423 $ 485 $ 9.87 $ 5.25 0.001 0.050 0.255 118.00CCCT (Wet "F" 1x1) Northwest 2010 244 35 7,223 7% 5% $ 758 $ 870 $ 2.36 $ 14.93 0.001 0.011 0.255 118.00CCCT Duct Firing (Wet "F" 1x1) Northwest 2010 55 35 8,868 7% 5% $ 252 $ 289 $ 0.10 $ - 0.001 0.011 0.255 118.00CCCT (Wet "F" 2x1) Northwest 2010 492 35 7,164 7% 5% $ 690 $ 791 $ 2.36 $ 9.07 0.001 0.011 0.255 118.00CCCT Duct Firing (Wet "F" 2x1) Northwest 2010 110 35 8,868 7% 5% $ 232 $ 266 $ 0.10 $ - 0.001 0.011 0.255 118.00CCCT (Wet "G" 1x1) Northwest 2010 326 35 7,075 7% 5% $ 717 $ 822 $ 2.32 $ 11.29 0.001 0.011 0.255 118.00CCCT Duct Firing (Wet "G" 1x1) Northwest 2010 66 35 8,868 7% 5% $ 266 $ <strong>30</strong>5 $ 0.10 $ - 0.001 0.011 0.255 118.00Other - RenewablesOregon Wind Northwest 2008 50 20 n/a n/a 5% $ 1,556 $ 1,919 $ - $ 29.78 - - - -Geothermal, Dual Flash Northwest 2009 35 35 n/a 3% 1% $ 3,101 $ 3,591 $ 5.50 $ 22.60 - - - -Compressed Air Energy Storage (CAES) Northwest 2010 385 25 11,670 7% 10% $ 635 $ 735 $ 5.00 $ 3.45 0.001 0.011 0.255 118.00West Side Options (Sea Level)CoalLocation/TimingInstallationLocationEarliest In-Service Date(Mid-Year)AverageCapacity(MW)<strong>Plan</strong>t DetailsDesign <strong>Plan</strong>tLife in YearsAve. AnnualHeat Rate(Btu/kWh)Outage InformationMaint.OutageRateWashington IGCC (Min. Carbon Prep/Level II Controls) Northwest 2014 600 40 8,732 5% 6% $ 2,269 $ 2,690 $ 1.10 $ 81.31 0.014 0.014 0.<strong>30</strong>0 205.35Natural GasMicroturbine Northwest <strong>2007</strong> 0.03 15 12,885 1% 1% $ 803 $ 929 $ 1.73 $ 172.73 0.001 0.101 0.255 118.00Large CHP Northwest 2009 120 25 11,655 7% 5% $ 756 $ 824 $ (17.75) $ 14.22 0.001 0.050 0.255 118.00Small Non-CT CHP Northwest 2009 25 25 5,156 5% 10% $ 782 $ 898 $ 0.17 $ 29.49 0.001 0.080 0.255 118.00Small Industrial CHP Northwest 2008 5 25 12,590 7% 2% $ 1,265 $ 1,451 $ (0.28) $ 7.15 0.001 0.138 0.255 118.00Small Commercial CHP Northwest 2008 1 25 10,035 3% 1% $ 1,167 $ 1,339 $ (0.02) $ 1.17 0.001 0.220 0.255 118.00Fuel Cell - Small (Solid Oxide) Northwest 2008 0.2 25 7,820 1% 2% $ 1,362 $ 1,652 $ 0.03 $ 8.82 0.001 0.003 0.255 118.00SCCT Aero Northwest 2009 91 25 10,744 2% 10% $ 605 $ 694 $ 6.13 $ 18.06 0.001 0.011 0.255 118.00Intercooled Aero SCCT Northwest 2009 90 25 9,436 7% 2% $ 603 $ 692 $ 2.23 $ 25.06 0.001 0.011 0.255 118.00Internal Combustion Engines Northwest 2009 177 25 8,390 3% 1% $ 712 $ 817 $ 5.20 $ 12.80 0.001 0.017 0.255 118.00SCCT Frame (2 Frame "F") Northwest 2009 350 35 11,509 5% 10% $ 402 $ 461 $ 9.40 $ 5.00 0.001 0.050 0.255 118.00CCCT (Wet "F" 1x1) Northwest 2010 257 35 7,223 7% 5% $ 720 $ 826 $ 2.25 $ 14.22 0.001 0.011 0.255 118.00CCCT Duct Firing (Wet "F" 1x1) Northwest 2010 58 35 8,868 7% 5% $ 240 $ 275 $ 0.10 $ - 0.001 0.011 0.255 118.00CCCT (Wet "F" 2x1) Northwest 2010 518 35 7,164 7% 5% $ 655 $ 752 $ 2.25 $ 8.64 0.001 0.011 0.255 118.00CCCT Duct Firing (Wet "F" 2x1) Northwest 2010 116 35 8,868 7% 5% $ 220 $ 252 $ 0.10 $ - 0.001 0.011 0.255 118.00CCCT (Wet "G" 1x1) Northwest 2010 343 35 7,075 7% 5% $ 681 $ 781 $ 2.21 $ 10.75 0.001 0.011 0.255 118.00CCCT Duct Firing (Wet "G" 1x1) Northwest 2010 69 35 8,868 7% 5% $ 252 $ 290 $ 0.10 $ - 0.001 0.011 0.255 118.00Other- RenewablesOregon Wind Northwest 2008 50 20 n/a n/a 5% $ 1,556 $ 1,919 $ - $ 29.78 - - - -Biomass (closed loop) Northwest 2010 100 35 10,979 5% 4% $ 2,213 $ 2,563 $ 1.91 $ 4.12 0.062 0.350 0.600 205.39Nuclear, Passive Safety Northwest 2022 600 40 10,710 7% 8% $ 2,382 $ 2,889 $ 0.38 $ 109.72 - - - -Compressed Air Energy Storage (CAES) Northwest 2010 405 25 11,670 7% 10% $ 603 $ 698 $ 4.76 $ 3.28 0.001 0.011 0.255 118.00Customer Owned Standby Generation Northwest 2008 40 20 10,500 n/a n/a $ 170 $ 170 $ 146.00 $ 3.50 0.058 0.231 n/a 190.00EquivalentForced OutageRate (EFOR)Low EstimateCapital Cost($/kW)CostsHigh EstimateCapital Cost($/kW)Var. O&M($/MWh)Fixed O&M($/kW-yr)SO2lbs/MMBTUNOxlbs/MMBTUEmissionsHglbs/TbtuCO 2lbs/MMBTU94
<strong>PacifiCorp</strong> – <strong>2007</strong> IRP Chapter 5 – <strong>Resource</strong> OptionsTable 5.3 – Total <strong>Resource</strong> Cost for East Side Supply-Side <strong>Resource</strong> Options(2006 Dollars)Capital Cost $/kW Fixed Cost Convert to Mills Variable CostsDescriptionTotalCapital CostPaymentFactorAnnualPayment($/kW-Yr)Fixed O&M ($/kW-Yr) Levelized Fuel mills/kWhTotal Fixed Capacity Total FixedO&M Other Total ($/kW-Yr) Factor (Mills/kWh) ¢/mmBtu Mills/kWh O&M Total Tax Credits EnvironmentalEast Side Options (4500')CoalUtah PC Supercritical 1 (600 MW) $ 2,103 8.10% $ 170.43 $ 35.65 $ 6.00 $ 41.65 $ 212.08 91% 26.49 187.20 17.16 $ 2.41 - - 5.39 $ 51.46Utah PC Supercritical 2 (600 MW) $ 2,103 8.10% $ 170.43 $ 35.65 $ 6.00 $ 41.65 $ 212.08 91% 26.49 187.20 17.16 $ 2.41 - - 5.39 $ 51.46Utah IGCC (Min. Carbon Prep/Level II Controls) $ 2,479 7.82% $ 193.86 $ 81.31 $ 6.00 $ 87.31 $ 281.17 89% 36.06 187.20 16.35 $ 1.10 - - 4.83 $ 58.35Utah IGCC (Min. Carbon Prep/Level II - no spare gas.) $ 2,339 7.82% $ 182.90 $ 76.71 $ 6.00 $ 82.71 $ 265.62 79% 38.38 187.20 16.35 $ 1.10 - - 4.83 $ 60.66Utah IGCC with Carbon Capture & Sequestration $ 3,170 7.82% $ 247.87 $ 114.50 $ 6.00 $ 120.50 $ 368.37 89% 47.25 187.20 18.56 $ 6.28 - - 0.64 $ 72.74Wyoming PC Supercritical (750 MW) $ 2,093 8.10% $ 169.61 $ 41.06 $ 6.00 $ 47.06 $ 216.67 91% 27.06 103.67 9.77 $ 2.08 - - 5.54 $ 44.46Wyoming IGCC (Min. Carbon Prep/Level II Controls) $ 2,700 7.82% $ 211.11 $ 81.32 $ 6.00 $ 87.32 $ 298.43 89% 38.28 103.67 9.24 $ 1.08 - - 4.93 $ 53.53Natural GasMicroturbine $ 1,003 11.21% $ 112.38 $ 200.00 $ 0.50 $ 200.50 $ 312.88 98% 36.45 693.70 89.39 $ 2.00 - - 4.45 $ 139.37Small Non-CT CHP $ 884 9.84% $ 87.01 $ 29.49 $ 0.50 $ 29.99 $ 117.01 85% 15.71 693.70 35.77 $ 0.20 - - 1.75 $ 56.26Small Industrial CHP $ 1,561 9.84% $ 153.64 $ 8.22 $ 0.50 $ 8.72 $ 162.36 90% 20.59 693.70 87.34 $ (0.32) - - 4.49 $ 119.03Small Commercial CHP $ 1,253 9.84% $ 123.29 $ 1.35 $ 0.50 $ 1.85 $ 125.14 90% 15.87 693.70 69.61 $ (0.03) - - 3.84 $ 94.82Fuel Cell - Small (Solid Oxide) $ 1,745 8.50% $ 148.23 $ 9.70 $ 0.50 $ 10.20 $ 158.43 97% 18.65 693.70 54.25 $ 0.03 - - 2.46 $ 79.69Fuel Cell - Large (Solid Oxide) $ 1,236 8.50% $ 105.01 $ 8.40 $ 0.50 $ 8.90 $ 113.91 95% 13.69 693.70 43.36 $ 0.03 - - 1.97 $ 62.48SCCT Aero $ 752 9.51% $ 71.53 $ 20.91 $ 0.50 $ 21.41 $ 92.94 21% 50.52 693.70 74.53 $ 7.08 0.15 - 3.41 $ 139.40Intercooled Aero SCCT $ 750 9.51% $ 71.27 $ 29.02 $ 0.50 $ 29.52 $ 100.79 21% 54.79 693.70 65.46 $ 2.58 - - 2.99 $ 129.21Internal Combustion Engines $ 885 9.51% $ 84.14 $ 12.80 $ 0.50 $ 13.<strong>30</strong> $ 97.44 94% 11.83 693.70 58.20 $ 5.20 - - 2.68 $ 82.53SCCT Frame (2 Frame "F") $ 499 8.33% $ 41.61 $ 5.78 $ 0.50 $ 6.28 $ 47.89 21% 26.03 693.70 79.84 $ 10.86 - - 3.79 $ 124.53CCCT (Wet "F" 1x1) $ 895 8.62% $ 77.16 $ 16.42 $ 0.50 $ 16.92 $ 94.08 56% 19.18 693.70 50.11 $ 2.60 - - 2.29 $ 77.90CCCT Duct Firing (Wet "F" 1x1) $ 298 8.62% $ 25.67 - $ 0.50 $ 0.50 $ 26.17 16% 18.67 693.70 61.52 $ 0.11 - - 2.81 $ 86.70CCCT (Wet "F" 2x1) $ 815 8.62% $ 70.20 $ 9.98 $ 0.50 $ 10.48 $ 80.68 56% 16.45 693.70 49.69 $ 2.60 3.50 - 2.27 $ 74.71CCCT Duct Firing (Wet "F" 2x1) $ 273 8.62% $ 23.56 - $ 0.50 $ 0.50 $ 24.06 16% 17.17 693.70 61.52 $ 0.11 - - 2.81 $ 85.19CCCT (Wet "G" 1x1) $ 847 8.62% $ 72.96 $ 12.42 $ 0.50 $ 12.92 $ 85.88 56% 17.51 693.70 49.08 $ 2.55 - - 2.25 $ 75.03CCCT Duct Firing (Wet "G" 1x1) $ 314 8.62% $ 27.05 - $ 0.50 $ 0.50 $ 27.55 16% 19.66 693.70 61.52 $ 0.11 - - 2.81 $ 87.68Other - RenewablesSW Wyoming Wind $ 2,011 9.48% $ 190.70 $ 29.78 $ 0.50 $ <strong>30</strong>.28 $ 220.98 35% 72.49 - - - - (20.65) - $ 55.13Idaho Wind $ 1,729 9.48% $ 163.96 $ 29.78 $ 0.50 $ <strong>30</strong>.28 $ 194.24 33% 68.23 - - - - (20.65) - $ 50.87Geothermal, Dual Flash $ 3,346 7.46% $ 249.55 $ 22.60 $ 0.50 $ 23.10 $ 272.65 96% 32.32 - 21.13 $ 5.50 - (20.65) - $ 38.<strong>30</strong>Battery Storage $ 1,400 8.51% $ 119.15 $ 1.00 $ 0.50 $ 1.50 $ 120.65 21% 65.59 693.70 83.24 $ 10.00 - - 8.62 $ 167.45Pumped Storage $ 1,191 7.86% $ 93.62 $ 4.<strong>30</strong> $ 1.35 $ 5.65 $ 99.27 20% 56.66 693.70 90.18 $ 4.<strong>30</strong> - - 9.340 $ 160.48Compressed Air Energy Storage (CAES) $ 753 8.69% $ 65.45 $ 3.80 $ 1.35 $ 5.15 $ 70.60 25% 32.24 693.70 80.96 $ 5.50 - - 3.704 $ 122.40Nuclear, Passive Safety $ 2,635 8.01% $ 210.97 $ 109.72 $ 6.00 $ 115.72 $ 326.69 85% 43.87 - 6.63 $ 0.38 - - - $ 50.88Solar Thermal Trough with Natural Gas Backup $ 3,939 7.87% $ 310.11 $ 26.10 $ 6.00 $ 32.10 $ 342.21 21% 186.03 - - $ 3.10 - - - $ 189.13Total <strong>Resource</strong>Cost(Mills/kWh)95
<strong>PacifiCorp</strong> – <strong>2007</strong> IRP Chapter 5 – <strong>Resource</strong> OptionsTable 5.4 – Total <strong>Resource</strong> Cost for West Side Supply-Side <strong>Resource</strong> Options(2006 Dollars)Capital Cost $/kW Fixed Cost Convert to Mills Variable CostsDescriptionWest Side Options (1500')Natural GasTotalCapital CostPaymentFactorAnnualPayment($/kW-Yr)Fixed O&M ($/kW-Yr) Levelized Fuel mills/kWhTotal Fixed Capacity Total FixedO&M Other Total ($/kW-Yr) Factor (Mills/kWh) ¢/mmBtu Mills/kWh O&M Total Tax Credits EnvironmentalMicroturbine $ 912 11.21% $ 102.16 $ 181.82 $ 0.50 $ 182.32 $ 284.48 98% 33.14 699.25 90.10 $ 1.82 - - 4.45 $ 136.72Fuel Cell - Small (Solid Oxide) $ 1,586 8.50% $ 134.76 $ 8.82 $ 0.50 $ 9.32 $ 144.08 97% 16.96 699.25 54.68 $ 0.03 - - 2.46 $ 78.51SCCT Aero $ 684 9.51% $ 65.02 $ 19.01 $ 0.50 $ 19.51 $ 84.53 21% 45.95 699.25 75.13 $ 6.44 - - 3.41 $ 134.53Intercooled Aero SCCT $ 682 9.51% $ 64.79 $ 26.38 $ 0.50 $ 26.88 $ 91.68 21% 49.83 699.25 65.98 $ 2.35 - - 2.99 $ 124.32Internal Combustion Engines $ 805 9.51% $ 76.49 $ 12.80 $ 0.50 $ 13.<strong>30</strong> $ 89.79 94% 10.90 699.25 58.67 $ 5.20 - - 2.68 $ 82.15SCCT Frame (2 Frame "F") $ 454 8.33% $ 37.83 $ 5.25 $ 0.50 $ 5.75 $ 43.58 21% 23.69 699.25 80.48 $ 9.87 - - 3.79 $ 121.54CCCT (Wet "F" 1x1) $ 814 8.62% $ 70.15 $ 14.93 $ 0.50 $ 15.43 $ 85.57 56% 17.44 699.25 50.51 $ 2.36 - - 2.29 $ 76.36CCCT Duct Firing (Wet "F" 1x1) $ 271 8.62% $ 23.34 - $ 0.50 $ 0.50 $ 23.84 16% 17.01 699.25 62.01 $ 0.10 - - 2.81 $ 85.37CCCT (Wet "F" 2x1) $ 741 8.62% $ 63.82 $ 9.07 $ 0.50 $ 9.57 $ 73.39 56% 14.96 699.25 50.09 $ 2.36 - - 2.27 $ 73.42CCCT Duct Firing (Wet "F" 2x1) $ 249 8.62% $ 21.42 - $ 0.50 $ 0.50 $ 21.92 16% 15.64 699.25 62.01 $ 0.10 - - 2.81 $ 84.00CCCT (Wet "G" 1x1) $ 770 8.62% $ 66.33 $ 11.29 $ 0.50 $ 11.79 $ 78.12 56% 15.92 699.25 49.47 $ 2.32 - - 2.25 $ 73.64CCCT Duct Firing (Wet "G" 1x1) $ 285 8.62% $ 24.59 - $ 0.50 $ 0.50 $ 25.09 16% 17.90 699.25 62.01 $ 0.10 - - 2.81 $ 86.27Other - RenewablesOregon Wind $ 1,737 9.48% $ 164.75 $ 29.78 $ 22.22 $ 52.00 $ 216.75 34% 72.35 - - - - (20.65) - $ 54.99Geothermal, Dual Flash $ 3,346 7.46% $ 249.55 $ 22.60 $ 0.50 $ 23.10 $ 272.65 96% 32.32 - 21.13 $ 5.50 - (20.65) - $ 38.<strong>30</strong>Compressed Air Energy Storage (CAES) $ 685 8.69% $ 59.50 $ 3.45 $ 1.35 $ 4.80 $ 64.31 25% 29.36 699.25 81.60 $ 5.00 - - 3.70 $ 119.67West Side Options (Sea Level)CoalWashington IGCC (Min. Carbon Prep/Level II Controls) $ 2,479 7.82% $ 193.86 $ 81.31 $ 6.00 $ 87.31 $ 281.17 89% 36.06 150.00 13.10 $ 1.10 - - 4.83 $ 55.10Natural GasMicroturbine $ 866 11.21% $ 97.06 $ 172.73 $ 0.50 $ 173.23 $ 270.28 98% 31.48 699.25 90.10 $ 1.73 - - 4.45 $ 134.98Large CHP $ 790 9.84% $ 77.75 $ 14.22 $ 0.50 $ 14.72 $ 92.46 89% 11.93 699.25 81.50 $ (17.75) - - 3.84 $ 86.23Small Non-CT CHP $ 840 9.84% $ 82.66 $ 29.49 $ 0.50 $ 29.99 $ 112.65 85% 15.13 699.25 36.05 $ 0.17 - - 1.75 $ 55.99Small Industrial CHP $ 1,358 9.84% $ 133.60 $ 7.15 $ 0.50 $ 7.65 $ 141.25 90% 17.92 699.25 88.04 $ (0.28) - - 4.49 $ 117.22Small Commercial CHP $ 1,253 9.84% $ 123.29 $ 1.17 $ 0.50 $ 1.67 $ 124.96 90% 15.85 699.25 70.17 $ (0.02) - - 3.84 $ 95.46Fuel Cell - Small (Solid Oxide) $ 1,507 8.50% $ 128.02 $ 8.82 $ 0.50 $ 9.32 $ 137.34 97% 16.16 699.25 54.68 $ 0.03 - - 2.46 $ 77.71SCCT Aero $ 650 9.51% $ 61.77 $ 18.06 $ 0.50 $ 18.56 $ 80.33 21% 43.67 699.25 75.13 $ 6.13 - - 3.41 $ 131.93Intercooled Aero SCCT $ 647 9.51% $ 61.55 $ 25.06 $ 0.50 $ 25.56 $ 87.12 21% 47.36 699.25 65.98 $ 2.23 - - 2.99 $ 121.73Internal Combustion Engines $ 764 9.51% $ 72.67 $ 12.80 $ 0.50 $ 13.<strong>30</strong> $ 85.97 94% 10.44 699.25 58.67 $ 5.20 - - 2.68 $ 81.68SCCT Frame (2 Frame "F") $ 431 8.33% $ 35.94 $ 5.00 $ 0.50 $ 5.50 $ 41.44 21% 22.53 699.25 80.48 $ 9.40 - - 3.79 $ 119.90CCCT (Wet "F" 1x1) $ 773 8.62% $ 66.64 $ 14.22 $ 0.50 $ 14.72 $ 81.36 56% 16.58 699.25 50.51 $ 2.25 - - 2.29 $ 75.39CCCT Duct Firing (Wet "F" 1x1) $ 257 8.62% $ 22.17 - $ 0.50 $ 0.50 $ 22.67 16% 16.18 699.25 62.01 $ 0.10 - - 2.81 $ 84.53CCCT (Wet "F" 2x1) $ 703 8.62% $ 60.63 $ 8.64 $ 0.50 $ 9.14 $ 69.77 56% 14.22 699.25 50.09 $ 2.25 - - 2.27 $ 72.56CCCT Duct Firing (Wet "F" 2x1) $ 236 8.62% $ 20.35 - $ 0.50 $ 0.50 $ 20.85 16% 14.88 699.25 62.01 $ 0.10 - - 2.81 $ 83.24CCCT (Wet "G" 1x1) $ 731 8.62% $ 63.01 $ 10.75 $ 0.50 $ 11.25 $ 74.26 56% 15.14 699.25 49.47 $ 2.21 - - 2.25 $ 72.74CCCT Duct Firing (Wet "G" 1x1) $ 271 8.62% $ 23.36 - $ 0.50 $ 0.50 $ 23.86 16% 17.02 699.25 62.01 $ 0.10 - - 2.81 $ 85.38Other- RenewablesOregon Wind $ 1,729 9.48% $ 163.96 $ 29.78 $ 22.22 $ 52.00 $ 215.96 34% 72.51 - - - - (20.65) - $ 55.15Biomass (closed loop) $ 2,388 7.46% $ 178.11 $ 4.12 $ 0.50 $ 4.62 $ 182.73 91% 22.82 <strong>30</strong>0.00 32.94 $ 1.91 - (20.65) 7.42 $ 44.44Nuclear, Passive Safety $ 2,635 8.01% $ 210.97 $ 109.72 $ 6.00 $ 115.72 $ 326.69 85% 43.87 - 6.35 $ 0.38 - - - $ 50.60Compressed Air Energy Storage (CAES) $ 651 8.69% $ 56.53 $ 3.28 $ 1.35 $ 4.63 $ 61.16 25% 27.93 699.25 81.60 $ 4.76 - - 3.70 $ 117.99Customer Owned Standby Generation $ 170 11.00% $ 18.70 $ 3.50 $ 0.50 $ 4.00 $ 22.70 25% 10.36 - - $ 146.00 - - 6.22 $ 162.59Total <strong>Resource</strong>Cost(Mills/kWh)96
<strong>PacifiCorp</strong> – <strong>2007</strong> IRPChapter 5 – <strong>Resource</strong> Options<strong>Resource</strong> DescriptionsCoalPotential coal resources are shown in the supply-side resource options tables as supercritical pulverizedcoal boilers in Utah 31 and Wyoming, and IGCC facilities in Utah, Wyoming, and WestMain. Supercritical technology was chosen over subcritical technology for pulverized coal for anumber of reasons. Increasing coal costs are making the added efficiency of the supercriticaltechnology cost-effective for long-term operation. Additionally, there is a greater competitivemarketplace for large supercritical boilers than for large subcritical boilers. Increasingly, largeboiler manufacturers only offer supercritical boilers in the 500+ megawatt sizes. Due to the increasedefficiency of supercritical boilers, overall emission quantities are smaller than for a similarlysized subcritical unit. Compared to subcritical boilers, supercritical boilers can follow loadsbetter, ramp to full load faster, use less water, and require less steel for construction. The smallersteel requirements have also leveled the construction cost estimates for the two coal technologies.The costs for a supercritical pulverized coal facility reflect the cost of adding a new unit atan existing site. <strong>PacifiCorp</strong> does not expect a significant difference in cost for a multiple unit at anew site versus the cost of a single unit addition at an existing site.Carbon dioxide capture and sequestration technology represents a potential cost for new and existingcoal plants if future regulations require it. Research projects are underway to develop morecost-effective methods of capturing carbon dioxide from the flue gas of conventional boilers.One such concept involves the use of ammonia and chilling the flue gas. ALSTOM, a major supplierof utility boilers, gas-fired and steam turbine-generators, and air quality control equipmentfor power generation applications, has licensed a chilled ammonia process for the capture of CO 2from the flue gas from pulverized coal and natural gas-fired combined-cycle plants. The processis expected to have application for both new generating units and retrofit applications. This technologyholds the promise that the cost of energy from a pulverized coal plant with CO 2 capturewill be competitive with the cost of energy from an integrated gasification combined cycle plantwith CO 2 capture. 32ALSTOM is currently working on a 5 megawatt (thermal) demonstration scale facility alongwith the Electric Power Research Institute and We Energies that is to be constructed at We Energies’Pleasant Prairie <strong>Plan</strong>t. <strong>PacifiCorp</strong> is participating through EPRI in this CO 2 Pilot Capturestudy; this participation will provide the company with access to summary analysis, performance,and cost projections of the technology. Startup of the project is expected in mid-<strong>2007</strong> withextensive testing for at least one year. American Electric Power (AEP) recently announced plans31 Although the Supply-side <strong>Resource</strong> Options table shows the two Utah supercritical coal resources at 600 MWeach, for modeling purposes, the company assumed that the second Utah resource would be acquired as a 57% shareof 600 MW, or 340 MW.32 The chilled ammonia process entails the use of ammonia in place of amine-based processes. Most studies done todate on CO 2 capture from combustion gases have been based on the use of amine-based systems. Reagent costs areexpected to be lower since ammonia is a reasonably low-cost commodity chemical. The use of ammonia instead ofamine-based systems is expected to minimize the steam requirement associated with regenerating the solvent. Thisreduced steam requirement mitigates the impact on the net capability of the unit. Chilling the flue gas to low temperaturesgreatly reduces the volume of flue gas that has to be treated, thereby reducing equipment and processcosts. The regeneration part of the process also operates at high pressure which reduces the electrical load associatedwith compression of the recovered CO 2 .97
<strong>PacifiCorp</strong> – <strong>2007</strong> IRPChapter 5 – <strong>Resource</strong> Optionsto install a <strong>30</strong> megawatt (thermal) demonstration in 2009 and a 200 megawatt equivalent demonstrationby 2011. Such large demonstrations will verify the commercial status of this process. Itis expected that the chilled ammonia system will be able to remove approximately 90% of theCO 2 in the flue gas.<strong>PacifiCorp</strong> and its parent company MEHC are monitoring CO 2 capture technologies for possibleretrofit opportunities at its existing coal-fired fleet, as well as applicability for future coal plantsthat could serve as cost-effective alternatives to IGCC plants if CO 2 removal becomes necessaryin the future.An alternative to supercritical pulverized-coal technology for coal-based generation would be theuse of IGCC technology. A significant advantage for IGCC when compared to conventional pulverizedcoal with amine-based carbon capture is the reduced cost of capturing carbon dioxidefrom the process. Gasification plants have been built and demonstrated around the world, primarilyas a means of producing chemicals from coal. Only a limited number of IGCC plants havebeen constructed specifically for power generation. In the United States, these facilities havebeen demonstration projects and cost significantly more than conventional coal plants in bothcapital and operating costs. These projects have been constructed with significant funding fromthe federal government. A number of IGCC technology suppliers have teamed up with large constructorto form consortia who are now offering to build IGCC plants. A few years ago, theseconsortia were willing to provide IGCC plants on a lump-sum, turn-key basis. However, in today’smarket, the willingness of these consortia to design and construct IGCC plants on lumpsumturn key basis is in question. An extensive and costly front-end engineering design (FEED)study is required to obtain reasonably accurate estimates of the cost of building an IGCC plant.In 2005-2006, <strong>PacifiCorp</strong> contracted with Worley Parsons to study the cost of an IGCC locatedeither in Utah or Wyoming. The costs presented in the supply-side resource options tables reflectthe general results of that study effort.An IGCC plant can be installed with a number of different configurations. Three different configurationsare presented in the supply-side resource options table for an IGCC installed at aUtah location. One configuration involves installation of Level II emission controls with a sparegasifier and space provisions for future installation of carbon capture equipment. Level II emissioncontrols would include a selective catalytic reduction (SCR) system for enhanced NOx control.A Level II emission control system would achieve emission levels close to those of a naturalgas-fired combined cycle plant. Installation of a spare gasifier would enable availability andcapacity factors close to a conventional pulverized-coal plant. Another IGCC configuration presentedin the supply-side resource options table is for a plant without the spare gasifier. The thirdconfiguration presented is for an IGCC plant with carbon capture. The carbon capture case assumesa cost of $5/MWh for carbon dioxide sequestration; this cost includes the transportation,injection, storage, and monitoring of the carbon dioxide in a local geological formation.<strong>PacifiCorp</strong> is involved in a number of potential IGCC projects that are in various stages of development.Major project development efforts are the Energy Northwest Pacific Mountain EnergyCenter (PMEC) and the Wyoming Infrastructure Authority (EPAct Section 413) project.98
<strong>PacifiCorp</strong> – <strong>2007</strong> IRPChapter 5 – <strong>Resource</strong> OptionsIn March 2006, <strong>PacifiCorp</strong> responded with an expression of interest to Energy Northwest’s invitationto participate in the PMEC project. Energy Northwest is currently in active negotiationswith the two major technology consortia for the next stage of engineering and commercial efforts(Conoco-Phillips/Fluor/Siemens and General Electric/Bechtel), and the project is now goingthrough the Energy Facility Site Evaluation Council (EFSEC) review process. The state ofWashington recently passed Senate Bill 6001—climate change legislation that, among other provisions,implements a generation CO 2 emission standard of 1,100 lbs of CO 2 per MWh (or less)or permanent sequestration which meets the same level. Energy Northwest is currently evaluatingoptions that would allow the PMEC clean coal project to satisfy these emissions levels.<strong>PacifiCorp</strong> was recently selected by the Wyoming Infrastructure Authority (WIA) to participatein joint project development activities for an IGCC facility in Wyoming. The ultimate goal is todevelop a Section 413 project under the EPact. <strong>PacifiCorp</strong> will commission and manage feasibilitystudies with one or more technology suppliers/consortia for an IGCC facility at its JimBridger plant with some level of carbon capture. Alternate Wyoming sites may be considered.During this feasibility study stage, WIA will seek federal funding to support the next stage ofdevelopment, which would include a detailed Front End Engineering Design (FEED) study.In addition to the PMEC and Wyoming IGCC projects, <strong>PacifiCorp</strong> has also been in discussionswith a number of other proposed IGCC projects. These include Summit Power’s IGCC project atClatskanie, Oregon, Mission’s IGCC project at Wallula, Washington, and Xcel’s IGCC projectin Colorado.Finally, <strong>PacifiCorp</strong> actively participates in the Electric Power Research Institute’s CoalFleet program.CoalFleet is a major utility and technology supplier-sponsored initiative to accelerate development,demonstration, and deployment of IGCC. <strong>PacifiCorp</strong> is a member of the GasificationUser’s Association. In addition, <strong>PacifiCorp</strong> communicates regularly with the primary gasificationtechnology suppliers, constructors, and other utilities.Natural GasNatural gas generation options are numerous and a limited number of representative technologiesare included in the supply-side resource options table. Simple cycle and combined cycle combustionturbines are included as well as distributed generation and CHP systems which are discussedbelow.Combustion turbine options include both simple cycle and combined cycle configurations. Thesimple cycle options include traditional frame machines as well as aero-derivative combustionturbines. Two aero-derivative machine options were chosen. The General Electric LM6000 machinesare flexible, high efficiency machines and can be installed with high temperature SCRsystems, which allow them to be located in areas with air emissions concerns. These types of gasturbines are identical to those recently installed at Gadsby and West Valley. LM6000 gas turbineshave quick-start capability (less than 10 minutes to full load) and higher heating value heatrates near 10,000 Btu/kWh. Also selected for the supply-side resource options table is GeneralElectric’s new LMS-100 gas turbine. This machine was recently installed for the first time in acommercial venture. It is a cross between a simple-cycle aero-derivative gas turbine and a framemachine with significant amount of compressor intercooling to improve efficiency. The ma-99
<strong>PacifiCorp</strong> – <strong>2007</strong> IRPChapter 5 – <strong>Resource</strong> Optionschines have higher heating value heat rates of less than 9,500 Btu/kWh and similar starting capabilitiesas the LM6000 with significant load following capability (up to 50 megawatt per minute).Frame simple cycle machines are represented by the “F” class technology. These machines areabout 150 megawatts at western elevations, and can deliver good simple cycle efficiencies.Other natural gas-fired generation options include internal combustion engines and fuel cells.Internal combustion engines are represented by a large power plant consisting of 14 machines at10.9 megawatts. These machines are spark-ignited and have the advantages of a relatively attractiveheat rate, a low emissions profile, and a high level of availability and reliability due to thelarge number of machines. At present, fuel cells hold less promise due to high capital cost, partlyattributable to the lack of production capability and continued development. Fuel cells are notready for large scale deployment and are not considered available as a supply-side option untilafter 2012.Combined cycle power plants options have been limited to 1x1 and 2x1 applications of “F” stylecombustion turbines and a “G” 1x1 facility. The “F” style machine options would allow an expansionof the Lake Side facility. Both the 1x1 and 2x1 configurations are included to give someflexibility to the portfolio planning. Similarly, the “G” machine has been added to take advantageof the improved heat rate available from these more advanced gas turbines. The “G” machine isonly presented as a 1x1 option to keep the size of the facility reasonable for selection as a portfoliooption. These natural gas technologies are considered mature and installation lead times andcapital costs are well known. The capital cost pressure currently being observed with constructinglarge coal-based generation plants is also being experienced with natural gas-fired plants.The increased cost of natural gas has slowed the building of natural gas power plants in recentyears. Over the past year, natural-gas-based resources have not seen the same level of cost increasesas coal-based generation resources. However, this is expected to change; the same marketforces that are affecting the cost of large coal-based projects also impacts the demand formajor equipment, commodities, specialty steels, shop space, and craft labor needed for the constructionof natural gas based resources.WindWind power has experienced rapid development in the U.S., as well as the Northwest. The renewalof the investment tax credit with the Energy Policy Act of 2005 has made the availabilityof wind turbines an increasingly critical issue. The cost for wind turbines has increased significantlyin recent months due to the demand for these machines.The overall strategy for wind project representation was to develop a set of proxy wind sitescomposed of 100 nameplate megawatt blocks that could be selected as distinct resource optionsin the Capacity Expansion Module. (Note that the 100-megawatt size reflects a suitable averagesize for modeling purposes, and does not imply that acquisitions are of this size.) Figure 5.1shows the general regions in which wind resources were assumed to be available and the quantitylimits available to CEM for selection.100
<strong>PacifiCorp</strong> – <strong>2007</strong> IRPChapter 5 – <strong>Resource</strong> OptionsFigure 5.1 – Proxy Wind Sites and Maximum Capacity AvailabilitiesSE WA<strong>30</strong>0 MWNC OR<strong>30</strong>0 MWSC MT200 MWSE ID<strong>30</strong>0 MWSW WY600 MWSE WY600 MWEC NV400 MWWC UT200 MWFor other wind resource attributes, the company used multiple sources to derive attributes.<strong>PacifiCorp</strong> has been very active in purchasing wind projects in the last year. This has given thecompany considerable market knowledge of the current cost of wind development. Consequently,wind resources were developed primarily from <strong>PacifiCorp</strong> experiences with wind developersand from responses to the 2003 renewable resource request for proposals. The EPRI TAGdatabase was also used for certain cost figures, such as operation and maintenance costs. Thesecosts were adjusted for current market conditions.For modeling purposes, it was deemed advantageous to represent wind projects as realistically aspossible by capturing the fluctuation of wind generation on an hourly basis, capturing the systemcosts and effects of the variability, seasonality, and diurnal shape of wind generation. These attributesand the methodologies used to derive them are discussed in Appendix J.Other Renewable <strong>Resource</strong>sOther renewable generation resources included in the supply-side resource options table includegeothermal, biomass, landfill gas, waste heat and solar. The financial attributes of these renewableoptions are based on the TAG database and have been adjusted based on <strong>PacifiCorp</strong>’s recentconstruction and study experience.The geothermal resource is a dual flash design with a wet cooling tower. This concept would besimilar to an expansion of the Blundell <strong>Plan</strong>t. 33 Speculative risks associated with steam field development,as well as recent escalation in drilling costs, are not captured in the geothermal costcharacterization. Note that at the time that <strong>PacifiCorp</strong> was deciding how to address renewable33 A single flash expansion study was performed for Blundell unit 3 and filed with the state commissions in March<strong>2007</strong>. The report is available on the Utah Public Service Commissions web site at:http://www.psc.state.ut.us/elec/05docs/0503554/3-20-07Exhibit%20B.doc.101
<strong>PacifiCorp</strong> – <strong>2007</strong> IRPChapter 5 – <strong>Resource</strong> Optionsresources in the IRP models, the renewable production tax credit was in effect only through theend of <strong>2007</strong>, and the company did not include the credit in its geothermal project economicanalyses. This treatment reflects the view that year-to-year tax credit extensions do not benefitprojects with long development periods typical of a new geothermal plant.The biomass project would involve the combustion of whole trees that would be grown in a plantationsetting, presumably in the Pacific Northwest. The TAG database used a western Washingtonsite. The solar resource available in the TAG database is a solar thermal system using parabolictrough technology with natural gas backup. Such systems have been installed in the southernCalifornia desert for many years. Cost and performance of these trough systems are wellknown.Combined Heat and Power and Other Distributed Generation AlternativesA number of different CHP applications were developed. These options were not derived fromthe EPRI TAG since the license purchased from EPRI was for larger power generation applications.Costs for the CHP options listed come from a 2003 paper from the National RenewableEnergy Laboratory (NREL) entitled “Gas-fired Distributed Energy <strong>Resource</strong> Technology Characterizations”,and were adjusted for recent construction cost increases. CHP options includesmall (one megawatt or less) internal combustion engines with water jacket heat recovery, small(five megawatts or less) combustion turbines with exhaust gas heat recovery, non-combustionturbine based steam turbines (topping turbine cycle) systems to utilize process steam in industrialapplications, and larger (40 to 120 megawatts) combustion turbines with significant steam basedheat recovery from the flue gas. A large CHP concept has not been included in <strong>PacifiCorp</strong>’seastern service territory due to a lack of large potential industrial applications. These CHP opportunitiesare site-specific, and the generic options presented in the supply-side resource optionstable are not intended to represent any particular project or opportunity.In order to derive an estimate of potential CHP capacity availability within <strong>PacifiCorp</strong>’s serviceterritory for modeling purposes, <strong>PacifiCorp</strong> surveyed its Customer Account Managers for projectopportunities and reviewed existing customer account data. A list of strong CHP prospects wasdeveloped. Based on the generic CHP resource capacities used in the supply-side resource optionstables, <strong>PacifiCorp</strong> determined the number of CHP resources to include as options for selectionby the Capacity Expansion Module. Table 5.5 profiles these CHP options by east and westsidelocation.Table 5.5 – CHP Potential ProspectsStrongProspects(MW)Total CHPCapacity Modeled(MW)CHPCHPLocation25 MW Unit 5 MW UnitEast 103 3 units 5 units 100West 66 2 units 2 units 60Energy StorageThe storage of energy is represented in the supply-side resource options table with three systems.The three systems are advanced battery applications, pumped hydro and compressed air energy102
<strong>PacifiCorp</strong> – <strong>2007</strong> IRPChapter 5 – <strong>Resource</strong> Optionsstorage. These technologies convert off-peak capacity to on-peak energy and thereby reduce thequantity of required overall capacity installed for peaking needs. The concepts use TAG data andhave been adjusted to account for current construction market conditions. Battery applicationsare typically smaller systems (less than 10 megawatts) which can have the most benefit in asmaller local area. Pumped hydro is dependant on a good site combined with the ability to permitthe facility, a process that can take many years to accomplish. <strong>PacifiCorp</strong> does not have any specificpumped hydro projects under development. Compressed air energy storage (CAES) can bean attractive means of utilizing intermittent energy. In a CAES plant, off-peak energy is used topressurize an underground cavern. The pressurized air would then feed the power turbine portionof a combustion turbine saving the energy normally used in combustion turbine to compress air.CAES plants operate on a simple cycle basis and therefore displace peaking resources. A CAESplant could be built in conjunction with wind resources to level the production for such an intermittentresource. A CAES plant, whether associated with wind or not, would have to stand on itsown for cost-effectiveness.NuclearAn emissions-free nuclear plant has been included in the supply-side resource options table. Thisoption is based on the TAG database as well as information from a paper prepared by the UraniumInformation Centre Ltd., “The Economics of Nuclear Power,” April 2006. A 600 megawattplant is characterized, utilizing advanced nuclear plant designs. Nuclear power is considered aviable option in the <strong>PacifiCorp</strong> service territory on or after 2018.DEMAND-SIDE RESOURCES<strong>Resource</strong> Selection CriteriaFor the <strong>2007</strong> IRP, <strong>PacifiCorp</strong> evaluated and handled each class of DSM based on its characteristicsand current availability. The company presented its proposed DSM resource representationand modeling methodology at a DSM technical workshop held on February 10, 2006, and consideredpublic feedback in developing its final scheme. The following is a summary, by DSMclass, of how the DSM options were selected for evaluation in the IRP.Class 1 Demand-side ManagementTo address Class 1 programs (fully dispatchable or scheduled firm), the company commissionedQuantec LLC to construct proxy supply curves. (See Appendix B for the entire Quantec DSMsupply curve report.) The supply curves targeted <strong>PacifiCorp</strong>’s existing program expansion opportunities(e.g., air conditioning load control and irrigation load management) and new programopportunities identified as achievable. For modeling purposes, the Class 1 DSM opportunitieswere combined into the following five subcategories:• Subcategory 1 – Fully dispatchable winter programs, such as space heating• Subcategory 2 – Fully dispatchable summer programs, such as air conditioning, water heating,and pool pumps• Subcategory 3 – Fully dispatchable, large commercial and industrial, with a focus on adjustmentof the heating, ventilation, and air conditioning (HVAC) equipment during the topsummer hours• Subcategory 4 – Scheduled firm – irrigation103
<strong>PacifiCorp</strong> – <strong>2007</strong> IRPChapter 5 – <strong>Resource</strong> Options• Subcategory 5 – Thermal energy storage, small commercial and industrial, with a focus oncooling systems for summer hoursClass 2 Demand-side ManagementFor Class 2 programs (non-dispatchable, firm energy efficiency programs), <strong>PacifiCorp</strong> updatedand added new sample load shapes to reflect energy efficiency program opportunities in the marketas identified by recent studies such as the Northwest Power <strong>Plan</strong>ning Council’s 5 th Power<strong>Plan</strong>. For example, based on its review, the company determined that residential lighting loadshapes for the west and east control areas should be added. Table 5.6 lists the load shapesadopted for the <strong>2007</strong> IRP. Chapter 6 discusses how these sample load shapes were used to developcost-effectiveness values of additional Class 2 resources.Note that Class 2 DSM was not included as a resource option in portfolio modeling. The companyis working to complete a more comprehensive system-wide demand-side management potentialstudy scheduled to be completed by June <strong>2007</strong>. This study will be used to develop modeledresource options for Classes 1, 2 and 3 for the next IRP.Table 5.6 – Sample Load Shapes Developed for <strong>2007</strong> IRP Decrement AnalysisEastcommercial coolingcommercial lightingresidential coolingsystem loadresidential lighting*residential – whole house (including AC)** New sample load shapes for the <strong>2007</strong> IRPWestcommercial coolingcommercial lightingresidential coolingsystem loadresidential lighting*residential - heating*Class 3 Demand-side ManagementFor Class 3 DSM (price responsive programs), <strong>PacifiCorp</strong> commissioned Quantec to developproxy supply curves for three Class 3 program concepts: curtailable rates, critical peak pricing,and demand buyback/bidding (DBB) products (See Appendix B). As with the Class 1 DSM resources,the company obtained and considered public feedback from its February 2006 DSMworkshop in selecting these Class 3 DSM resources for the IRP.Class 4 Demand-side ManagementClass 4 resources are sought by the company. However, these resources are not currently takeninto consideration within the <strong>2007</strong> IRP because they cannot be relied upon for planning purposesor cannot be easily quantified. Over time, most Class 4 DSM savings manifest themselves withinthe company’s loads and load forecasts.<strong>Resource</strong> Options and AttributesClass 1 Demand-side ManagementTables 5.7 and 5.8 summarize the key attributes for the five DSM Class 1 program subcategorieslisted above for the west and east control areas respectively. Appendix B provides more informationon how the attributes were derived. Attributes are provided for three scenarios: low, base,104
<strong>PacifiCorp</strong> – <strong>2007</strong> IRPChapter 5 – <strong>Resource</strong> Optionsand high achievable potential. These scenarios reflect <strong>PacifiCorp</strong> assumed on-peak electricitymarket prices of $40/MWh, $60/MWh, and $100/MWh respectively, as well as incrementallyhigher <strong>PacifiCorp</strong> marketing efforts, program costs, and customer participation levels. As alreadynoted, Quantec developed these attributes for creation of <strong>PacifiCorp</strong> DSM resources for portfoliomodeling. 34 The sources for the DSM attributes are Figures B.20 and B.21 in Appendix B, reflectingthe “no metering” cost assumptions (Also see the “Treatment of Metering Cost” sectionin Appendix B.).Table 5.7 – Class 1 DSM Program Attributes, West Control AreaAttributesFully Dis-patchable-WinterFully Dispatchable-SummerFully Dispatchable- LargeC&IScheduledFirm - IrrigationThermalEnergyStorageVariable Costs ($/MWh) $ - $ - $ - $ - $ -Demand Reduction Period(Hours) 2 2 4 6 6Start Year 2009 2009 2009 2009 2009BASETotal Achievable Potential–Maximum (MW) 21 8 1 32 3<strong>Resource</strong> Costs ($/kW/yr) $ 75 $ 57 $ 89 $ 28 $ 119LOWTotal Achievable Potential --Maximum (MW) 11 2 0 26 3<strong>Resource</strong> Costs ($/kW/yr) $ 57 $ 60 $ 185 $ 29 $ 116HIGHTotal Achievable Potential --Maximum (MW) 32 10 3 38 4<strong>Resource</strong> Costs ($/kW/yr) $ 83 $ 69 $ 104 $ 37 $ 121Hours Available by MonthJanuary 3 - - - -February - - - - -March - - - - -April - - - - 240<strong>May</strong> - - - - 186June - 8 8 96 180July - 46 46 96 186August - 33 33 96 186September - - - 48 180October - - - - 279November - - - - -December 84 - - - -34 Quantec’s DSM resource attributes were considered interim information needed to complete the <strong>2007</strong> IRP whilethe company works to complete a more comprehensive system-wide demand-side management potential studyscheduled to be completed by June <strong>2007</strong>.105
<strong>PacifiCorp</strong> – <strong>2007</strong> IRPChapter 5 – <strong>Resource</strong> OptionsTable 5.8 – Class 1 DSM Program Attributes, East Control AreaAttributesFully Dis-patchable-WinterFully Dispatchable-SummerFully Dispatchable- LargeC&IScheduledFirm - IrrigationThermalEnergyStorageVariable Costs ($/MWh) $ - $ - $ - $ - $ -Demand Reduction Period(Hours) 2 2 4 6 6Start Year 2009 2009 2009 2009 2009BASETotal Achievable Potential–Maximum (MW) 16 48 2 15 6<strong>Resource</strong> Costs ($/kW/yr) $ 75 $ 58 $ 82 $ 27 $ 117LOWTotal Achievable Potential --Maximum (MW) 8 13 0 3 4<strong>Resource</strong> Costs ($/kW/yr) $ 57 $ 52 $ 159 $ 28 $ 115HIGHTotal Achievable Potential --Maximum (MW) 25 66 7 28 7<strong>Resource</strong> Costs ($/kW/yr) $ 83 $ 71 $ 101 $ 36 $ 118Hours Available by MonthJanuary 3 - - - -February - - - - -March - - - - -April - - - - 240<strong>May</strong> - - - - 186June - 8 8 96 180July - 46 46 96 186August - 33 33 96 186September - - - 48 180October - - - - 279November - - - - -December 84 - - - -Class 2 Demand-side ManagementFigures 5.2 and 5.3 show the hourly end use shapes used for the Class 2 DSM decrement analysis.Figure 5.2 plots the hourly end use shapes for the peak day use for each of the 10 end uses.Figure 5.3 illustrates the seasonality of the end uses by plotting peak demand for each week. Theeast residential cooling shape was derived from an in-house metering study. All other shapes arecomposites of end use patterns from the Northwest Power <strong>Plan</strong>ning and Conservation Council.The megawatt scale on the y–axis of Figures 5.2 and 5.3 is for illustration purposes only anddoes not represent the market potential or planning estimates of any particular program for agiven end use. For example, the commercial cooling shape was created from system specificweighting of hospital, school, office, lodging, and service cooling end use shapes.106
<strong>PacifiCorp</strong> – <strong>2007</strong> IRPChapter 5 – <strong>Resource</strong> OptionsFigure 5.2 – DSM Decrement, Daily End Use Shape (megawatts)120East and West Commercial CoolingPeak Day End Use Shape - 16% LFResidential HeatingPeak Day End Use Shape - 28% LF120100100808060604040202001 2 3 4 5 6 7 8 9 10 11 12 13 14 15 16 17 18 19 20 21 22 23 2401 2 3 4 5 6 7 8 9 10 11 12 13 14 15 16 17 18 19 20 21 22 23 24120East and West Commercial LightingPeak Day End Use Shape 49% LF120West Residential Whole HousePeak Day End Use Shape - 35% LF100100808060604040202001 2 3 4 5 6 7 8 9 10 11 12 13 14 15 16 17 18 19 20 21 22 23 2401 2 3 4 5 6 7 8 9 10 11 12 13 14 15 16 17 18 19 20 21 22 23 24East Residential CoolingPeak Day End Use Shape - 12% LFResidential LightingPeak Day End Use Shape - 60% LF120120100100808060604040202001 2 3 4 5 6 7 8 9 10 11 12 13 14 15 16 17 18 19 20 21 22 23 2401 2 3 4 5 6 7 8 9 10 11 12 13 14 15 16 17 18 19 20 21 22 23 24120East Residential Whole HousePeak Day End Use Shape - 46% LF120West Residential CoolingPeak Day End Use Shape - 20% LF100100808060604040202001 2 3 4 5 6 7 8 9 10 11 12 13 14 15 16 17 18 19 20 21 22 23 2401 2 3 4 5 6 7 8 9 10 11 12 13 14 15 16 17 18 19 20 21 22 23 24107
<strong>PacifiCorp</strong> – <strong>2007</strong> IRPChapter 5 – <strong>Resource</strong> OptionsFigure 5.3 – DSM Decrement, Weekly Peaks (megawatts) 35120East and West Commercial CoolingWeekly Peaks Decrement120Residential HeatingWeekly Peaks Decrement100100808060604040202001 3 5 7 9 11 13 15 17 19 21 23 25 27 29 31 33 35 37 39 41 43 45 47 49 5101 3 5 7 9 11 13 15 17 19 21 23 25 27 29 31 33 35 37 39 41 43 45 47 49 51120East and West Commercial LightingWeekly Peaks Decrement120West Residential Whole HouseWeekly Peaks Decrement100100808060604040202001 3 5 7 9 11 13 15 17 19 21 23 25 27 29 31 33 35 37 39 41 43 45 47 49 5101 3 5 7 9 11 13 15 17 19 21 23 25 27 29 31 33 35 37 39 41 43 45 47 49 51120East Residential CoolingWeekly Peaks Decrement120West Residential CoolingWeekly Peaks Decrement100100808060604040202001 3 5 7 9 11 13 15 17 19 21 23 25 27 29 31 33 35 37 39 41 43 45 47 49 5101 3 5 7 9 11 13 15 17 19 21 23 25 27 29 31 33 35 37 39 41 43 45 47 49 51120East Residential Whole HouseWeekly Peaks Decrement1008060402001 3 5 7 9 11 13 15 17 19 21 23 25 27 29 31 33 35 37 39 41 43 45 47 49 5135 Weekly residential lighting peaks are constant throughout the year, though the daily timing of the peak can varywith the season.108
<strong>PacifiCorp</strong> – <strong>2007</strong> IRPChapter 5 – <strong>Resource</strong> OptionsClass 3 Demand-side ManagementTables 5.9 and 5.10 summarize the key attributes for three DSM Class 3 program subcategories(curtailable rates, critical peak pricing and demand buyback) for the west and east control arearespectively. Attributes are provided for three scenarios: low, base, and high achievable potential.These scenarios reflect <strong>PacifiCorp</strong> assumed on-peak electricity market prices of $40/MWh,$60/MWh, and $100/MWh respectively, as well as incrementally higher marketing efforts, programcosts, and customer participation levels. Appendix B provides more information on howthe Class 3 DSM attributes were derived.Table 5.9 – Class 3 DSM Program Attributes, West Control AreaAttributesCurtailableRatesCritical PeakPricingDemandBuybackVariable Costs ($/MWh) $ - $ - Market PricesDemand Reduction Period (Hours) 4 4 10Start Year 2009 2009 2009BASETotal Achievable Potential --Maximum (MW) 21 3 8<strong>Resource</strong> Costs ($/kW/yr) $ 50 $ 56 $ 14LOWTotal Achievable Potential --Maximum (MW) 9 0 3<strong>Resource</strong> Costs ($/kW/yr) $ 39 $ 136 $ 14HIGHTotal Achievable Potential --Maximum (MW) 26 5 18<strong>Resource</strong> Costs ($/kW/yr) $ 86 $ 48 $ 19Hours Available by MonthJanuary - - -February - - -March - - -April - - -<strong>May</strong> - - -June - - -July 69 69 129August 18 18 46September - - -October - - -November - - -December - - -109
<strong>PacifiCorp</strong> – <strong>2007</strong> IRPChapter 5 – <strong>Resource</strong> OptionsTable 5.10 – Class 3 DSM Program Attributes, East Control AreaAttributesCurtailableRatesCritical PeakPricingDemandBuybackVariable Costs ($/MWh) $ - $ - Market PricesDemand Reduction Period (Hours) 4 4 10Start Year 2009 2009 2009BASETotal Achievable Potential --Maximum (MW) 51 5 19<strong>Resource</strong> Costs ($/kW/yr) $ 50 $ 40 $ 14LOWTotal Achievable Potential --Maximum (MW) 22 1 6<strong>Resource</strong> Costs ($/kW/yr) $ 38 $ 89 $ 13HIGHTotal Achievable Potential --Maximum (MW) 63 9 46<strong>Resource</strong> Costs ($/kW/yr) $ 86 $ 36 $ 18Hours Available by MonthJanuary - - -February - - -March - - -April - - -<strong>May</strong> - - -June - - -July 69 69 129August 18 18 46September - - -October - - -November - - -December - - -<strong>Resource</strong> DescriptionsClass 1 Demand-side ManagementClass 1 programs are divided into two types: fully-dispatchable and scheduled-firm. Often referredto as direct load control (DLC), fully-dispatchable programs are designed to reduce thedemand during peak periods by turning off equipment or limiting the “cycle” time (i.e., frequencyand duration of periods when the equipment is in operation) during system peak. Theofferings for the residential sector are seasonally divided, while the potential with large commercialand industrial customers typically focus on summer cooling loads only. <strong>PacifiCorp</strong>’s fullydispatchableresource options are as follows:● Winter – Direct load control of water and space heating during winter are the program optionsconsidered in this class. This program would be dispatched during the morning andevening peak hours. The largest potential for such a program will be in the west control areabecause of the higher saturation of electric space and water heating. Incentives are generally110
<strong>PacifiCorp</strong> – <strong>2007</strong> IRPChapter 5 – <strong>Resource</strong> Optionspaid on a monthly basis. Although there are no large scale DLC programs in the Northwest,Portland General Electric (PGE) and Puget Sound Energy (PSE) have both studied implementationthrough pilot programs. Nationally, there are many utilities with space and/or waterheating controls, including Duke Power, Wisconsin Power and Light, Great River Energy,and Alliant Energy.● Summer – The main demand reduction (DR) product in this group is direct load control ofair-conditioning units, which are typically dispatched during the hottest summer days, andare common place due to the relatively high summer loads in warm climates. <strong>PacifiCorp</strong> currentlypays monthly incentives to residential and small commercial participants in Utah’sCool Keeper AC Load Control program. There is approximately 1<strong>30</strong> megawatts of connectedload for this program, which is expected to increase to 180 megawatt by summer <strong>2007</strong>. Usinga 50% cycling dispatch strategy, approximately half can be expected during an event. In additionto those utilities listed above, Nevada Power, Florida Power and Light, Alliant Energy,MidAmerican Energy and the major utilities in California run air conditioner direct load controlprograms (e.g., Sacramento Municipal Utility District and San Diego Gas and Electric).● Large Commercial and Industrial – Direct control of large commercial and industrial(C&I) customers requires coordination with the existing energy management systems (EMS).The focus of this program type is adjustment of the HVAC equipment during the top summerhours. Incentives are generally paid on a per-kW or per-ton (of cooling equipment) basis.Some utilities running comparable programs include Florida Light & Power, Hawaiian Electric,and Southern California Edison.Scheduled-firm program strategies are those that provide consistent reductions during prespecifiedhours, and target customers with usage patterns and technology that allow scheduledshifting of consumption from peak to off-peak periods. These program strategies include thefollowing:● Irrigation Pumping – Irrigation load control is a candidate for summer DR due to the relativelylow load factor (approximately <strong>30</strong>%) of pumping equipment and the coincidence ofthese loads with system summer peak. Through <strong>PacifiCorp</strong>’s irrigation load control program,customers subscribe in advance for specific days and hours when their irrigation systems willbe turned off. Load curtailment is executed automatically based on a pre-determined schedulethrough a timer device. Although a total of 100 megawatts is contracted with this program,only half is available due to the alternating schedules of program participants. In theNorthwest, Bonneville Power Authority (BPA) has run a pilot irrigation program (on a dispatch,rather than scheduled, basis) and Idaho Power has a program similar to that of Pacifi-Corp.● Thermal Energy Storage – For small commercial and industrial customers, it is possible tohave thermal energy storage (TES) cooling systems that produce ice during off-peak periods,which is then used during the on-peak period to cool the building. The system is programmedto use ice-cooling during pre-specified times (typically six hours per day, from April to October)and participants are given incentives on a per-kW or per-ton-of-cooling basis.111
<strong>PacifiCorp</strong> – <strong>2007</strong> IRPChapter 5 – <strong>Resource</strong> OptionsClass 2 Demand-side ManagementClass 2 DSM programs are not modeled in the <strong>2007</strong> IRP as resource options; rather, these arehandled as a decrement to the load forecast. Appendix A provides descriptions of <strong>PacifiCorp</strong>’scurrent Class 2 programs.Class 3 Demand-side ManagementCurtailable rate options have been offered by many utilities in the United States for many years.These programs are designed to ease system peak by requiring that customers shed load by a setamount or to a set level (such as by turning off equipment or relying more heavily on on-sitegeneration) when requested by the utility. Participants are either provided with a fixed rate discountor variable incentives, depending on load reduction; penalties are often levied for participantswho do not respond to curtailment events. Large commercial and industrial customers arethe target market for those programs that address <strong>PacifiCorp</strong>’s summer system peak. Many utilitiesprovide a broad range of program options, including Duke Power, Georgia Power, DominionVirginia Power, Pacific Gas and Electric, Consolidated Edison, Southern California Edison,MidAmerican Energy Company, and Wisconsin Power and Light.Critical peak pricing (CPP) rates only take effect a limited number of times during the year. Intimes of emergency or high market prices, the utility can invoke a critical peak event, where customersare notified and rates become much higher than normal, encouraging customers to shedor shift load. Typically, the CPP rate is bundled with a time-of-use rate schedule, whereby customersare given a lower off-peak rate as an incentive to participate in the program. Customers inall customer classes (residential, commercial, and industrial) may choose to participate in a CPPprogram, although there are certain segments in the commercial sector that are less able to reactto critical peak pricing signals. Currently, there are no CPP programs being offered by Northwestutilities. Peak pricing is, however, being offered through experimental pilots or full-scale programsby several organizations in the United States, notably Southern Company (GeorgiaPower), Gulf Power, Niagara Mohawk, California utilities (SCE, PG&E, SDG&E), PJM Interconnection,and New York ISO (NYISO). Adoption of CPP has not been as widespread in theWestern states as they have in the East. In the Pacific Northwest, this may be partly explained bythe generally milder climate and the fact that, due mainly to large hydroelectric resources, energy,rather than capacity, tends to be the constraining factor.Demand buyback/bidding (DBB) products are designed to encourage customers to curtail loadsduring system emergencies or high price periods. Unlike curtailment programs, customers havethe option to curtail power requirements on an event-by-event basis. Incentives are paid to participantsfor the energy reduced during each event, based primarily on the difference betweenmarket prices and the utility rates. Since 2001, all major investor-owned utilities in the Northwestand Bonneville Power Administration have offered variants of this option. <strong>PacifiCorp</strong>’scurrent program, Energy Exchange, was used extensively during 2001 and resulted in maximumreduction of slightly over 40 megawatts in that period. Demand reductions from <strong>PacifiCorp</strong>’scurrent program are approximately 1 megawatt. Demand buyback products are common in theUnited States and are being offered by many major utilities. The use of DBB offerings as ameans of mitigating price volatility in power markets is especially common among independentsystem operators including CAISO, NYISO, PJM, and ISO-NE. However, DBB options are notcurrently being exercised regularly due to relatively low power prices.112
<strong>PacifiCorp</strong> – <strong>2007</strong> IRPChapter 5 – <strong>Resource</strong> OptionsTRANSMISSION RESOURCES<strong>Resource</strong> Selection Criteria<strong>PacifiCorp</strong> developed its transmission resource options to support new generation options includedin the IRP models, to enhance transfer capacity and reliability across <strong>PacifiCorp</strong>’s system,and to boost import/export capability with respect to external markets. These options includedtransmission projects targeted for investigation as part of the MEHC acquisition commitments.(See Chapter 2, “MidAmerican Energy Holdings Company IRP Commitments.”)<strong>Resource</strong> Options and AttributesTransmission options developed for portfolio analysis are shown in Table 5.11. 36 The columnlabeled “Point A” indicates one end of the transmission path, and “Point B” the other end. Themaximum capacity associated with moving generation from one end to the other is shown in thesubsequent columns. For resource optimization modeling, the CEM was allowed to phase intransmission purchases in 500 megawatts blocks as needed for four of the transmission paths:Bridger East-Ben Lomond (4); Mona-Utah North (5); Wyoming-Bridger East (8); and UtahNorth-West Main (9). Included in all portfolios is the MidAmerican Energy Holdings Companycommitment (34a) for the <strong>30</strong>0 megawatt Path C upgrade assumed to be available in 2010. Thetransmission options as represented in the model topology are shown in Figure 5.4.Table 5.11 – Transmission OptionsNo. Point A Point BA to B Capacity(MW)B to A Capacity(MW)First YearAvailableNumber ofAdditions1 Walla Walla Yakima A 6<strong>30</strong> 0 2010 12 Walla Walla Yakima B 400 400 2010 13 West Main Walla Walla 6<strong>30</strong> 0 2010 14 Jim Bridger East Ben Lomond 500 0 2012 45 Mona Utah North 500 0 2012 26 Path C – South Utah North 600 0 2011 17 Yellowtail Jim Bridger 400 0 2011 18 Wyoming Jim Bridger East 500 500 2012 39 Utah North West Main 500 500 2012 610 Utah South Desert Southwest (includesMona-Oquirrh)600 600 2012 1Base Transmission Assumptions – For All Portfolios11 Path C – South Utah North <strong>30</strong>0 0 2010 112 Craig-Hayden Park City 176 0 2010 136 The <strong>2007</strong> integrated resource plan used proxy transmission additions for portfolio planning purposes. The timingand cost of these proxy additions are based on high level planning estimates which are subject to change as moreinformation becomes available. The company may address specific transmission needs by entering into new wheelingcontracts, building additional facilities, or participating in joint transmission projects.113
<strong>PacifiCorp</strong> – <strong>2007</strong> IRPChapter 5 – <strong>Resource</strong> OptionsTransmission requirements associated specifically with wind resources located in southwestWyoming, southeast Wyoming, and eastern Nevada were not modeled as transmission pathswithin the CEM. The transmission costs associated with those resources were included in thecapital costs of the wind resources themselves, with the generation modeled as occurring (as delivered)in Utah North for the southwest Wyoming wind; Jim Bridger East for the southeasternWyoming wind; and Utah South for the eastern Nevada wind.In addition to these resource options, <strong>PacifiCorp</strong> also modeled a regional transmission project forsensitivity analysis using the Capacity Expansion Module. This resource serves as a proxy forprojects like the proposed Frontier Project that links generation in Wyoming with load centers inUtah, Nevada and California. See Chapter 6, “Scenario and Sensitivity Study Development”, formore details on how this regional transmission resource was modeled.Figure 5.4 – Transmission Options Topology1. Walla Walla to Yakima A2. Walla Walla to Yakima BYakimaMid-CBPA3. West Main to Walla WallaWalla WallaMontanaGoshen7. Yellowtail to BridgerWest MainBridger WestBorahBrady8. Wyoming to BridgerCOB9. Utah North to West MainPath C (N)Path C (S)Bridger EastWyoming6. Additional Path C UpgradeUtah North4. Bridger to Ben Lomond5. Mona to Utah NorthMonaColoradoUtah South10. Utah South to4 Corners4 CornersArizonaWestEastLoadPalo VerdeAPStransChollaGenerationPurchase/Sale MarketsContracts/Exchanges<strong>PacifiCorp</strong> Merchant Transmission RightsMARKET PURCHASES<strong>Resource</strong> Selection Criteria<strong>PacifiCorp</strong> and other utilities engage in purchases and sales of electricity on an ongoing basis tobalance the system and maximize the economic efficiency of power system operations. In additionto reflecting spot market purchase activity and existing long-term purchase contracts in the114
<strong>PacifiCorp</strong> – <strong>2007</strong> IRPChapter 5 – <strong>Resource</strong> OptionsIRP portfolio analysis, <strong>PacifiCorp</strong> modeled front office transactions (FOT). Front office transactionsare proxy resources, assumed to be firm, that represent procurement activity expected to bemade on an annual forward basis to help the company cover short positions.For this IRP, <strong>PacifiCorp</strong> tested portfolios that included a limit of 1,200 megawatts of front officetransactions beyond 2011. Table 5.12 shows the maximum capacity available for the four markethubs in cases where front office transactions limits were applied.Table 5.12 – Maximum Available Front Office Transaction Quantities by Market HubMaximum AvailableCapacityMarket Hub(MW)West Main 250Mid Columbia 250Four Corners 500Mona 200TOTAL 1,200To arrive at these maximum quantities, <strong>PacifiCorp</strong> considered the following:• Historical operational data and institutional experience with transactions at the market hubs.• The company’s forward market view, including an assessment of expected physical deliveryconstraints and market liquidity and depth.• Financial and risk management consequences associated with acquiring purchases at higherlevels, such as additional credit and liquidity costs.<strong>Resource</strong> Options and AttributesTwo front office transaction types were included for portfolio analysis: a west-side annual flatproduct, and an east-side heavy load hour (HLH) 3 rd quarter product. The west-side transactionreflects purchases of flat annual energy—a constant delivery rate over all the hours of a year—delivered to the West Main bubble. 37 The east-side transactions are represented as heavy loadhour (16 hours per day, 6 days per week) purchases from July through September available fordelivery at both the Mona and Four Corners market hubs. Because these products are assumed tobe firm for this IRP, the capacity contribution of front office transactions is grossed up for purposesof meeting the planning reserve margin. For example, a 100 megawatt front office transactionis treated as a 112 megawatt contribution to meeting a 12 percent planning reserve margin,with the selling counterparty holding the reserves necessary to make the product firm.Prices for front office transaction purchases are associated with specific market hubs—Mid-Columbia (Mid-C), Mona, and Four Corners—and are set to the relevant forward market pricesfor the relevant time period and location.37 A bubble refers to a distinct area of a system model’s network topology encompassing one or a combination of thefollowing attributes: load, generation, markets (purchases and sales), and transmission facilities. A bubble is alsoreferred to as a transmission area.115
<strong>PacifiCorp</strong> – <strong>2007</strong> IRPChapter 5 – <strong>Resource</strong> Options<strong>Resource</strong> DescriptionAs proxy resources, front office transactions represent a range of purchase transaction types.They are usually standard products, such as heavy load hour (HLH), light load hour (LLH),and/or daily HLH call options (the right to buy or “call” energy at a “strike” price) and typicallyrely on standard enabling agreements as a contracting vehicle. Front office transaction prices aredetermined at the time of the transaction, usually via a third party broker and based on the viewof each respective party regarding the then-current forward market price for power. An optimalmix of these purchases would include a range in terms for these transactions.Solicitations for front office transactions can be made years, quarters or months in advance. Annualtransactions can be available up to as much as three or more years in advance. Seasonaltransactions are typically delivered during quarters and can be available from one to three yearsor more in advance. The terms, points of delivery, and products will all vary by individual marketpoint.Proposed Use and Impact of Physical and Financial HedgingThe company proposes to continue to hedge the price risk inherently carried due to volume mismatchesbetween sales obligations and economic resources by purchasing or selling fixed-priceenergy in the forward market. The purpose of these transactions is to mitigate the company’sfinancial exposure to the short term markets, which historically have much greater price volatilitythan the longer term markets. Specifically, purchasing to cover a short position in the forwardmarket reduces the company’s financial exposure to increasing prices, albeit these transactionsalso reduce the company’s financial opportunity if prices decrease. Selling to cover a longposition has a similar effect.The company proposes to continue to hedge its electricity and natural gas fixed-price exposureusing both physical products and financial products. Both products are effective in hedging thisexposure.116
<strong>PacifiCorp</strong> – <strong>2007</strong> IRPChapter 6 – Modeling and Risk Analysis Approach6. MODELING AND RISK ANALYSIS APPROACHChapter Highlights The IRP modeling effort seeks to determine the comparative cost, risk, supply reliability,and emissions attributes of resource portfolios. The <strong>2007</strong> IRP modeling effort consisted of three phases: (1) resource screening usingthe company’s capacity expansion optimization tool (the Capacity Expansion Module,or CEM), (2) risk analysis portfolio development, and (3) detailed probabilistic (stochastic)production cost simulation and resource risk analysis. For resource screening, <strong>PacifiCorp</strong> defined 16 alternative future scenarios and associatedsensitivity studies with the assistance of public stakeholders. These alternative futurestest wide variations in potential CO 2 regulatory costs, natural gas prices, wholesaleelectricity prices, retail load growth, and the scope of renewable portfolio standards. In addition, the company defined futures to evaluate the availability of renewable productiontax credits and the level of achievable market potential for load control anddemand-response programs. <strong>PacifiCorp</strong> next defined risk analysis portfolios for stochastic simulation. The CEMwas used to help build fixed resource investment schedules for wind and distributed resources,and to optimize the selection of other resource options according to specific resourcestrategies. <strong>PacifiCorp</strong> devoted considerable effort to model the effect of CO 2 emission compliancestrategies. All risk analysis portfolios were simulated with five CO 2 adder levels—$0/ton, $8/ton, $15/ton, $38/ton, and $61/ton (in 2008 dollars)—and associated forwardgas/electricity price forecasts. The company modeled both a cap-and-trade and emissionstax compliance strategy, and expanded its reporting of CO 2 emissions impacts. Portfolio performance was assessed with the following measures: (1) stochastic meancost (Present Value of Revenue Requirements), (2) customer rate impact, measured asthe levelized net present value of the change in the system average customer price dueto new resources for 2008 through 2026, (3) emissions externality cost, (4) capital cost,(5) risk exposure, (6) CO 2 and other emissions, (7) and supply reliability statistics. The preferred portfolio is selected from among the risk analysis portfolios primarily onthe basis of relative cost-effectiveness, customer rate impact, and cost/risk balanceacross the CO 2 adder levels.117
<strong>PacifiCorp</strong> – <strong>2007</strong> IRPChapter 6 – Modeling and Risk Analysis ApproachINTRODUCTIONThe IRP modeling effort seeks to determine the comparative cost, risk, reliability, and pollutantemissions attributes of resource portfolios. These portfolio attributes form the basis of an overallportfolio performance evaluation. This chapter describes the modeling and risk analysis processthat supported portfolio performance evaluation. The information drawn from this process,summarized in Chapter 7, was used to help determine <strong>PacifiCorp</strong>’s preferred portfolio.The <strong>2007</strong> IRP modeling effort consists of three phases: (1) resource screening, (2) risk analysisportfolio development, and (3) detailed production cost and stochastic risk analysis. The CapacityExpansion Module (CEM) supports resource screening and development of risk analysis portfolios.Detailed production cost simulation and associated stochastic analysis, which attempts toquantify the most significant sources of portfolio risk, are supported by the <strong>Plan</strong>ning and Risk(PaR) Module. Figure 6.1 characterizes the three phases in flow chart form, showing the mainsteps involved and how these phases are linked with the preferred portfolio selection phase (farright on the chart). This chapter covers each of these steps.Figure 6.1 – Modeling and Risk Analysis Process<strong>Resource</strong> Screening and Risk AnalysisPortfolio Development(Capacity Expansion Module)Detailed Stochastic ProductionCost Simulation and Risk Analysis(<strong>Plan</strong>ning and Risk Module)Preferred PortfolioSelection<strong>Resource</strong> ScreeningScenario development:“alternative future” andsensitivity studiesConduct CEMoptimization runs for each scenarioConductsimulations forvarious CO 2 costadder levelsConductsensitivityanalysissimulationsPortfolioperformancemeasuresRisk Analysis Portfolio DevelopmentDetermine fixed resourceinvestment schedulesDevelop alternativeresource strategiesConduct CEM portfoliooptimization runs to specifyrisk analysis portfoliosRisk Analysis PortfoliosSelect thepreferredportfolioClass 2 DSM DecrementAnalysisRESOURCE SCREENINGFor resource screening, <strong>PacifiCorp</strong> evaluated generation, demand-side management, market purchase,and transmission resources on a comparable basis using the Capacity Expansion Module.The CEM performs a deterministic least-cost optimization with these resources over the twentyyearstudy horizon. To support resource screening, the company developed a set of “alternativefuture” scenarios to study. These scenarios consist of combinations of input variables represent-118
<strong>PacifiCorp</strong> – <strong>2007</strong> IRPChapter 6 – Modeling and Risk Analysis Approaching the primary sources of portfolio cost uncertainty. Additional sensitivity analysis scenarioswere also developed to investigate the individual effects of certain planning and resourcespecificassumptions.The main objectives of this screening effort include the following:• Determine and study resource selection choices given different assumptions about the future• Determine the range of resource quantities selected for alternative future scenarios designedto favor one or more resource types over others.• Identify the frequency of resources selected across the alternative futures modeled.• Determine acquisition patterns (quantities and timing) for smaller-scale resource types—front office transactions, wind, DSM programs, and Combined Heat and Power facilities—tobe incorporated into the risk analysis portfolios based on an aggregate view of the alternativefuture modeling results.Alternative Future ScenariosThe alternative future scenarios consist of cases to test the impact of variations in load growth aswell as combinations of several variable values that simulate conditions variously favorable andunfavorable to the major resource types (coal, gas, renewables, and DSM). The input variableschosen to represent the alternative futures consist of the following:• Incremental coal cost, consisting of new CO 2 regulatory costs (via a dollar-per-ton CO 2 adder)and alternative commodity price trends driven by assumptions on coal production andtransportation costs.• Natural gas and wholesale electricity prices, based on <strong>PacifiCorp</strong>’s forward price curves• Retail load growth• The level of renewable electricity generation requirements stemming from renewable portfoliostandard (RPS) regulations• The availability of renewable energy Production Tax Credits (PTCs) after <strong>2007</strong>• The potential for demand-side management programs, defined as a program’s achievablemarket potential adjusted to account for competition with existing programs<strong>PacifiCorp</strong> developed low, medium, and high values for each of these input variables to ensurethat a reasonably wide range in potential outcomes is captured. The one exception is for renewablePTC availability, which was structured as a yes-or-no outcome.Table 6.1 profiles the 16 alternative future scenarios developed, indicating the assigned variablevalue levels for each of the six input variables. Note that alternative future scenarios are labeledwith the acronym “CAF”, which stands for CEM alternative future. The CAF studies include abusiness-as-usual case reflecting no new regulatory requirements (CAF00) and a medium casebased on the company’s official load forecast and forward price curves (CAF11, “medium loadgrowth”). All CAF scenarios assume a 15-percent planning reserve margin.119
<strong>PacifiCorp</strong> – <strong>2007</strong> IRPChapter 6 – Modeling and Risk Analysis ApproachTable 6.1 – Alternative Future ScenariosCoal Cost:CO 2 Adder/CoalCommodityGas/ElectricRenewableSalesPercentageRenewablePTCCAF# NamePrice PriceLoadGrowthDSMdue to RPS Availability Potential0 Business As Usual None/Medium Medium Medium Low Yes Medium1 Low Cost Coal/High Cost Gas None/Low High Medium Medium Yes Medium2 with Low Load Growth None/Low High Low Medium Yes Medium3 with High Load Growth None/Low High High Medium Yes Medium4 High Cost Coal/Low Cost Gas High/High Low Medium Medium Yes Medium5 with Low Load Growth High/High Low Low Medium Yes Medium6 with High Load Growth High/High Low High Medium Yes Medium7 Favorable Wind Environment High/Medium High Medium High Yes Medium8 Unfavorable Wind Environment None/Medium Low Medium Low No Medium9 High DSM Potential High/Medium High Medium Medium Yes High10 Low DSM Potential None/Medium Low Medium Medium Yes Low11 Medium Load Growth Medium/Medium Medium Medium Medium Yes Medium12 Low Load Growth Medium/Medium Medium Low Medium Yes Medium13 High Load Growth Medium/Medium Medium High Medium Yes Medium14 Low Cost Portfolio Bookend None/Low Low Low Medium Yes Medium15 High Cost Portfolio Bookend High/High High High Medium No MediumVariable Value Frequency Counts (Excluding "Business As Usual" Scenario)"High" Count 6/4 6 4 1 N/A 1"Medium" Count 3/7 3 7 13 N/A 13"Low" and "None" Count 6/4 6 4 1 N/A 1TOTALS 15/15 15 15 15 N/A 15In developing these scenarios as well as other CEM studies, <strong>PacifiCorp</strong> relied heavily on feedbackfrom public stakeholders. An important design criterion was to ensure that the scenarios, inaggregate, were not biased towards certain resource outcomes. As indicated at the bottom of Table6.1, the number of scenarios with low and high values for an input variable is the same. Anotherdesign criterion was to construct them so as to enable straightforward comparisons withrespect to changes in variables, particularly load growth.Table 6.2 summarizes the values and data sources for the input variables with low, medium, andhigh values. Additional details for each input variable follow.120
<strong>PacifiCorp</strong> – <strong>2007</strong> IRPChapter 6 – Modeling and Risk Analysis ApproachTable 6.2 – Scenario Input Variable Values and SourcesInputVariable Low Value Medium Value High ValueCO 2 Cost NoneAdderCoalCommodityPrices for New<strong>Resource</strong>sNatural GasPricesWholesaleElectricityPricesRetail LoadGrowthRenewablePortfolioStandardsClass 1 andClass 3 DSMAchievablePotential12% lower than the Pacifi-Corp Fuels Marketing &Supply Group price forecastby 202632% lower than the Pacifi-Corp official forward prices(dated August 3, 2006), onan average annual basis for<strong>2007</strong> through 201614% lower than the Pacifi-Corp official forwardprices, dated August 31,2006, on an average annualbasis for <strong>2007</strong> through2016; low values reflect a$0/ton CO 2 adder and thePIRA low Gas price forecastcaseAverage annual systemwideload growth of 0.6%for <strong>2007</strong> through 20263% of system-wide retailload by 2020Starting in 2009:● 69 MW of Class 1 programs● 40 MW of Class 3 programs$8/ton in 2008 dollars,beginning in 2010 withcosts phased in at 50%,escalating to 75% in 2011and 100% in 2012<strong>PacifiCorp</strong> Fuels Marketing& Supply Dept. price forecast<strong>PacifiCorp</strong> official forwardprices, dated August 31,2006; Incorporates PIRAEnergy’s August 3, 2006probabilistic-weightedlong-term gas forecast<strong>PacifiCorp</strong> official forwardprices, dated August 31,2006Average annual systemwideload growth of 2.0%for <strong>2007</strong> through 2026(<strong>PacifiCorp</strong> long term loadforecast, <strong>May</strong> 1, 2006)6% of system-wide retailload by 2020 (AssumesCalifornia, Washington,and Oregon RPS targets inplace)Starting in 2009:● 153 MW of Class 1programs● 106 MW of Class 3programs$37.9/ton in 2008 dollars($25/ton in 1990 dollars),beginning in 2010 withcosts phased in at 50%,escalating to 75% in 2011and 100% in 201220% higher than the<strong>PacifiCorp</strong> Fuels Marketing& Supply Group priceforecasts by 202686% higher than the<strong>PacifiCorp</strong> official forwardprices (dated August 3,2006), on an average annualbasis for <strong>2007</strong> through 201625% higher than the<strong>PacifiCorp</strong> official forwardprices, dated August 31,2006, on an average annualbasis for <strong>2007</strong> through2016; high values reflect a$37.7/ton CO 2 adder andthe PIRA high gas priceforecast caseAverage annual systemwideload growth of 3.6%for <strong>2007</strong> through 202615% of system-wide retailload by 2020 (AssumesRPS targets in place in allstates)Starting in 2009:● 219 MW of Class 1programs● 166 MW of Class 3programsCarbon Dioxide Regulation CostFor the CO 2 regulation cost, <strong>PacifiCorp</strong> sought public comments and recommendations on a suitablecost adder for its high scenario value. At the IRP public meeting held on June 7, 2006,<strong>PacifiCorp</strong> proposed $25/ton and $40/ton adders (in 1990 dollars). Meeting participants acceptedthe $25/ton level ($38/ton in 2008 dollars) as appropriate for reflecting the threshold at which asignificant shift in resource selection would occur based on regulatory costs.121
<strong>PacifiCorp</strong> – <strong>2007</strong> IRPChapter 6 – Modeling and Risk Analysis ApproachCommodity Coal CostPercentages for the low and high coal commodity cost values are based on the U.S. Energy InformationAdministration’s low and high delivered coal price sensitivity forecast cases reportedin the 2006 Annual Energy Outlook. 38 <strong>PacifiCorp</strong> assumed one-half of the difference betweenthe sensitivity and reference cases to account for the fact that transportation costs, a main componentof the cost forecast, are a relatively smaller portion of the delivered fuel cost in the RockyMountain region than for the U.S. as a whole.Natural Gas and Electricity PricesDue to the strong correlation between natural gas and wholesale electricity prices, these variableswere linked together as low, medium, or high values for a scenario. The low and high gas priceforecasts were based on PIRA Energy’s Henry Hub low and high prices cases, and come fromPIRA Energy’s long-term gas forecast update, dated June 15, 2006. Figure 6.2 shows the systemaverage annual low, medium, and high natural gas prices. Figure 6.3 shows the system annualaverage low, medium, and high electricity prices by Heavy Load Hour and Light Load Hour periods.39Figure 6.2 – System Average Annual Natural Gas Prices: Low, Medium, and High ScenarioValues20.0018.0016.0014.0012.00$/MMBtu10.008.006.004.002.000.00<strong>2007</strong> 2008 2009 2010 2011 2012 2013 2014 2015 2016 2017 2018 2019 2020 2021 2022 2023 2024 2025 2026System-Medium System-High System-Low38 U.S. Energy Information Administration, Annual Energy Outlook 2006 with Projections to 20<strong>30</strong>, DOE/EIA-0383(2006), December 2005.39 Heavy Load Hours constitute the period from 6 a.m. to 10 p.m., Monday through Saturday. Light Load Hours are10 p.m. to 6 a.m., Monday through Saturday, and all of Sunday and holidays.122
<strong>PacifiCorp</strong> – <strong>2007</strong> IRPChapter 6 – Modeling and Risk Analysis ApproachFigure 6.3 – System Average Annual Electricity Prices for Heavy and Light Load HourNatural Gas Prices: Low, Medium, and High Scenario Values$180$160$140$120$/MWh$100$80$60$40$20$0<strong>2007</strong> 2008 2009 2010 2011 2012 2013 2014 2015 2016 2017 2018 2019 2020 2021 2022 2023 2024 2025 2026HLH-High LLH-High HLH-Medium LLH-Medium HLH-Low LLH-LowRetail Load GrowthThe low and high load growth forecasts were determined by using the 5th and 95th percentileaverage load values from 100 stochastic iterations of the PaR model for 2026. Annual growthfactors were applied to the medium load forecast. For the low forecast, the growth factor is theratio of the average loads for the 5th percentile stochastic values to the load for the mediumvalue in 2026. For the high forecast, the growth factor is the ratio of the average loads for the95th percentile stochastic values to the load for the medium load value in 2026.Renewable Portfolio StandardsFor modeling the impact of renewable portfolio standards across the company’s six-state serviceterritory, <strong>PacifiCorp</strong> determined a system-wide annual generation requirement based on an assessmentof state RPS requirements in California and Washington, and the contribution of eachstate to system retail sales. The system renewables generation requirement is translated into anincremental requirement by deducting renewables generation expected for <strong>2007</strong>.Class 1 and Class 3 DSM PotentialThe development of low, medium, and high potentials for Class 1 and Class 3 demand-side managementprograms is described in detail in Chapter 5 and Appendix B. The Class 1 DSM programsincluded in the alternative future scenarios consist of dispatchable load control, scheduledirrigation, and thermal energy storage. The Class 3 programs consist of curtailable rates, criticalpeak pricing, and demand buyback. While the alternative future scenario studies included bothClass 1 and Class 3 programs as resource options, only Class 1 resources were considered forrisk analysis portfolio development. This decision was based on the need to conduct further re-123
<strong>PacifiCorp</strong> – <strong>2007</strong> IRPChapter 6 – Modeling and Risk Analysis Approachsearch on the reliability of Class 3 DSM resources to address peak load demand issues, and toimprove the modeling representation of the programs based on the DSM potentials study.Sensitivity Analysis Scenarios for the Capacity Expansion ModuleThe Capacity Expansion Module sensitivity analysis scenarios—designated with the acronymSAS and totaling 16 in number—are intended to supplement the alternative future analysis. 40 Thefocus of these scenarios is to determine optimal portfolios resulting from changes to secondaryvariables and other resource selection factors, with the results to be compared to those for a referencescenario. These sensitivity scenarios are defined with the primary variable values specifiedfor the “Medium Load Growth” scenario (CAF11) except where noted below. The CEMsensitivity scenarios, which are listed in Table 6.3, test the following conditions:• Alternative capacity <strong>Plan</strong>ning Reserve Margin levels – low (12%) and high (18%) values.• Deferred carbon dioxide adder implementation – CO 2 costs start accruing in 2016 as opposedto 2012, which is the assumed year of a fully phased-in CO 2 adder.• The impact of a regional transmission project – The regional transmission option consists ofa new 1,500-megawatt line from Wyoming to the SP15 transmission zone in southern California,and a new 1,500-megawatt line from Utah to the NP15 transmission zone in northernCalifornia. (The CEM was not allowed to choose this resource; rather, it was fixed in order todetermine the economic benefits assuming that it is built and <strong>PacifiCorp</strong> acquires an ownershipshare or transmission rights.)• Determination of the carbon dioxide adder threshold value that affects resource selection;specifically, run the CEM with incrementally higher CO 2 adders to determine at what pointmajor changes in resource selection are made.• Low and high wind project capital costs (see Table 6.4)• Low and high coal commodity prices• Low and high IGCC plant capital costs (see Table 6.4)• <strong>Integrated</strong> Gasification Combined Cycle technology configurations – constrain the CapacityExpansion Module to select an IGCC plant if not chosen as a resource given expected valuesfor the primary variables (i.e., the “Medium Load Growth”, CAF11). The IGCC plant istested with three configurations: minimum carbon capture provisions, one gasifier, and carbonsequestration included. The scenarios are used to determine the incremental cost impactrelative to an unconstrained resource choice.• An alternative approach for determining the peak system obligation 41• Impact of renewable Production Tax Credit expiration combined with other regulatory developmentsfavorable for wind projects, namely CO 2 regulation and widely-adopted renewableportfolio standards. This scenario uses variable values defined for the “favorable windenvironment” alternative future scenario (CAF07).40 A sensitivity scenario for testing the impact of replacing Klamath Falls hydro units with alternative resources wasexcluded from the list, as it was determined that such analysis was not appropriate for the IRP setting given ongoinglitigation and settlement discussions.41 In its 2004 IRP Acknowledgement Order, the Oregon Public Utility Commission directed <strong>PacifiCorp</strong> to “evaluatealternatives for determining the expected annual peak demand for determining the planning margin—for example,planning to the average of the eight-hour super-peak period.” (Order No. 06-029, January 23, 2006.)124
<strong>PacifiCorp</strong> – <strong>2007</strong> IRPChapter 6 – Modeling and Risk Analysis ApproachTable 6.3 – Sensitivity ScenariosSAS# Name Basis1 <strong>Plan</strong> to 12% planning reserve marginAlternative Futures Scenario #11("Medium Load Growth")2 <strong>Plan</strong> to 18% planning reserve marginAlternative Futures Scenario #11("Medium Load Growth")3 CO 2 adder implementation in 2016Alternative Futures Scenario #11("Medium Load Growth")4 Regional transmission projectAlternative Futures Scenario #11("Medium Load Growth")5-105-15CO 2 adder impact on resource selection: test $15, $20, $25per ton adders (approximately $10, $15, and $20 in 1990Alternative Futures Scenario #11("Medium Load Growth")5-20 dollars)6 Low wind capital costAlternative Futures Scenario #11("Medium Load Growth")7 High wind capital costAlternative Futures Scenario #11("Medium Load Growth")8 Low coal priceAlternative Futures Scenario #11("Medium Load Growth")9 High coal priceAlternative Futures Scenario #11("Medium Load Growth")10 Low IGCC capital costAlternative Futures Scenario #11("Medium Load Growth")11 High IGCC capital costAlternative Futures Scenario #11121314Add a carbon-capture-ready IGCC to the portfolio (base case forSAS13 and SAS14)Replace the IGCC resource in the SAS12 portfolio with a singlegasifierversionReplace the IGCC resource in the SAS12 portfolio with one thatincludes carbon sequestration15 <strong>Plan</strong> to "average of super-peak" load16"Favorable Wind Environment" scenario assuming permanentexpiration of the renewables PTC beginning in 2008Table 6.4 – CEM Sensitivity Scenario Capital Cost Values("Medium Load Growth")Alternative Futures Scenario #11("Medium Load Growth")SAS #12SAS #12Alternative Futures Scenario #11("Medium Load Growth")Alternative Futures Scenario #07("Favorable Wind Environment")InputVariable Low Value Medium Value High ValueIGCCCapitalCostWindCapitalCost5% lower than the <strong>PacifiCorp</strong><strong>Resource</strong> Development andConstruction Dept. cost estimates10% lower than the <strong>PacifiCorp</strong><strong>Resource</strong> Development andConstruction Dept. cost estimatesBased on a configuration with minimumcarbon capture preparation andLevel II emission controls. <strong>PacifiCorp</strong><strong>Resource</strong> Development and ConstructionDept. cost estimatesBased on <strong>PacifiCorp</strong> <strong>Resource</strong> Developmentand Construction Dept. costestimates12.5% higher than the<strong>PacifiCorp</strong> <strong>Resource</strong> Developmentand ConstructionDept. cost estimates11% higher than the Pacifi-Corp <strong>Resource</strong> Developmentand Construction Dept. costestimates125
<strong>PacifiCorp</strong> – <strong>2007</strong> IRPChapter 6 – Modeling and Risk Analysis ApproachSensitivity Analysis Scenarios for the <strong>Plan</strong>ning and Risk ModuleA number of stochastic simulations were performed for sensitivity analysis purposes. Several ofthe scenarios were designed to address specific risk analysis requirements identified in the OregonPublic Utility Commission’s <strong>Integrated</strong> <strong>Resource</strong> <strong>Plan</strong>ning guidelines and 2004 IRP acknowledgementorder. The <strong>Plan</strong>ning and Risk Module sensitivity scenarios test the followingconditions:• <strong>Plan</strong> to a 12% planning reserve margin, and include a sufficient amount of Class 3 demandsidemanagement program capacity to eliminate Energy Not Served (ENS). 42 This studyaddresses an Oregon Public Utility Commission acknowledgement order requirement.• <strong>Plan</strong> to an 18% planning reserve margin – use the same portfolio resources selected by theCapacity Expansion Module for Sensitivity Analysis Scenario #2 ("<strong>Plan</strong> to 18% capacityreserve margin")• Using one of the risk analysis portfolios as the basis, replace a new base load resource withan equivalent amount of front office transactions to determine the incremental cost and riskimpacts.• Using one of the risk analysis portfolios as the basis, replace a base load pulverized coalresource with an IGCC plant that has minimum carbon capture provisions. Also include sufficientshorter-term resources to maintain the planning reserve margin until an IGCC plantcan be placed into service.• Using one of the risk analysis portfolios as the basis, replace a new resource with CombinedHeat & Power (CHP) and aggregated dispatchable customer-owned standby generators to determinethe incremental cost and risk impacts. 43 This sensitivity addresses an analysis requirementin the Oregon Public Utility Commission’s 2004 <strong>Integrated</strong> <strong>Resource</strong> <strong>Plan</strong> acknowledgementorder.Capacity Expansion Module Optimization RunsThe Capacity Expansion Module is executed for each alternative future and sensitivity scenario,generating an optimized investment plan and associated real levelized present value of revenuerequirements (PVRR) for <strong>2007</strong> through 2026. To avoid bunching of coal-fired resources at theend of the 10-year investment period when higher variable cost CCCT growth stations becomeavailable, a two-year investment extension period is added to enable the model to select all resourceoptions through 2018. 4442 Energy Not Served is a condition due to physical or market constraints where insufficient energy is available tomeet load obligations.43 Large industrial sector CHP was included as a resource option in the CEM scenarios. For this sensitivity scenario,proxy resources representing small-to-medium sized industrial CHP plants (5 and 25 MW) were included along witha resource representing aggregate standby generators. For standby generators, <strong>PacifiCorp</strong> used Portland GeneralElectric Company’s standby generator program as the basis for determining resource characteristics. Due to airquality issues in Utah, standby generators were only modeled as a west-side resource.44 Growth stations are included as a generic resource choice beginning in 2019 to address load growth, plant retirements,and contract expirations during the out-years of the study period. Optimizing with a single resource for partof the study period is a necessary compromise for maintaining acceptable model run-times.126
<strong>PacifiCorp</strong> – <strong>2007</strong> IRPChapter 6 – Modeling and Risk Analysis ApproachThe CEM operates by minimizing for each year the operating costs for existing resources subjectto system load balance, reliability and other constraints. Over the 20-year study period, it alsooptimizes resource additions subject to resource investment and capacity constraints (monthlypeak loads plus a planning reserve margin for the24-zone model topology).Modeling Front Office TransactionsTo accomplish these optimization objectives, themodel performs a time-of-day least-cost dispatchfor existing and potential planned generation,contract, demand-side management, and transmissionresources. The dispatch is based on arepresentative-week method. Time-of-day hourlyblocks are simulated according to a userspecifiedday-type pattern representing an entireweek. Each month is represented by one week,with results scaled to the number of days in themonth and then the number of months in theyear. The dispatch also determines optimal electricityflows between zones and includes spotmarket transactions for system balancing. Themodel minimizes the overall PVRR, consistingof the net present value of contract and spotmarket purchase costs, generation costs (fuel,fixed and variable operation and maintenance,unserved energy, and unmet capacity), and amortizedcapital costs for planned resources.For capital cost derivation, the CEM uses annualcapital recovery factors to address end-effectsissues associated with capital-intensive investmentsof different durations and in-service dates.<strong>PacifiCorp</strong> used the real-levelized capital costsproduced by the CEM for PVRR reporting by both the CEM and <strong>Plan</strong>ning and Risk module.RISK ANALYSIS PORTFOLIO DEVELOPMENTFront office transactions, described in Chapter5, are assumed to be transacted on a one-yearbasis, and are represented as available in eachyear of the study. For capacity optimizationmodeling, the CEM engages in market purchaseacquisition—both front office transactionsand spot market purchases—to the extentit is economic given other available resources.The model can select virtually any quantity ofFOT generation up to limits imposed for eachscenario, in any study year, independently ofchoices in other years. However, once a frontoffice transaction resource is selected, it istreated as a must-run resource for the durationof the transaction. In addition, front officetransactions are only available through 2018.After 2018, the purchases are set to zero, atwhich point the model can select “growth stations.”The transactions modeled in the <strong>Plan</strong>ning andRisk Module generally have the same characteristicsas those modeled in the CEM, exceptthat transaction prices reflect wholesale forwardelectric market prices that are “shocked”according to a stochastic modeling processprior to simulation execution.Risk analysis portfolios refer to portfolio solutions, obtained from one or more CEM runs, whichare subjected to stochastic production cost simulation using the <strong>Plan</strong>ning and Risk module. Todevelop the risk analysis portfolios, <strong>PacifiCorp</strong> relied on the CEM to build fixed resource investmentschedules for wind and distributed resources, and to optimize the selection of otherresource options according to specific resource strategies defined as constraints on the modelsolution. For example, a resource strategy may entail restricting the range of resource choices,placing constraints on when resources can be selected, or implementing upper limits on resourcequantities. The impact of evolving state regulatory policies was considered in developing resourceconstraints.127
<strong>PacifiCorp</strong> – <strong>2007</strong> IRPChapter 6 – Modeling and Risk Analysis ApproachDetermination of Fixed <strong>Resource</strong> Investment Schedules<strong>PacifiCorp</strong> used the CEM to determine fixed resource investment schedules for certain smallerscaleresource types—wind, demand-side management programs and CHP facilities—in order tolimit resource variability for subsequent CEM optimization studies and in the risk analysis portfoliosthemselves. (Restricting the number of resources is important for managing portfolioanalysis complexity and model run-times. 45 ) These investment schedules constitute set resourcequantities, locations, and in-service dates that are included in all risk analysis portfolios. In thecase of the proxy wind resources, <strong>PacifiCorp</strong> developed multiple fixed investment schedules forportfolio testing. For DSM and CHP a single investment schedule was developed and used in therisk analysis portfolios.The company determined most of the fixed resource investment schedules by assessing theCEM’s resource selection behavior across the range of alternative future scenarios describedabove. The next chapter describes the investment schedules derived from the alternative futurescenario analysis.Alternative <strong>Resource</strong> Strategies<strong>PacifiCorp</strong>’s resource strategies fall into two categories: (1) those intended to evaluate the impactsof incremental resource changes, and (2) those intended to evaluate a specific resource investmentpolicy. Strategies that fall into the first category typically involve specifying modelconstraints around a single resource, such as forcing selection for a certain year or removing italtogether as an option. The second category encompasses strategies that broadly tackle certainportfolio risks. Such risks include CO 2 regulatory costs, escalation and volatility of wholesaleelectricity and natural gas prices, and potential state restrictions and standards for resource acquisition(e.g., renewable portfolio standards). Examples of such resource strategies include eliminatingor deferring an entire resource type such as coal, gas, or market purchases.Optimization Runs for Risk Analysis Portfolio DevelopmentThe CEM is ready for execution once the fixed resource investment schedules and resourcestrategies have been defined and input into the model. All CEM runs are configured as “MixedInteger Programming” problems. This means that expansion choices can be represented as eitherbuild/not-build binary variables or continuous variables that enable the model to select fractionalresource amounts. The mixed integer solution better characterizes investments where large fixedcapital costs are involved.In certain cases, a single CEM run completely defines the portfolio that is to be simulated usingPaR. In other cases, a group of CEM runs are used to test multiple resource strategies or assumptions.For this later situation, <strong>PacifiCorp</strong> manually selects the resource investment schedule basedon observations across the set of CEM runs. This approach is typically used to determine themodel’s selection behavior for a specific resource when other resources are constrained in differ-45 A limitation of this modeling strategy is that variable amounts of DSM and CHP resources were not subjected torisk analysis using the PaR model. <strong>PacifiCorp</strong> will continue to refine its approach to modeling distributed resourcesin concert with the scheduled June <strong>2007</strong> receipt of DSM and CHP supply curve data from the multi-state DSM potentialsstudy.128
<strong>PacifiCorp</strong> – <strong>2007</strong> IRPChapter 6 – Modeling and Risk Analysis Approachent ways. A resource that is routinely selected or chosen for a certain year indicates a robust resourceunder the set of simulated resource strategies. The CEM is then executed a second timewith this fixed set of generation resources. The purpose of this additional run is to have the CEMoptimize the selection of remaining available resource options, thereby ensuring that the finalportfolio meets the model’s planning reserve margin constraints. This two-step process is summarizedin Figure 6.4.Figure 6.4 – Two-Stage Risk Analysis Portfolio Development ProcessPhase 1:<strong>Resource</strong>Screening<strong>Resource</strong> Assumptionsand StrategiesCEM Optimization RunsCEM Investment <strong>Plan</strong> 1 CEM Investment <strong>Plan</strong> 2 CEM Investment <strong>Plan</strong> nPhase 2:Risk AnalysisPortfolioDevelopmentManually develop generationresource investmentscheduleRun the CEM with the generation investment scheduleto determine front office transactionsfor system balancingRisk analysis portfolioStochastic simulation withthe <strong>Plan</strong>ning and Risk ModuleSTOCHASTIC SIMULATION OF RISK ANALYSIS PORTFOLIOSStochastic Risk Analysis<strong>PacifiCorp</strong> next simulates each risk analysis portfolio, along with existing system resources, usingthe <strong>Plan</strong>ning and Risk model in stochastics mode. The PaR simulation produces a dispatchsolution that accounts for chronological commitment and dispatch constraints. The PaR simulationalso incorporates stochastic risk in its production cost estimates by using Monte Carlo randomsampling of five stochastic variables: loads, commodity natural gas prices, wholesale powerprices, hydro energy availability, and thermal unit availability. 4646 Although wind resource generation was not varied in the same way as the other stochastic variables, the hour-tohourgeneration did vary throughout the year, but the pattern was repeated identically for all study years (<strong>2007</strong>-2026) and iterations (1-100).129
<strong>PacifiCorp</strong> – <strong>2007</strong> IRPChapter 6 – Modeling and Risk Analysis ApproachA stochastic model in PaR guides the random sampling process. The stochastic model accountsfor both short-term and long-term variable volatility as well as correlation effects among thevariables. (Appendix E describes <strong>PacifiCorp</strong>’s stochastic modeling methodology.) The output ofthe stochastic model consists of stochastic parameters—multipliers that represent the stochastic“shocks” applied to the expected value forecasts for each variable.The PaR model is configured to conduct 100 Monte Carlo simulations for the 20-year study period,so that each of the 100 simulations has its own set of stochastic parameters and shockedforecast values. The end result of the Monte Carlo simulation is 100 production cost runs (iterations)reflecting a wide range of alternative futures. <strong>PacifiCorp</strong> derives expected values for theMonte Carlo simulation by averaging run results across all 100 iterations.The company also looks at subsets of the 100 iterations that signify particularly adverse costconditions, and derives associated cost measures as indicators of high-end portfolio risk, or “riskexposure.” The company uses scatter plots of portfolio cost versus risk exposure to help assesshow each portfolio performs with respect to balancing cost and risk, as well as showing the costrisktradeoff for specific resource strategies.Scenario Risk AnalysisIn addition to modeling portfolio stochastic risks (the base stochastic simulation step in Figure6.1), stochastic simulations were also conducted with various CO 2 emission cost adders to capturethe risks associated with potential CO 2 emission compliance regulations. Since the probabilityof realizing a specific CO 2 emissions cost cannot be determined with a reasonable degree ofaccuracy, potential CO 2 emission costs were treated as a scenario risk in this IRP. <strong>PacifiCorp</strong>defines a scenario risk as an externally-driven fundamental and persistent change to the expectedvalue of some parameter that is expected to significantly impact portfolio costs. This risk categoryis intended to embrace abrupt changes to risk factors that are not amenable to stochasticanalysis.The practice of combining stochastic simulation with CO 2 cost adder scenario analysis representsadvancement with respect to the modeling approach used for <strong>PacifiCorp</strong>’s 2004 IRP. Previously,the company simulated CO 2 scenario risks using several separate deterministic production costruns.Another scenario risk investigated in this IRP is potential widespread enactment of California’sgreenhouse gas emissions performance standard. (See Chapter 3, “California Greenhouse GasEmissions Policies”, for background information.) <strong>PacifiCorp</strong> used the CEM and PaR models todevelop a portfolio that (1) excludes all new resources—generation and purchase contracts—thatfail the emission performance threshold and (2) meets system-wide Renewable Portfolio Standardgeneration requirements stemming from assumed RPS enactment in all of <strong>PacifiCorp</strong>’swest-side jurisdictions. Stochastic simulation of this portfolio yielded cost, risk, and CO 2 emissionmeasures for comparison against other risk analysis portfolios. The results of this analysisare reported as the conclusion to Chapter 7.1<strong>30</strong>
<strong>PacifiCorp</strong> – <strong>2007</strong> IRPChapter 6 – Modeling and Risk Analysis ApproachPORTFOLIO PERFORMANCE MEASURESStochastic simulation results for the risk analysis portfolios were summarized and compared todetermine which portfolios perform best according to a set of performance measures. Thesemeasures, grouped by category, include the following:Cost• Stochastic mean cost (Present Value of Revenue Requirements, or PVRR)• Customer rate impact• Environmental (emissions) externality cost• Capital costRisk• Risk exposure• Production cost variabilityEmissions• Carbon dioxide emissionsReliability• Average annual Energy Not Served (ENS)• Loss of Load Probability (LOLP)The following sections describe in detail each of the performance measures listed above.Stochastic Mean CostThe stochastic mean cost for each risk analysis portfolio is the average of the portfolio’s net variableoperating costs for 100 iterations of the PaR model in stochastic mode, combined with thecapital cost additions of new resources determined by the CEM for that portfolio.The net variable cost from the PaR simulations, expressed as a net present value, includes systemcosts for fuel, variable plant O&M, unit start-up, market contracts, spot market purchases andsales. The variable costs included are not only for new resources but existing system operationsas well. The capital additions for new resources (both generation and transmission) are calculatedon an escalated “real-levelized” basis to appropriately handle investment end effects. Other componentsincluded in the stochastic mean PVRR include the value of renewable energy credits(green tags), renewable production tax credits, emission allowance costs and credits, and the costassigned to Energy Not Served. 47 . Emission allowance costs or credits are determined outside ofthe CEM and PaR models and added to the PVRR as one of the final calculation steps.47 The cost of Energy Not Served is set to $400/MWh, which is the FERC wholesale electricity price cap now ineffect for the California Independent System Operator. Note that <strong>PacifiCorp</strong> added this cost to its stochastic PVRRcalculations subsequent to the distribution of early risk analysis portfolio results to public stakeholders in October2006.131
<strong>PacifiCorp</strong> – <strong>2007</strong> IRPChapter 6 – Modeling and Risk Analysis ApproachThe PVRR measure captures the total resource cost for each portfolio. Total resource cost includesall the costs to the utility and customer for the variable portion of total system operationsand the capital requirements for new supply and Class 1 demand-side resources as evaluated inthis IRP. In addition, the PVRR accounts for emissions adders used for costing environmentalexternalities.Customer Rate ImpactIn addition to PVRR measures, <strong>PacifiCorp</strong> calculates the per-megawatt-hour customer rate impactassociated with each of the risk analysis portfolios.The rate impact measure is the change in the customer dollar-per-megawatt-hour price for theperiod 2012 through 2026, expressed on a levelized net present value basis. This approach differsfrom the one used for the 2004 IRP in two respects. First, the rates represent stochastic meanvalues from the Monte Carlo simulations rather than deterministic values. Second, the rate is asingle summary change measure. In contrast, the 2004 IRP reported just the year-to-year impacts.The dollars in the rate numerator consist of the stochastic mean system operating cost (fuel cost,cap-and–trade environmental cost, and variable O&M costs of all resources), combined with thefixed O&M and capital costs of the new supply-side and transmission resources. 48 The rate denominatoris the retail load. The present value calculations use a 7.1% discount rate.It should be noted that this measure provides an indication of the comparative rate impacts acrossrisk analysis portfolios, but is not intended to accurately capture projected total system revenuerequirements. For example, planned upgrades for current stations such as pollution controlsadded under <strong>PacifiCorp</strong>’s Clean Air Initiative, as well as hydro relicensing costs, are not includedin the calculations. Likewise, the IRP impacts assume immediate ratemaking treatmentand make no distinction between current or proposed multi-jurisdictional allocation methodologies.Environmental Externality CostFor this IRP, <strong>PacifiCorp</strong> quantified environmental externalities by using externality cost addersfor air emissions impacts—an approach that is consistent with prior company IRPs. The quantificationof air emissions impacts through cost adders is generally recognized as the leastambiguous and least subjective approach to assessing externalities. A full range of other potentialimpacts, such as those on water supplies, traffic and land use patterns, and visual or aestheticqualities, critically depend on the specifics of any particular project. The DSM potentials study tobe completed in June <strong>2007</strong> addresses environmental externalities not currently included in thisIRP.48 New IRP resource capital costs are represented in 2006 dollars and grow with inflation, and start in the year theresource added. This method is used so resources having different lives can be evaluated on a comparable basis. Thecustomer rate impacts will be lower in the early years and higher in the later years when compared to customer rateimpacts computed under a rate-making formula.132
<strong>PacifiCorp</strong> – <strong>2007</strong> IRPChapter 6 – Modeling and Risk Analysis ApproachModeling the Impact of CO 2 ExternalityCosts on Forward Electricity Prices<strong>PacifiCorp</strong> currently uses an inflation-adjustedCO 2 allowance price of $8/ton (2008$) in itscalculation of official forward electricity pricecurves. These official price curves serve as thewholesale electricity price inputs to both theCEM and PaR models. For alternative CO 2cost adders, new price curves are estimatedusing the Company’s market price forecastingmodel, MIDAS.The forward price curves need to account forthe effect of a CO 2 allowance market on forecastednatural gas, SO 2 allowance, and NO Xallowance prices. <strong>PacifiCorp</strong> contracted withICF Consulting to estimate these interactioneffects for use in developing the forward electricityprices needed for the CO 2 cost adderscenarios.ICF used their national power market simulationtool, IPM®, to develop natural gas, SO 2allowance, and NO X allowance prices takinginto account the CO 2 allowance prices providedby <strong>PacifiCorp</strong>. The IPM® simulationsused ICF’s “expected case” model run as thestarting point for forecast development.The externality cost adder is treated as a variable cost in both the CEM and PaR models, andtherefore is accounted for in each model’s dispatch solution. Cost adders are included for CO 2 ,SO 2 , NO X , and mercury (Hg) emissions. See Chapter A of the Technical Appendix for informationon pollutant allowance prices used in theIRP models.Allowance trading markets for NO X and SO 2currently exist, while a market for mercury isslated to start in 2010. Carbon emissions arecurrently not regulated except in California. Tosimulate the impacts of allowance trading, allowancecosts and credits are estimated outsideof the CEM and PaR models using a spreadsheetmodel. The allowance trading calculationsuse baseline annual emissions caps along withthe PaR model’s annual emission quantities fora portfolio simulation. (For a stochastic simulation,the calculations use the average emissionsacross the 100 iterations.) Annual emissionsabove a cap are multiplied by the per-ton annualallowance price (or in the case of mercury, aper-pound price), while emissions below the capare assigned a cost credit equal to the differencebetween the cap and the actual emissions multipliedby the allowance price. Note that as a simplifyingassumption, all allowances are traded inthe year accrued. The resulting net presentvalue of the 20-year stream of annual allowancebalances is included in the PVRR. 49<strong>PacifiCorp</strong> modeled future carbon regulationscenarios assuming that CO 2 emissions arecapped to 2000 levels, and that a CO 2 allowance trading market begins in 2010. In recognition ofthe timing uncertainty, 2010 CO 2 costs are probability-weighted by a factor of 0.50. Likewise,2011 costs are weighted by a factor of 0.75. By 2012, the full inflation-adjusted CO 2 allowancecost is imposed, growing at inflation thereafter.The CO 2 adder scenario simulations were performed with five adder levels: $0, $8, $15, $38, and$61 per ton (in 2008 dollars). For the $61/ton cost adder, the cap-and-trade program is assumedto start in 2010, but is not fully phased in until 2016.As a key performance measure, <strong>PacifiCorp</strong> reports the emissions externality cost as the increasein stochastic mean PVRR relative to the $0 adder case at each successively higher CO 2 adderlevel. For the set of risk analysis portfolio finalists, the externality cost is calculated as a tax49 To avoid double counting, the emission adder cost is backed out of the PaR model’s total production cost.133
<strong>PacifiCorp</strong> – <strong>2007</strong> IRPChapter 6 – Modeling and Risk Analysis Approach(emission quantity multiplied by the emissions cost adders) as well as a net allowance cost balanceunder a cap-and-trade regime for all pollutants.Risk ExposureRisk exposure is the stochastic upper-tail mean PVRR minus the stochastic mean PVRR. Theupper-tail mean PVRR is a measure of high-end stochastic risk, and is calculated as the averageof the five stochastic simulation iterations with the highest net variable cost. Risk exposure issomewhat analogous to Value at Risk (VaR) measures. The fifth and ninety-fifth percentilePVRRs are also reported. These PVRR values correspond to the iteration out of the 100 thatrepresents the fifth and ninety-fifth percentiles, respectively. These measures represent snapshotindicators of low-risk and high-risk stochastic outcomes.Capital CostThe total capital cost measure is the sum of the capital costs for generation resources and transmission,expressed as a net present value.Production Cost VariabilityTo capture production cost volatility risk, <strong>PacifiCorp</strong> uses the standard deviation of the stochasticproduction cost for the 100 Monte Carlo simulation iterations. The production cost is expressedas a net present value for the annual costs for <strong>2007</strong> through 2026.Carbon Dioxide EmissionsCarbon dioxide emissions are reported for two time periods: <strong>2007</strong>–2016 and <strong>2007</strong>–2026. The 10-year view excludes the emissions impact of growth stations—generic combined cycle units thatserve primarily to meet load growth beyond the 10-year investment window.For risk analysis portfolios considered as finalists for preferred portfolio selection, CO 2 emissionsare reported for both generation sources (direct emissions) as well as combined with the neteffect of wholesale market activity. The emission contribution assigned to market purchases (indirectemissions, net of emission credits from wholesale sales). The indirect CO 2 emissions relatedto purchases are calculated by multiplying net purchased power generation by an averageemissions factor of 0.565 tons/MWh which is offset by emissions deemed to go with wholesalesales at the average system emission rate. This factor is based on actual 2005 purchases, and isapplied through the 20-year forecast. The total system emissions footprint (generation only) forsulfur dioxide, nitrogen oxides, mercury is also reported for the period <strong>2007</strong>–2026.Supply ReliabilityEnergy Not ServedEnergy Not Served is a condition where there is insufficient generation available to meet loadbecause of physical constraints or market conditions. Certain iterations of a PaR stochastic simulationwill have “Energy Not Served” or ENS. This occurs when an iteration has one or morestochastic variables with large random shocks that prevent the model from fully balancing thesystem for the simulated hour. Typically large load shocks and simultaneous unplanned plantoutages are implicated in ENS events. For example, a large load shock in a transmissionconstrainedtopology bubble would yield a relatively large amount of ENS. Running the PaR134
<strong>PacifiCorp</strong> – <strong>2007</strong> IRPChapter 6 – Modeling and Risk Analysis Approachmodel in stochastic mode without including the stochastic variability of load yields virtually noENS over the planning horizon. Similarly, deterministic PaR simulations do not experience ENSbecause there is no random behavior of model parameters; loads increase in a smooth fashionover time.The stochastic ENS results, averaged across all 100 iterations, are used to compare the reliabilityamong portfolios when stressed. Consequently, stochastic ENS results are indicative of relativedifferences in portfolio reliability given extreme modeled conditions with low probability of occurrence,and are not intended to represent indicators of expected system reliability under normalconditions. It is noteworthy that in actual practice <strong>PacifiCorp</strong> has not needed to shed retail load,other than the curtailment contract customers, due to a resource shortage.For reporting of the ENS statistics, <strong>PacifiCorp</strong> calculates an average annual value for <strong>2007</strong>through 2016 in gigawatt-hours, as well as the upper-tail ENS (average of the five iterations withthe highest ENS). Simulations using the $8/ton CO 2 cost adder are reported, as the adder leveldoes not have a material influence on ENS results.Loss of Load ProbabilityThe new IRP guidelines issued in January <strong>2007</strong> by OPUC (Order 07-002) state:“Loss of load probability, expected planning reserve margin, and expected andworst-case unserved energy should be determined by year for top-performing portfolios.”To meet the LOLP guideline, <strong>PacifiCorp</strong> developed a metric and applied it to the risk analysisportfolios simulated with the <strong>Plan</strong>ning and Risk model.Loss of Load Probability is a term used to describe the probability that the combinations ofonline and available energy resources cannot supply sufficient generation to serve the load peakduring a given interval of time.Mathematically, LOLP is a simple concept:LOLP = Pr(S < L)where S is a random variable representing the available power supply, and L isthe daily load peak where the peak load is regarded as known.Traditionally LOLP was calculated for each hour of the year, converted to a measure of statisticallyexpected outage times or number of outage events (depending on the model), and summedfor the year. The annual measure estimates the generating system's reliability. A high LOLP generallyindicates a resource shortage, which can be due to generator outages, insufficient installedcapacity, or both. Target values for annual system LOLP depend on the utilities' degree of riskaversion, but a level equivalent of one day per ten years is typical. Loss of load probability isconsidered a limited measure of reliability, and does not account for numerous risk factors, utilityagreements, and other considerations that govern the operation of the utility network.135
<strong>PacifiCorp</strong> – <strong>2007</strong> IRPChapter 6 – Modeling and Risk Analysis ApproachFor reporting LOLP, <strong>PacifiCorp</strong> calculates the probability of Energy Not Served events, wherethe magnitude of the ENS exceeds given threshold levels. <strong>PacifiCorp</strong> is strongly interconnectedwith the regional network; therefore, only events that occur at the time of the regional peak arethe ones likely to have significant consequences; of those events, small shortfalls are likely to beresolved with a quick (though expensive) purchase. In Chapter 7, the proportion of iterationswith ENS events in July exceeding selected threshold levels are reported for each risk analysisportfolio simulated with the PaR module. The LOLP is reported as a study average as well asyear-by-year results for an example threshold level of 25,000 Megawatt-hours. This thresholdmethodology follows the lead of the Pacific Northwest <strong>Resource</strong> Adequacy Forum, which reportsthe probability of a “significant event” occurring during the winter season.PREFERRED PORTFOLIO SELECTIONThe preferred portfolio is selected from among the risk analysis portfolios primarily on the basisof relative cost-effectiveness, customer rate impact, and the balance between cost and risk exposure.Also important is the robustness of the portfolios with respect to their cost and risk performanceunder successively higher CO 2 adder scenarios; the portfolios that consistently rank thehighest regardless of the assumed CO 2 adder are strong contenders for selection as the preferredportfolio. Supply reliability risk and CO 2 emissions are also important, but play a lesser role inselecting the preferred portfolio because differences among portfolios with respect to thesemeasures are relatively small.These primary selection criteria are in line with state IRP guidelines that dictate that the preferredportfolio be least-cost after accounting for uncertainty, risk, and the long-run public interest.CLASS 2 DEMAND-SIDE MANAGEMENT PROGRAM ANALYSISDecrement AnalysisFor the Class 2 demand-side management decrement analysis, the preferred portfolio was used tocalculate the reduced system operating costs (or decrement value) of various types of Class 2programs. <strong>PacifiCorp</strong> will use these decrements values when evaluating the cost-effectiveness ofcurrent programs and potential new DSM programs between IRP cycles.The process used for this IRP is to model Class 2 DSM program types as contracts that supplyenergy according to hourly load shapes provided by <strong>PacifiCorp</strong>’s DSM department. These contractsserve as surrogates for direct load reductions attributable to energy efficiency programs.The <strong>Plan</strong>ning and Risk Module is then run in stochastics mode with and without the Class 2DSM resources to establish the change in system cost (reduction in the stochastic mean PVRRfor 100 simulations) from lower market purchases or resource re-optimization due to the additionof the Class 2 DSM. This approach differs from that used in the 2004 IRP. For the 2004 IRP, theload decrements were modeled as reductions in the load forecasts, with system cost differencesdetermined by deterministic PaR runs. The new approach simplifies the data set-up process andaccounts for stochastic risk in the cost estimates.136
<strong>PacifiCorp</strong> – <strong>2007</strong> IRPChapter 6 – Modeling and Risk Analysis ApproachTo determine the Class 2 DSM decrements, 12 shaped planning decrements, each at 100 megawattsat peak, were modeled starting in 2010 throughout the 20-year IRP study period. The decrementsare shaped to each of the following loads for both the east and west control areas. Table6.5 below provides an overview of the planning decrement design, showing the load size (loadfactor) and end-use hourly load shape.Table 6.5 – <strong>Plan</strong>ning Decrement DesignDecrementSizeEast System LoadCenterWest System LoadCenterEnd-Use Hourly LoadShape100 MW 7% Load Factor 20% Load Factor Residential Cooling100 MW 60% Load Factor 60% Load Factor Residential Lighting100 MW 46% Load Factor n/a Residential Whole House100 MW 16% Load Factor 16% Load Factor Commercial Cooling100 MW 49% Load Factor 49% Load Factor Commercial Lighting100 MW n/a 28% Load Factor Residential Heating100 MW East load shape(approx. 65% LoadFactor)West load shape(approx. 67% LoadFactor)East/West System LoadThe company will evaluate additional DSM program opportunities by replacing the forwardmarket-priceavoided cost used in the traditional DSM cost effectiveness tests with the shapeddecrement values. For such evaluations, the decrement values will be pro-rated to match the loadshape of new DSM proposals. Once new programs are implemented, their contributions to loadreductions will be incorporated directly into the load forecast used for the next IRP.Public Utility Commission Guidelines for Conservation Program Analysis in the IRPDuring the <strong>2007</strong> integrated resource planning process and development of the company’s Class 2energy efficiency resource assessment, there were questions raised as to whether <strong>PacifiCorp</strong> hadsufficient information available, absent the completion of a system-wide demand-side resourceassessment study, to arrive at a fair representation of the energy efficiency resource potentialavailable over the planning period. While having additional data from such a study would likelyhave provided additional clarity around this assessment, the company had several other reliablesources of information from which to arrive at a forecast of achievable resource potential as representedwithin the <strong>2007</strong> IRP. These sources have been used for prior planning exercises andcontinue to be used to identify significant resource opportunities. Additionally, these sourceshave proven reliable in the past in helping the company achieve verifiable results.Class 2 energy efficiency resources comprise a significant portion of the overall demand-sidemanagement investments and resource targets within the <strong>2007</strong> IRP. There are approximately250 MWa of Class 2 energy efficiency resources accounted for within the <strong>2007</strong> preferred portfolio.These resources were identified through a composite of resource assessment exercises conductedover the last five years. These assessments, coupled with the performance of the company’sexisting demand-side resource portfolio and associated lessons-learned, aided <strong>PacifiCorp</strong>in the development of the <strong>2007</strong> Class 2 energy efficiency plan contributions. The studies andinformation sources relied upon included market-specific as well as measure-specific characteri-137
<strong>PacifiCorp</strong> – <strong>2007</strong> IRPChapter 6 – Modeling and Risk Analysis Approachzation studies/work, third-party program process and impact evaluations, regional assessmentssuch as the Northwest Power <strong>Plan</strong>ning Council’s 5 th Power <strong>Plan</strong>, the Energy Trust of Oregon’sforecast, demand-side management advisory groups, and others. These sources represent themost relevant information available from which to draw assumptions regarding resource potential.The company’s confidence in this information is reflected in their use for adjusting the <strong>2007</strong>plan’s load forecast, indicating they will be acquired within cost-effective parameters.To avoid foreclosing opportunities to exceed the 250 MWa target already established for the IRPuntil a new target can be defined using the results of the multi-state DSM potentials study, thecompany intends to use the Class 2 DSM decrement analysis described above to establish values,at various load shapes, of 200 MWa of incremental resource acquisitions (beyond the 250 MWain the <strong>2007</strong> IRP) that might present themselves between planning cycles. However, since theamounts and shapes, availability, timing and acquisition costs are less certain than the resourcesfrom existing programs and assessments, they were not placed within the company’s <strong>2007</strong> loadand resource balance. As these resources are identified and determined to be cost-effective basedon the decrement values, they will be incorporated into the next integrated resource plan update.Modeling of demand-side resources in the <strong>2007</strong> integrated resource planning process is robustand treats them as functionally equivalent to supply-side resources, even without the utilizationof specific supply curves. Forecasted loads are reduced by the known and certain demand-sidemanagement resources in much the same manner that a supply-side resource would offset theload.In regards to additional assessment work, <strong>PacifiCorp</strong> will complete a comprehensive systemwidedemand-side resource market assessment by late June, <strong>2007</strong>. At that time, the company willbegin incorporating the results of that assessment, in addition to the sources identified above andused during this IRP planning cycle, into the planning assumptions and forecasts going forward.Once the system-wide demand-side resource assessment information is available, both the incremental200 MWa amount as well as the Class 2 DSM modeling methodology will be revisitedto assure that the planning process places the appropriate dependence on demand-sideresources commensurate with their availability.In summary, while the potential study and supply curves will refine the company’s approach toassessing and modeling demand-side management resources, the current practices and approachesdo not arbitrarily limit the amount, the value or potential acquisition of cost-effectiveenergy efficiency resources within the current plan.138
<strong>PacifiCorp</strong> – <strong>2007</strong> IRPChapter 7 – Modeling and7. MODELING AND PORTFOLIO SELECTION RESULTSChapter Highlights <strong>PacifiCorp</strong> assessed 16 alternative future scenarios to determine resources and capacityquantities suitable for inclusion in risk analysis portfolios. Based on the Capacity ExpansionModule’s optimized investment plans, the company selected wind (a proxy for allrenewables), combined heat and power, supercritical pulverized coal (SCPC), combinedcycle combustion turbine (CCCT), single-cycle combustion turbine (SCCT), integratedgasification combined cycle (IGCC), load control programs, and short-term market purchases(front office transactions) in subsequent portfolio studies. The company initially studied 12 portfolios using its stochastic production cost simulationmodel. These portfolios tested a variety of resource strategies, distinguished by theplanning reserve margin and the quantity of wind, pulverized coal, front office transactions,and IGCC resources included. The stochastic modeling results for the 12 portfolios indicate that the best strategy forachieving a low-cost, risk-informed portfolio is to include supercritical pulverized coalalong with additional wind and natural gas resources to mitigate CO 2 cost risk. <strong>PacifiCorp</strong> evaluated a second set of five portfolios to account for (1) new and evolvingstate resource policies that place constraints on the company’s resource choices, and (2)new Wyoming load growth information. All of these portfolios included 600 megawattsof additional wind (incremental to the original 1,400-megawatt renewables commitment),100 megawatts of CHP, and 95 megawatts of new load control programs. The analysis of the original 12 portfolios informed the development of the second set ofportfolios; these portfolios focused on the timing of SCPC plants, the mix of gas-firedplants and market purchases to address east-side load growth, the timing and type of resourcesneeded to make up for the loss of the BPA peaking contract in 2011, and theplanning reserve margin level. Based on superior performance with respect to stochastic cost, customer rate impact, costvs. risk balance, and supply reliability, a portfolio with the following characteristics waschosen as the preferred portfolio:– A total of 2,000 megawatts of renewables by 2013– A west-side CCCT in 2011– High-capacity-factor baseload resources in the east in 2012 and 2014– East-side CCCTs in 2012 and 2016– Balance of system need fulfilled by front office transactions beginning in 2010139
<strong>PacifiCorp</strong> – <strong>2007</strong> IRPChapter 7 – Modeling andINTRODUCTIONThis chapter presents modeling results for the portfolio analysis, as well as chronicles the developmentof the portfolios, the associated decision process that guided their formulation, and theselection of a preferred portfolio.Discussion of the portfolio analysis results falls into the following six sections.• Alternative Future and Sensitivity Scenario Results – This section presents the CapacityExpansion Module’s optimized resource investment plans and PVRRs for the alternative futureand sensitivity scenarios. These results constitute the outcome of the resource screeningphase of the IRP modeling effort.• Risk Analysis Portfolio Development and Stochastic Simulation Results – This sectiondescribes the derivation and resource specifications for the risk analysis portfolios, and thenprovides a comparative assessment based on the performance measures described in Chapter6. Creation of fixed investment schedules for wind, demand-side management programs, andcombined heat and power resources, is covered first, followed by a description of the portfoliodesign goals and alternative resource strategies used to formulate them. The section alsopresents findings on a cost-versus-risk exposure tradeoff analysis of the resource strategies.(As discussed in Chapter 6, risk exposure is defined as the upper-tail mean PVRR minus theoverall stochastic mean PVRR.)• Selection of the Preferred Portfolio – This section provides a consolidated view of the portfolioevaluation results to indicate which portfolio is the most desirable after cost, risk, reliability,CO 2 emissions, and state resource policy evolution are considered.• Fuel Diversity <strong>Plan</strong>ning – This section describes how fuel source diversity is addressed inthe <strong>2007</strong> <strong>Integrated</strong> <strong>Resource</strong> <strong>Plan</strong>.• Forecasted Fossil Fuel Generator Heat Rate Trend – This section reports the systemaveragefossil fuel generator heat rate trend for the preferred portfolio. This information addressesa new Utah Commission IRP reporting requirement to support the PURPA FuelSources Standard.• Class 2 Demand-side Management Decrement Analysis – This section presents the decrementvalues for Class 2 program evaluations using the preferred portfolio to calculate thesystem benefit.ALTERNATIVE FUTURE AND SENSITIVITY SCENARIO RESULTSAlternative Future Scenario ResultsThis section presents the modeling results and findings for the CEM alternative future studies.As a refresher, Table 7.1 repeats the alternative future specifications outlined in Chapter 6.140
<strong>PacifiCorp</strong> – <strong>2007</strong> IRPChapter 7 – Modeling andTable 7.1 – Alternative Future ScenariosCAFCoal Cost:CO 2 Adder/CoalCommodityGas/Electric LoadRenewableSalesPercentageRenewablePTC DSM# NamePrice Price Growth due to RPS Availability Potential00 Business As Usual None/Medium Medium Medium Low Yes Medium01 Low Cost Coal/High Cost Gas None/Low High Medium Medium Yes Medium02 With Low Load Growth None/Low High Low Medium Yes Medium03 With High Load Growth None/Low High High Medium Yes Medium04 High Cost Coal/Low Cost Gas High/High Low Medium Medium Yes Medium05 With Low Load Growth High/High Low Low Medium Yes Medium06 With High Load Growth High/High Low High Medium Yes Medium07 Favorable Wind Environment High/Medium High Medium High Yes Medium08 Unfavorable Wind Environment None/Medium Low Medium Low No Medium09 High DSM Potential High/Medium High Medium Medium Yes High10 Low DSM Potential None/Medium Low Medium Medium Yes Low11 Medium Load Growth Medium/Medium Medium Medium Medium Yes Medium12 Low Load Growth Medium/Medium Medium Low Medium Yes Medium13 High Load Growth Medium/Medium Medium High Medium Yes Medium14 Low Cost Portfolio Bookend None/Low Low Low Medium Yes Medium15 High Cost Portfolio Bookend High/High High High Medium No MediumTable 7.2 reports the PVRR and total cumulative additions (<strong>2007</strong>–2018) by resource type for the16 alternative future studies. The wind capacity contribution and average annual front officetransactions acquired for <strong>2007</strong> through 2018 are also shown.Table 7.2 – Alternative Future Scenario PVRR and Cumulative Additions for <strong>2007</strong>-2018Study PVRRCAF00 $ 19,619 15% 47 103 150 125 125 500 2,440 500 134 3,715 966 1,111CAF01 $ 18,071 15% 48 103 151 25 25 2,002 2,440 1,100 217 5,718 669 769CAF02 $ 11,022 15% 47 31 78 500 2,440 600 125 3,618 406 467CAF03 $ <strong>30</strong>,159 15% 87 82 169 602 602 125 634 1,361 2,510 2,440 3,100 514 9,580 748 860CAF04 $ <strong>30</strong>,504 15% 47 31 78 1,698 1,698 125 1,823 2,200 354 4,101 961 1,105CAF05 $ 23,920 15% 47 52 99 125 125 2,100 317 2,324 796 916CAF06 $ 40,002 15% 87 82 169 1,498 2,<strong>30</strong>0 3,798 125 3,923 2,400 409 6,492 1,071 1,232CAF07 $ 33,339 15% 32 26 58 100 100 500 2,440 3,600 568 6,698 753 866CAF08 $ 18,858 15% 47 82 129 1,150 1,150 125 1,275 750 2,154 958 1,102CAF09 $ 33,213 15% 64 64 100 100 500 2,440 3,100 514 6,204 733 843CAF10 $ 19,002 15% 29 39 68 1,150 1,150 75 1,225 750 700 148 2,743 929 1,068CAF11 $ 24,606 15% 105 106 211 125 634 759 500 2,440 1,800 342 5,710 876 1,007CAF12 $ 17,689 15% 47 103 150 100 100 500 1,500 900 184 3,150 602 693CAF13 $ 35,024 15% 127 106 233 392 602 994 125 634 1,753 2,002 2,440 2,700 467 9,128 1,000 1,150CAF14 $ 13,689 15% 47 103 150 25 25 750 500 122 1,425 622 716CAF15 $ 49,234 15% 95 103 198 784 784 125 <strong>30</strong>2 1,211 2,510 2,440 3,100 514 9,459 913 1,049<strong>Plan</strong>ning Reserve MarginDSM - Class 1DSM - Class 3DSM-TotalGas-CCCT-1x1Gas-CCCT-2x1Gas-CCCTGas-CHPCAF Averages $ 26,12263 76 135 891 1,250 1,454 103 551 929 1,202 1,978 1,893 329 5,139 813 935Gas-FrameGas-TotalCoal - IGCCCoal - SCPCNameplate WindWind CapacityContributionTotal NameplateFOT - Avg <strong>2007</strong>-2018Plus PRMFOT - Avg <strong>2007</strong>-2018Figure 7.1 provides a composite view of cumulative additions by resource type over time, averagedfor all 16 alternative future investment plans. Annual front office transactions acquired arealso shown.141
<strong>PacifiCorp</strong> – <strong>2007</strong> IRPChapter 7 – Modeling andFigure 7.1 – Cumulative <strong>Resource</strong> Additions by Year for Alternative Future Studies4,000Average Additions for the 16 Alternative Future Studies3,5003,0002,500MW2,0001,500Line indicates the averageamount of front officetransactions acquired per year1,000500-<strong>2007</strong> 2008 2009 2010 2011 2012 2013 2014 2015 2016 2017 2018SCPC IGCC Gas-CCCT Wind (Capacity Contribution) Gas-SCCT CHP DSM Front Office TransactionsDemand-side Management Program Selection PatternsThe CEM chose, on average, 135 megawatts of DSM resources across the alternative future studies—63megawatts of Class 1 resources and 76 megawatts of Class 3 resources. The CEM selectedClass 1 programs under all scenarios except one: the high DSM potential scenario. Thisresult is covered under the DSM potential scenario discussion later in this section.The highest individual amount selected for a scenario was 233 megawatts; this was for CAF13,the high load growth study. In contrast, the lowest amount was 58 megawatts under CAF07, thefavorable wind environment scenario. It is apparent that conditions that support aggressive windinvestment for the model have a dampening effect on the amount of DSM selected.Table 7.3 shows the CEM’s DSM additions for scenarios that included (1) low and high loadgrowth assumptions, (2) low and high coal costs (based principally on the CO 2 adder level), and(3) low and high gas/electricity prices. The megawatt additions are reported as averages for thegroup of portfolios. 5050 A complicating factor for interpreting the model’s resource selection behavior is the impact of resource size. Themodel may find it advantageous to select a small resource to minimally meet the planning reserve margin constraintfor a particular year, rather than invest in a larger yet less costly resource.142
<strong>PacifiCorp</strong> – <strong>2007</strong> IRPChapter 7 – Modeling andTable 7.3 – DSM <strong>Resource</strong> Selection by Alternative Future TypeAlternative Future TypeNumber ofMegawatt AverageScenarios Class 1 DSM Class 3 DSM TotalLow Load Growth 4 47 72 119High Load Growth 4 89 84 178Low Coal Cost 6 81 84 165High Coal Cost 6 51 60 111Low Gas/Electricity Prices 6 51 65 116High Gas/Electricity Prices 6 52 68 120DSM Potential ScenariosThe two DSM potential scenarios, CAF09 and CAF10, are intended to determine how other resourcecosts affect the CEM’s choice of DSM resources at higher and lower levels of programparticipation. The High DSM potential scenario tests whether high fuel and market prices compensatefor the higher DSM resource cost that accompanies greater program participation. The“low DSM potential” scenario tests the opposite set of conditions. Note that as the market potentialincreases, the resource cost ($/kW/yr) for most of the DSM programs is higher as well. 51 Thehigher cost reflects a greater level of incentive and administrative expenditures needed to maintainprogram savings at an elevated level.As mentioned above, the CEM did not choose any Class 1 DSM programs under the high potentialscenario, even with a high CO 2 adder and high gas and electricity prices in place. (On theother hand, the CEM selected 3,100 megawatts of wind.) The only DSM resources selected werethe east and west demand buyback programs.For the low potential scenario, CAF10, both Class 1 and Class 2 programs are selected. However,the combined amounts are only 4 megawatts greater than the DSM total under the highpotential scenario.Load Growth ScenariosThe alternative future scenarios CAF10, CAF11, and CAF12 test the CEM’s resource preferencesunder a wide load growth range, holding other scenario variables constant. Table 7.4 profilesthe resource additions for each of these load growth scenarios.Table 7.4 – <strong>Resource</strong> Additions for Load Growth ScenariosLoad Growth Scenario DSM Coal-SCPC Coal-IGCC GasWindNameplateAssumptionCumulative Build Amounts (MW): <strong>2007</strong>-2018Low CAF12 150 1,500 500 100 900Medium CAF11 211 2,440 500 759 1,800High CAF13 233 2,440 2,002 1,753 2,70051 Critical Peak Pricing is the only program type for which unit resource costs decrease as the market potential increases.143
<strong>PacifiCorp</strong> – <strong>2007</strong> IRPChapter 7 – Modeling andThe most interesting model behavior relates to the type of gas resource selected under each loadgrowth scenario. For the low load growth scenario (CAF12), the model selects no central-stationgas resources; instead, it relies mostly on coal builds. Under the medium load growth scenario(CAF11), the model then turns to SCCT frames and additional pulverized coal to address thehigher loads, but no CCCT capacity was added to the investment plan at this point. (Wind nameplatecapacity also doubled from 900 to 1,800 megawatts.) Under the high load growth scenario(CAF13), the next incremental resources selected were IGCC and CCCT, with the model havingalready selected all SCPC resources available to it under medium load growth conditions.Tables 7.5, 7.6 and 7.7 show the CEM’s resource additions for all scenarios that include the low,medium, and high load growth assumptions, respectively. The model tends to add pulverizedcoal first to meet incremental load growth, and then add significantly more gas and wind resourcesunder the higher load growth scenarios. For all scenarios that include high load growth,the model chooses every SCPC resource available to it.Table 7.5 – <strong>Resource</strong> Additions for Scenarios with Low Load GrowthDSM Coal-SCPC Coal-IGCC GasWindNameplateScenario Cumulative Build Amounts (MW): <strong>2007</strong>-2018CAF02 78 2,440 500 - 600CAF05 99 - - 125 2,100CAF12 150 1,500 500 100 900CAF14 150 750 - 25 500Average 119 1,173 500 63 600Table 7.6 – <strong>Resource</strong> Additions for Scenarios with Medium Load GrowthDSM Coal-SCPC Coal-IGCC GasWindNameplateScenario Cumulative Build Amounts (MW): <strong>2007</strong>-2018CAF00 150 2,440 500 125 500CAF01 151 2,440 2,002 25 1,100CAF04 78 - - 1,823 2,200CAF07 58 2,440 500 100 3,600CAF08 129 750 - 1,275 -CAF09 64 2,440 500 100 3,100CAF10 68 750 - 1,225 700CAF11 211 2,440 500 759 1,800Average 114 1,957 800 679 1,625Table 7.7 – <strong>Resource</strong> Additions for Scenarios with High Load GrowthDSM Coal-SCPC Coal-IGCC GasWindNameplateScenario Cumulative Build Amounts (MW): <strong>2007</strong>-2018CAF03 169 2,440 2,510 1,361 3,100CAF06 169 - 3,923 2,400CAF13 233 2,440 2,002 1,753 2,700144
<strong>PacifiCorp</strong> – <strong>2007</strong> IRPChapter 7 – Modeling andDSM Coal-SCPC Coal-IGCC GasWindNameplateScenario Cumulative Build Amounts (MW): <strong>2007</strong>-2018CAF15 198 2,440 2,510 1,211 3,100Average 136 2,440 1,207 1,0<strong>30</strong> 1,925Gas/Electricity Price ScenariosTables 7.8 and 7.9 show the CEM resource additions for the six scenarios that include the lowand high gas/electricity price assumptions, respectively.With low prices, the model chose coal for only three of the six scenarios. Those three scenarios(CAF08, CAF10, CAF14), assumed no CO 2 adder, and only one coal plant was selected. Themodel selected wind for nearly all low-price scenarios, the exception being the “unfavorablewind environment” scenario, CAF08. Scenarios that also included the low coal cost assumption(CAF10, CAF14) had a relatively small amount of wind investment at 400 megawatts. For thescenario with a high coal cost and load growth (CAF06), the fossil fuel investment plant consistedof only CCCT resources at 3,798 megawatts.Table 7.8 – <strong>Resource</strong> Additions for Scenarios with Low Gas/Electricity PricesDSM Coal-SCPC Coal-IGCC GasWindNameplateScenario Cumulative Build Amounts (MW): <strong>2007</strong>-2018CAF04 78 - - 1,823 2,200CAF05 99 - - 125 2,100CAF06 169 - - 3,923 2,400CAF08 129 750 - 1,275 -CAF10 68 750 - 1,225 700CAF14 150 750 - 25 500Average 116 375 - 1,399 1,317With high gas and electricity prices, the model invested heavily in both supercritical pulverizedcoal and wind, except for the scenario with low load growth. For all scenarios, every SCPC optionwas chosen (2,440 megawatts). Gas resources (CCCT and SCCT frame) were selected onlyfor the two scenarios that also had high load growth (CAF03, CAF15). The model selected westIGCC resources in all scenarios, and added all the IGCC units available to it under the highprice/high load growth scenario (CAF03).Table 7.9 – <strong>Resource</strong> Additions for Scenarios with High Gas/Electricity PricesDSM Coal-SCPC Coal-IGCC GasWindNameplateScenario Cumulative Build Amounts (MW): <strong>2007</strong>-2018CAF01 151 2,440 2,002 25 1,100CAF02 78 2,440 500 - 600CAF03 169 2,440 2,510 1,361 3,100CAF07 58 2,440 500 100 3,600CAF09 64 2,440 500 100 3,100CAF15 198 2,440 2,510 1,211 3,100145
<strong>PacifiCorp</strong> – <strong>2007</strong> IRPChapter 7 – Modeling andDSM Coal-SCPC Coal-IGCC GasWindNameplateScenario Cumulative Build Amounts (MW): <strong>2007</strong>-2018Average 120 2,440 1,420 466 2,433Carbon Dioxide Adder/Coal Cost ScenariosTables 7.10 and 7.11 show the CEM’s resource additions for scenarios that have the low andhigh coal cost assumptions, respectively.The CEM added 1,716 megawatts of supercritical pulverized coal capacity, on average, for thescenarios with low coal cost assumptions. As expected, the CEM built the most coal capacitywhen high gas/electricity prices and high load growth are included as assumptions (CAF1 andCAF3).Table 7.10 – <strong>Resource</strong> Additions for Scenarios with Low CO 2 Adder/Coal CostsDSM Coal-SCPC Coal-IGCC GasWindNameplateScenario Cumulative Build Amounts (MW): <strong>2007</strong>-2018CAF00 150 2,440 500 125 500CAF01 151 2,440 2,002 25 1,100CAF02 78 2,440 500 - 600CAF03 169 2,440 2,510 1,361 3,100CAF08 129 750 - 1,275 0CAF10 68 750 - 1,225 700CAF14 150 750 - 25 500Average 124 1,716 787 577 929With high coal costs (Table 7.11), the model did not add any coal resources unless the scenariowas accompanied by high gas/electricity prices. Base load gas was added in only three of the sixportfolios. Substantial wind capacity was added in all scenarios, with an average of 2,750 megawatts(a 446-megawatt capacity contribution).Table 7.11 – <strong>Resource</strong> Additions for Scenarios with High CO 2 Adder/Coal CostsDSM Coal-SCPC Coal-IGCC GasWindNameplateScenario Cumulative Build Amounts (MW): <strong>2007</strong>-2018CAF04 78 - - 1,823 2,200CAF05 99 - - 125 2,100CAF06 169 - - 3,923 2,400CAF07 58 2,440 500 100 3,600CAF09 64 2,440 500 100 3,100CAF15 198 2,440 2,510 1,211 3,100Average 111 1,220 585 1,214 2,750146
<strong>PacifiCorp</strong> – <strong>2007</strong> IRPChapter 7 – Modeling andSensitivity Analysis ResultsThis section presents the modeling results for the CEM sensitivity analysis studies. As a refresher,Table 7.12 repeats the sensitivity scenario specifications outlined in Chapter 6.Table 7.12 – Sensitivity Analysis ScenariosSAS# Name Basis01 <strong>Plan</strong> to 12% capacity reserve marginAlternative Futures Scenario #11("Medium Load Growth")02 <strong>Plan</strong> to 18% capacity reserve marginAlternative Futures Scenario #11("Medium Load Growth")03 CO 2 adder implementation in 2016Alternative Futures Scenario #11("Medium Load Growth")04 Regional transmission projectAlternative Futures Scenario #11("Medium Load Growth")5-105-155-20CO 2 adder impact on resource selection: test $15, $20, $25 per tonadders (approximately $10, $15, and $20 in 1990 dollars)06 Low wind capital cost07 High wind capital cost08 Low coal price09 High coal price10 Low IGCC capital cost11 High IGCC capital cost121314Add a carbon-capture-ready IGCC to the portfolio (base case forSAS13 and SAS14)Replace the IGCC resource in the SAS12 portfolio with a singlegasifierversionReplace the IGCC resource in the SAS12 portfolio with one thatincludes carbon sequestration15 <strong>Plan</strong> to "average of super-peak" load16"Favorable Wind Environment" scenario assuming permanent expirationof the renewables PTC beginning in 2008Alternative Futures Scenario #11("Medium Load Growth")Alternative Futures Scenario #11("Medium Load Growth")Alternative Futures Scenario #11("Medium Load Growth")Alternative Futures Scenario #11("Medium Load Growth")Alternative Futures Scenario #11("Medium Load Growth")Alternative Futures Scenario #11("Medium Load Growth")Alternative Futures Scenario #11("Medium Load Growth")Alternative Futures Scenario #11("Medium Load Growth")SAS #12SAS #12Alternative Futures Scenario #11("Medium Load Growth")Alternative Futures Scenario #07("Favorable Wind Environment")Table 7.13 reports the PVRR and total cumulative additions (<strong>2007</strong>–2018) by resource type forthe 16 sensitivity studies. The wind capacity contribution and average annual front office transactionsacquired for <strong>2007</strong> through 2018 are also shown. The study results are summarized below.147
<strong>PacifiCorp</strong> – <strong>2007</strong> IRPChapter 7 – Modeling andTable 7.13 – Sensitivity Analysis Scenario PVRR and Cumulative Additions, <strong>2007</strong>-2018Study PVRRSAS01 $ 24,400 12% 55 106 161 125 125 500 2,440 1,100 223 4,326 865 969SAS02 $ 24,983 18% 55 106 161 100 634 734 500 2,440 1,700 326 5,535 936 1,104SAS03 $ 22,673 15% 47 106 153 125 <strong>30</strong>2 427 500 2,440 1,500 291 5,020 942 1,083SAS04 $ 24,182 15% 113 106 219 125 125 997 2,440 2,400 409 6,181 896 1,031SAS05-10 $ 28,551 15% 103 106 209 602 602 125 634 1,361 500 1,840 2,500 406 6,410 872 1,003SAS05-15 $ 32,390 15% 127 106 233 602 602 125 634 1,361 500 1,090 3,100 514 6,284 935 1,075SAS05-20 $ 36,073 15% 143 106 249 1,150 1,150 125 720 1,995 750 3,100 514 6,094 906 1,042SAS06 $ 24,282 15% 55 106 161 125 634 759 500 2,440 2,600 422 6,460 806 927SAS07 $ 24,836 15% 47 82 129 100 634 734 997 2,440 700 163 5,000 897 1,031SAS08 $ 24,401 15% 95 103 198 125 <strong>30</strong>2 427 500 2,440 1,<strong>30</strong>0 253 4,865 920 1,058SAS09 $ 24,980 15% 47 103 150 125 <strong>30</strong>2 427 500 2,440 1,500 <strong>30</strong>0 5,017 890 1,023SAS10 $ 24,559 15% 47 103 150 125 332 457 997 2,440 1,100 223 5,144 889 1,023SAS11 $ 24,660 15% 103 106 209 125 634 759 500 2,440 1,800 334 5,708 922 1,060SAS12 $ 24,976 15% 103 106 209 100 332 432 1,250 2,440 1,000 196 5,331 915 1,052SAS13 $ 24,980 15% 47 106 153 100 <strong>30</strong>2 402 1,250 2,440 800 165 5,045 828 953SAS14 $ 25,521 15% 95 106 201 100 332 432 1,250 2,440 1,000 196 5,323 848 975SAS15 $ 24,412 15% 105 106 211 125 332 457 500 2,440 1,700 323 5,<strong>30</strong>8 803 924SAS16 $ 35,049 15% 47 26 73 75 75 500 2,440 3,500 580 6,588 649 727<strong>Plan</strong>ning Reserve MarginDSM - Class 1DSM - Class 3DSM-TotalGas-CCCT-1x1Gas-CCCT-2x1Gas-CCCTGas-CHPGas-FrameGas-TotalCoal - IGCCCoal - SCPCNameplate WindWind CapacityContributionTotal NameplateFOT - Avg <strong>2007</strong>-2018Plus PRMFOT - Avg <strong>2007</strong>-2018Alternative planning reserve margins (SAS01 and SAS02)Allowing the CEM to optimize to alternative planning reserve margins, 12% and 18%, had thefollowing impacts:• The PVRR was lowest for the 15% PRM base case portfolio (CAF11); the cost differencebetween the 15% PRM portfolio and 18% PRM was $6.9 billion, while the difference betweenthe 12% PRM portfolio and the 15% PRM portfolio was $6.3 billion.• There was no difference in the amount of supercritical pulverized coal or IGCC capacityamong the portfolios• None of the portfolios included CCCT capacity; SCCT capacity was added for 15% and 18%PRM portfolios (both at 634 megawatts)• The 12% PRM portfolio had no base load gas resources, but included CHP• Relative to the 12% PRM portfolio, the 15% PRM portfolio had more wind (700 megawatts)and more front office transactions• Relative to the 15% PRM portfolio, the 18% PRM portfolio had more front office transactionsand slightly less wind and DSMCO 2 adder implementation in 2016, compared to 2012 for the base case portfolioMoving back the start of CO 2 regulation from 2012 to 2016 had the following impacts on thebase case portfolio:• The PVRR decreased by $1.9 billion• The resulting portfolio had less Class 1 DSM, less SCCT capacity, less wind, and more frontoffice transactionsInclusion of the regional transmission project 52• The project resulted in a $424 million decrease in PVRR relative to the base case portfolio52 The project consisted of new 1,500 MW capacity lines from Wyoming to the SP15 transmission zone in California,and from Utah to NP15.148
<strong>PacifiCorp</strong> – <strong>2007</strong> IRPChapter 7 – Modeling and• Changes to the resource mix included elimination of all SCCT capacity, the addition of anIGCC unit, more wind, and a small increase in front office transactions<strong>Resource</strong> mix impact of increasing the CO 2 adderIncreasing the CO 2 adder in a step-wise fashion for the base case portfolios had the followingimpacts:• From $8 to $15: The CEM removed the Utah SCPC resource (600 megawatts), and added aCCCT and 700 megawatts of additional wind; PVRR increased by $3.9 billion• From $15 to $20: The CEM removed a Wyoming SCPC (750 megawatts), and added 600megawatts of additional wind, 24 megawatts of Class 3 DSM, and additional front officetransactions (63 average annual megawatts); PVRR increased by another $3.8 billion• From $20 to $25: The CEM removed the small Utah SCPC and the west IGCC (500 megawatts),and added another east CCCT as well as an intercooled aero SCCT; in addition, themodel added 16 megawatts of Class 1 DSM, but decreased front office transactions by averageannual 29 megawatts; PVRR increased by another $3.7 billionLow and high wind capital costLowering the wind capital cost by 10% had the following effects relative to the base case portfolio:• The CEM added 800 megawatts of wind• The PVRR decreased by $800 million• Class 1 DSM is reduced by 50 megawatts• Front office transactions are reduced by an average annual 70 megawattsIncreasing the wind capital cost by 11% had the following effects relative to the base case portfolio:• The CEM removed 1,100 megawatts of wind capacity• An east IGCC resource was added (497 megawatts)• The PVRR increases by $231 million• Front office transactions increased by an average annual 21 megawatts• Class 1 DSM is reduced by 50 megawatts, apparently displaced by the other resource additionsLow and high commodity coal pricesLowering the coal price for new coal resources had the following effects relative to the base caseportfolio:• The PVRR decreases by $204 million• The CEM removed the west SCCT (332 megawatts) and 500 megawatts of wind (90 megawattscapacity contribution)• Front office transaction were increased by an average annual 44 megawatts, while DSM decreasesby 13 megawattsRaising the coal price for new coal resources has the following effects relative to the base caseportfolio:149
<strong>PacifiCorp</strong> – <strong>2007</strong> IRPChapter 7 – Modeling and• The Wyoming SCPC plants were moved up a year, and the large and small Utah SCPCsswitched places: the large 600-megawatt unit moved from 2018 to 2012, while the small 340-megawatt unit moved from 2012 to 2018. (The coal price change adversely affected the economicsof the small Utah SCPC unit to a greater degree than for the large Utah SCPC unit).The timing change of the coal plants resulted in removal of a west SCCT (332 megawatts)and <strong>30</strong>0 megawatts of wind (42-megawatt capacity contribution)• The PVRR increased by $375 million• Front office transaction increased by an average annual 44 megawatts, while DSM decreasesby 61 megawattsLow and high IGCC capital costLowering the IGCC capital cost had the following effects relative to the base case portfolio:• The CEM added an east IGCC (497 megawatts), and moved up the 200-megawatt westIGCC from 2017 to 2016• The CEM removed 700 megawatts of wind (119-megawatt capacity contribution), and aSCCT (<strong>30</strong>2 megawatts)• The PVRR decreased by $46 million• Front office transactions increased by an average annual 13 megawattsRaising the IGCC capital cost had the following effects relative to the base case portfolio:• The west IGCC is deferred from 2017 to 2018, which increases front office transactions byan average annual 46 megawatts and raises PVRR by $54 millionImpact of switching from an IGCC with a spare gasifier to one with a single gasifierThis change reduced PVRR by $4 million. <strong>Resource</strong> impacts included switching the location of aSCCT from the west location to the east location in 2012, reducing wind by 200 megawatts (32-megawatt capacity contribution), and reducing front office transactions by an average annual 87megawatts.Cost impact of building an IGCC with carbon sequestrationReplacing a carbon-capture-ready IGCC with one that has carbon sequestration increased PVRRby $541 million. The IGCC replacement resulted in minor resource selection impacts; namely,Class 1 DSM increased by 48 megawatts, and front office transactions increased by an averageannual 19 megawatts.<strong>Plan</strong> to the average of the eight-hour super-peak periodRelative to the base case portfolio, CAF11, planning to the average of the eight-hour super-peakperiod decreases PVRR by $194 million. The resource impacts include: removal of a SCCT (<strong>30</strong>2megawatts), a decrease in wind capacity by 100 megawatts, and a reduction in front office transactions(103 megawatts on an average annual basis). DSM was unaffected.Favorable wind development environment combined with expiration of the renewable productiontax credit (PTC)Comparing the portfolio PVRR for CAF07 and SAS16 indicates the impact of not renewing thePTC after 2008. The impact was found to be an additional $1.7 billion. Removing the PTC also150
<strong>PacifiCorp</strong> – <strong>2007</strong> IRPChapter 7 – Modeling andsignificantly changed the wind investment schedule. Figure 7.2 compares the cumulative annualnameplate megawatt wind additions for CAF07 and SAS16. With no PTC in place (SAS16), themodel chose to add wind in a smooth pattern until 2017, and then add 1,400 megawatts in 2018.This large capacity addition is an artifact of the timing of the generic growth stations, which startin 2019. With the PTC in place (CAF07), the wind addition schedule was lumpier, with significantadditions in <strong>2007</strong>, 2013, and 2015.Figure 7.2 – Cumulative Wind Additions for CAF07 and SAS164,0003,5003,0002,500MW2,0001,5001,0005000CAF07SAS16<strong>2007</strong> 2008 2009 2010 2011 2012 2013 2014 2015 2016 2017 2018<strong>Resource</strong> Selection ConclusionsBased on the CEM modeling results, a number of general observations can be reached regardingthe model’s resource preferences, and what specific resources constitute robust selections to includein the risk analysis portfolios. First, supercritical pulverized coal was part of the resourcestack in all the CEM portfolio solutions except for the three scenarios with high coal costs andlow gas and electricity prices (CAF04, CAF05, and CAF06). Given that a high CO 2 adder is expectedto put upward pressure on gas prices due to greater demand for cleaner power supplies, ascenario more in line with the “favorable wind environment” future (CAF07)—or the version ofthis scenario without renewable production tax credits (SAS16)—is a more realistic future. Forthese two scenarios, the model still selected supercritical pulverized coal and added it early in thestudy period.A second observation concerns the model’s selection frequency of the resources across the alternativefuture studies. Only two resources appeared in the majority of the studies: the large Wyo-151
<strong>PacifiCorp</strong> – <strong>2007</strong> IRPChapter 7 – Modeling andming and small Utah supercritical pulverized coal units. With few exceptions, the CEM addedthese coal units as soon as they were available for selection. Based on this result, <strong>PacifiCorp</strong>judged these coal resources to be robust options under the set of alternative futures evaluated.Figure 7.3 shows the selection frequency for all fossil fuel resources.Regarding gas resource selection, CCCTs came into play only under scenarios that included lowgas/electricity prices or high load growth. Selection of single-cycle combustion turbine framesappears to be sensitive to the level of load growth assumed; these resources were added for twoscenarios with high load growth, as well as the medium load growth scenario. Given these selectionpatterns, gas plants are not judged to be robust resources under deterministic modeling conditions.However, it should be noted that the CEM deterministic runs do not capture the optionalityvalue of gas resources; consequently, testing them in a stochastic modeling environment isnecessary to estimate their full value in a diversified portfolio.Figure 7.3 – CEM Fossil Fuel <strong>Resource</strong> Selection Frequency161412Frequency (N = 16)1086420Large PulverizedCoal WY #1Small PulverizedCoal UTLarge PulverizedCoal UTCCCT F 2x1 WestIGCC West #1CCCT F 2x1 UtahLarge PulverizedCoal WY #2SCCT Frame WestCCCT G 1x1 WestSCCT Frame UtahIGCC WYIGCC West #2IGCC UtahCoal Coal Coal Gas Coal Gas Coal Gas Gas Gas Coal Coal CoalFossil Fuel <strong>Resource</strong>s152
<strong>PacifiCorp</strong> – <strong>2007</strong> IRPChapter 7 – Modeling andWind appeared in 15 out of the 16 alternative future studies. While this resource is consideredrobust as far as inclusion in the CEM’s investment plans is concerned, unlike the pulverized coalresources, a robust quantity can’t be determined due to the wide variance in selected wind capacitiesamong the alternative future studies. Consequently, the company used measures of centraltendency to determine an initial wind investment schedule for inclusion in the risk analysisportfolios. The development of the wind investment schedule is described in the next section.The CEM chose IGCC for 10 out of the 16 alternative futures, with the west IGCC units (total of500 megawatts) selected in seven futures and the east IGCC units selected in four futures. Themodel’s selection of east-side IGCC resources was predicated on the high load growth assumption,and these resources were generally added beyond the 10-year investment horizon (<strong>2007</strong>–2016).RISK ANALYSIS PORTFOLIO DEVELOPMENT – GROUP 1To develop the first risk analysis portfolio, <strong>PacifiCorp</strong> first combined the fixed wind, DSM, andCHP investment schedules described below, along with the other resource options. The CEMwas then executed with this set of resources using the medium-case assumptions adopted for thealternative future studies. The resulting CEM investment plan, labeled as RA1, thus parallels theplan that resulted from the “medium case” alternative future (CAF11) run. To derive subsequentrisk analysis portfolios, <strong>PacifiCorp</strong> applied one or a combination of alternative resource strategiesto RA1 or other variants of RA1 prior to CEM execution.Twelve portfolios were initially developed with input received from public stakeholders duringthe fall of 2006. <strong>PacifiCorp</strong> used the associated portfolio simulation results and the analysis supportingthe 10-year Business <strong>Plan</strong> to formulate a “base case” resource proposal that was sharedwith regulators.The feedback received on the resource proposal, as well as recent external events 53 and an assessmentof state resource policy directions, prompted the company to investigate portfolio alternativesthat recognize existing and expected state resource acquisition constraints. A new set ofrisk analysis portfolios was consequently created to address these constraints while still adheringto system planning principles and the states’ IRP development guidelines. (The new risk analysisportfolios also account for the revised load forecast.)This second portfolio group constitutes the “finalists” from which the preferred was selected.The original set of 12 risk analysis portfolios informed the construction of these new portfolios.This chapter documents both sets of portfolios, which are referenced as “Group 1” and “Group2”.53 These events, cited in Chapter 3, include the Oregon PUC rejection of the 2012 RFP for baseload resources andissuance of new IRP guidelines (January 2006), adoption of renewable portfolio standards in Washington, California’sadoption of a green house gas emissions performance standard, and introduction of climate change legislationin both Oregon and Washington.153
<strong>PacifiCorp</strong> – <strong>2007</strong> IRPChapter 7 – Modeling andFixed <strong>Resource</strong> Additions for Risk Analysis PortfoliosRenewablesA fixed wind resource investment schedule was included in all risk analysis portfolios. Pacifi-Corp developed an initial wind investment schedule based on a composite view of the resourceaddition patterns for the 16 alternative future scenarios covering the period <strong>2007</strong> through 2016.This initial wind investment schedule was modified as appropriate to support the testing of alternativeresource strategies.The CEM selected a wide range of wind resource capacities across the alternative future scenarios,from zero capacity for CAF08 (“unfavorable wind environment”) to 3,100 megawatts ofnameplate capacity for two scenarios (CAF07, “favorable wind environment” and CAF09, “highDSM potential”). The average nameplate amount for the 16 scenarios was 1,213 megawatts (fora capacity contribution of 235 megawatts), while the median amount was 950 megawatts. Theamount selected for the medium case scenario was 700 megawatts. The most frequently occurringamount was 400 megawatts for four scenarios.Figure 7.4 shows the amount of wind capacity that the CEM selected for each of the alternativefuture scenarios. Both nameplate capacity and capacity contribution are shown.Figure 7.4 – Wind Capacity Preferences for Alternative Future ScenariosMegawatts3500<strong>30</strong>0025002000150010005000CAF00 CAF01 CAF02 CAF03 CAF04 CAF05 CAF06 CAF07 CAF08 CAF09 CAF10 CAF11 CAF12 CAF13 CAF14 CAF15 Ave.Wind Capacity Contribution 82 196 60 277 259 215 354 514 0 514 85 148 95 222 99 410 235Renew ables Nameplate <strong>30</strong>0 1,000 400 1,400 1,400 1,400 2,200 3,100 - 3,100 400 700 400 900 400 2,<strong>30</strong>0 1213Wind Capacity ContributionRenewables NameplateFigure 7.5 profiles the CEM’s location preferences for wind resources across the alternative futureportfolios. It shows the number of scenarios in which wind was selected by location, and theaverage number of 100 megawatt project sites selected for each location four sites—SoutheastIdaho, Southwest Wyoming, North Central Oregon, and East Central Nevada—appeared in themajority of the scenarios. The southeast Wyoming location (SE WY) had the largest number ofsited added.154
<strong>PacifiCorp</strong> – <strong>2007</strong> IRPChapter 7 – Modeling andFigure 7.5 – Wind Location Preferences for Alternative Future ScenariosNumber of alternative future scenarios (out of 16) in which wind was chosen for the locationAverage number of 100 MW sites added to the location1614121086420SE ID SW WY NC OR EC NV SE WA SE WY SC MT WC UTLocationGiven these model results, a total nameplate capacity of 1,000 megawatts (capacity contributionof 217 megawatts) was added to each of the risk analysis portfolios and distributed among thesites favored by the model. Note that this capacity amount is in addition to the 400 megawattsconsidered a planned resource for <strong>2007</strong> and reflected in <strong>PacifiCorp</strong>’s load and resource balance.Table 7.14 shows the resource addition schedule for 2008 through 2016 adopted for the riskanalysis portfolios.Table 7.14 – Wind <strong>Resource</strong> Additions Schedule for Risk Analysis PortfoliosAnnualAdditions,NameplateCapacity(MW)CumulativeWind NameplateCapacity(MW)Cumulative WindPeak CapacityContribution(MW)YearLocation2008 200 North Central Oregon; Southeast Idaho 200 622009 200 North Central Oregon; Southeast Idaho 400 1102010 100 Southeast Idaho 500 1272011 - - 500 1272012 <strong>30</strong>0 Southwest Wyoming 800 1892013 200 Southwest Wyoming 1,000 217Class 1 Demand-side Management ProgramsA fixed megawatt amount of certain Class 1 demand-side management programs were includedin all risk analysis portfolios based on a review of DSM addition patterns covering the 2017-2016 investment horizon for the alternative future scenarios. In order to be selected for risk155
<strong>PacifiCorp</strong> – <strong>2007</strong> IRPChapter 7 – Modeling andanalysis portfolio inclusion, programs needed to have been chosen in the medium case scenario(CAF11) or a majority of the other alternative future scenarios, as well as have a capacity thatexceeds 10 megawatts when selected. This combination of criteria is meant to strike a balancebetween a relatively aggressive DSM implementation pattern for the risk analysis portfolios (accountingfor the fact that not all potential system benefits can be readily quantified and capturedin the CEM solution) and constraining the entire set of CEM options to a reasonable number.For the medium case scenario, the CEM chose the following programs, megawatt quantities (asmeasured at the customer meter), and installation years:● East-side summer direct load control – 48 megawatts in 2013● West-side summer direct load control – 8 megawatts in 2013● East-side commercial/industrial direct load control – 2 megawatts in 2013● East-side scheduled irrigation – 15 megawatts in 2012● West-side scheduled irrigation – 32 megawatts in 2012The only resources that the CEM selected for the majority of alternative future scenarios werethe east-side and west-side scheduled irrigation programs. The CEM selected the east-side programin 11 out of 16 scenarios, while the west-side program was selected in 10 out of 16 scenarios.Figures 7.6 and 7.7 show the number of scenarios in which program types were selected bythe CEM and the average megawatts for all scenarios, respectively.Regarding the CEM’s selection of program installation dates, 2012 and 2013 were the mostcommon across the alternative future scenarios. Only under the high-cost bookend scenario(CAF15) are programs selected for implementation earlier than 2010. For this scenario, severalprograms are added in 2008, such as east-side scheduled irrigation and the three east-side directload control programs (summer, winter, and commercial/industrial).Figure 7.6 – Class 1 DSM Selection Frequency for Alternative Future Scenarios, <strong>2007</strong>-20161210Frequency (N=16)86420East Sch.IrrigationWest Sch.IrrigationEast DLCSummerEast DLCC&IEast DLCWinterWest DLCSummerEastThermalStorageWest DLCSummerWest DLCC&IWestThermalStorage156
<strong>PacifiCorp</strong> – <strong>2007</strong> IRPChapter 7 – Modeling andFigure 7.7 – Class 1 DSM Average Megawatts for Alternative Future Scenarios, <strong>2007</strong>-201625Average MW Per Program20151050East Sch.IrrigationWest Sch.IrrigationEast DLCSummerEast DLCC&IEast DLCWinterWest DLCSummerEastThermalStorageWest DLCSummerWest DLCC&IWestThermalStorageBased on these CEM results, and assuming a generic two or three-year phase-in period, Table7.15 shows the Class 1 DSM resource addition schedule for each of the risk analysis portfolios. 54Table 7.15 – Class 1 DSM Cumulative <strong>Resource</strong> Additions for Candidate PortfoliosClass 1 DSM Program LocationAnnual Cumulative Megawatt Additions(at the customer meter)2010 2011 2012 2013Summer Direct Load Control East 16 32 48Irrigation Control East 8 15Irrigation Control West 11 21 32Combined Heat and Power <strong>Resource</strong>sA fixed megawatt amount of combined heat and power (CHP) resources were included in all riskanalysis portfolios based on a review of CHP addition patterns for the alternative future scenarios.Figure 7.8 shows the megawatts selected in each of the scenarios by location. (Note that theCHP resource included in the CEM was the 25-megawatt gas-fired topping cycle unit.) Themost common resource selection pattern was 125 megawatts (100 megawatts installed in thewest side and 25 megawatts installed in the east side), which occurred for seven of the 16 scenarios.The average quantity selected for all scenarios was 90 megawatts. For 11 out of the 16 scenarios,the CHP capacity was added in 2012. Based on these results, <strong>PacifiCorp</strong> chose a CHPresource investment schedule consisting of three 25-megawatt CHP units in the west in 2012 andone 25-megawatt CHP facility in the east control area in 2012.54 Selection of DSM programs or any other resource type for the candidate portfolios should not be construed asmeaning that <strong>PacifiCorp</strong> is limiting program procurement in any way. Similarly, the resource additions schedule,including the phase-in period, is not indicative of the pace of actual program implementation once <strong>PacifiCorp</strong> identifiescost-effective programs through its procurement process.157
<strong>PacifiCorp</strong> – <strong>2007</strong> IRPChapter 7 – Modeling andFigure 7.8 – CHP Quantities Selected for Each Alternative Future Scenario, <strong>2007</strong>-2016Megawatts110100908070605040<strong>30</strong>20100Business As UsualLow Cost Coal/High Cost Gas/Med Load GrowthLow Cost Coal/High Cost Gas/Low Load GrowthLow Cost Coal/High Cost Gas/High Load GrowthHigh Cost Coal/Low Cost Gas/Med Load GrowthHigh Cost Coal/Low Cost Gas/Low Load GrowthHigh Cost Coal/Low Cost Gas/High Load GrowthFavorable Wind EnvironmentUnfavorable Wind EnvironmentHigh DSM PotentialLow DSM PotentialMedium Load GrowthLow Load GrowthHigh Load GrowthLow Cost Portfolio BookendHigh Cost Portfolio BookendWestEastCAF00 CAF01 CAF02 CAF03 CAF04 CAF05 CAF06 CAF07 CAF08 CAF09 CAF10 CAF11 CAF12 CAF13 CAF14 CAF15Alternative <strong>Resource</strong> StrategiesThe original 12 risk analysis portfolios were developed according to five resource strategies.These portfolios are distinguished by the planning reserve margin level and the quantity and timingof wind, front office transactions, pulverized coal, and IGCC resources included. The fiveresource strategies are summarized below.● Reduce CO 2 cost risk by deferring coal plants until low CO 2 -emitting coal options with carbonsequestration are commercially proven (such as IGCC or pulverized coal with chill ammoniaCO 2 removal) 55 , or eliminating them as a resource option altogether.● Reduce electricity market price risk by eliminating long-term reliance on front office transactionsafter 2011, the year that <strong>PacifiCorp</strong>’s system becomes significantly capacity-short.● Acquire additional wind resources above the amount contained in the initial wind investmentschedule described above.● <strong>Plan</strong> to a 12 percent planning reserve margin to reduce the risk of having excess generationcapacity in the event that expected load growth does not materialize.● Acquire base load coal resources in the near term to hedge against high gas and electricityprices and price volatility.55 This strategy is what the Oregon PUC calls a “coal plant delay scenario”. It relies primarily on gas resources andmarket purchases to address any resource gaps until IGCC is available. (See OPUC IRP Acknowledgement Order,LC-39, Order No. 06-029, p. 51.)158
<strong>PacifiCorp</strong> – <strong>2007</strong> IRPChapter 7 – Modeling andTable 7.16 outlines the specifications for the 12 risk analysis portfolios (labeled RA1 throughRA12), and presents the design rationale for each.The CEM scenario definitions for the risk analysis portfolios include the “medium” forecast valuesfor CO 2 costs, gas/electricity prices, load growth, RPS generation requirements, productiontax credit availability, and DSM potential. Nevertheless, the risk analysis portfolios emulatemany of the other scenario conditions modeled for the alternative future studies. For example,RA6, which entails removal of pulverized coal as an option, is representative of the coal resourceoutcome of the three alternative future scenarios based on high coal costs and low gas costs(CAF04, CAF05, and CAF06).Table 7.16 – Risk Analysis Portfolio Descriptions (Group 1)ID Description Design RationaleRA1 “Medium” alternative future portfolio, with wind,DSM, and CHP at fixed levels and front officetransactions capped at quantities assumed for the2004 IRPother 11 portfolios.RA2RA3RA4RA5RA6RA7RA1 with front office transactions removed as aresource option from 2012 onward (long-termasset-based portfolio)RA1 with an additional 600 MW of wind addedinto the portfolioRA2 with 12% planning reserve margin and frontoffice transactions removed as a resource optionfrom 2012 onward (long-term asset-based portfolio)RA2 with the model constrained to select a secondUtah pulverized coal plant in 2013 and aneast-side IGCC in 2014. Front office transactionsare removed as a resource option from 2012onward (long-term asset-based portfolio)RA1 with pulverized coal removed as a resourceoptionRA2 with 600 MW of additional wind as in RA3and front office transactions removed as a resourceoption from 2012 onward (long-termasset-based portfolio)By virtue of having the fewest constraints on resourcechoice, it serves as a performance benchmarkand starting point for development of theTests the strategy of eliminating the use of shorttermmarket purchases (front office transactions)to meet long-term resource needs, and therebyreduce exposure to electricity market price risk.Tests the strategy of using incremental amounts ofwind to reduce CO 2 , fuel, and market price risks.Represents a variant of the “long-term assetbased”portfolio (RA2), but with the lower planningreserve margin to determine the associatedcost/risk tradeoff.Tests the relative economics and risk of buildingcoal early as a hedge against gas and electricitymarket price risk; the IGCC plant replaces an eastsidegas plant.Tests the strategy of reducing CO 2 cost risks, aswell as testing the risk impact of relying on highervariable cost, shorter lead-time resources untilIGCC is commercially ready (i.e., gas-fired generationand market purchases).Tests additional wind in combination with theconstruction pattern resulting from limiting frontoffice transactions.RA8 RA1 with a 12% planning reserve margin Tests the medium alternative future portfolio(RA1) with the lower 12% planning reserve margin.RA9RA8 with the model restricted to select WyomingIGCC plants in 2013 and 2016Tests an IGCC-intensive portfolio at the lowerplanning reserve margin level, assuming that thetechnology is commercially mature enough toacquire by 2013.RA10 RA9 with a 15% planning reserve margin Creates a version of RA9 that parallels others withthe higher 15% planning reserve margin. Recommendedby an IRP public stakeholder at the October31, IRP public meeting.159
<strong>PacifiCorp</strong> – <strong>2007</strong> IRPChapter 7 – Modeling andID Description Design RationaleRA11 RA3 (600 MW additional wind and front officetransactions included) with the model restrictedto select gas resources in 2012 and 2013 and anIGCC resource in 2014Tests the strategy of reducing CO 2 cost risks withadditional wind and restrictions on pulverized coalbuilds, as well as testing the risk impact of relyingon gas resources and front office transactions toaddress resource deficits until an IGCC resource isacquired in 2014. 56RA12 RA11 with a 12% planning reserve margin Creates a version of RA11 that parallels otherswith the lower 12% planning reserve margin. Seethe previous footnote.The CEM was allowed to optimize the timing of all resources, subject to the following conditions.First, the earliest in-service dates for resources reported in Chapter 5 (Table 5.1, East SideSupply-Side <strong>Resource</strong> Options) were observed with the exception of the Wyoming supercriticalpulverized coal (SCPC) plant. Based on a more recent assessment of the acquisition timeline forthis resource, the earliest in-service date was changed from 2013 to 2014 in the model. (Alsonote that the first Utah SCPC resource was modeled at 340 megawatts rather than the 600 megawattsreported in the Supply-Side <strong>Resource</strong> Options table to reflect a project scale similar to theIntermountain Power Project Unit 3 (IPP 3). This unit is thus referenced as the “small UtahSCPC resource.”) Second, the timing of wind, class 1 DSM, and CHP was fixed according tothe pre-defined investment schedules described earlier in the chapter.Running the CEM for each of the 12 risk analysis portfolios resulted in a unique set of generatingand transmission resources and timing patterns. <strong>Resource</strong> selections for 2012–2014 are profiledbelow.● 2012 resources– The small Utah SCPC resource was selected in 10 of the 12 portfolios, or 9 of the 11 forwhich pulverized coal was not excluded as a model option– The east single-cycle combustion turbine (SCCT) frame was selected in 9 of the 12 portfolios– The east combined cycle combustion turbine (CCCT) was selected in 5 of the 12 portfolios– The west SCCT frame was selected in 10 of the 12 portfolios– The west CCCT was selected in 4 of the 12 portfolios● 2013 and 2014 resources– The first Wyoming SCPC resource was selected in 6 of the 12 portfolios (replaced byIGCC in one and not allowed in another)– Only one gas resource was selected for 2013; all others were selected for 2012Table 7.17 shows generation (coal and gas) and transmission resource additions for each of therisk analysis portfolios by general location and year.56 This portfolio, requested for study by OPUC staff, addresses the OPUC’s 2004 IRP acknowledgement order mandateto “fully explore whether delaying a commitment to coal until IGCC technology is further commercialized is areasonable course of action.” (Order No. 06-029, p. 51)160
<strong>PacifiCorp</strong> – <strong>2007</strong> IRPChapter 7 – Modeling andTable 7.17 – Generation and Transmission <strong>Resource</strong> AdditionsCoal<strong>Resource</strong> RA1 RA2 RA3 RA4 RA5 RA6 RA7 RA8 RA9 RA10 RA11 RA12Small Utah SCPC (340 MW) 2012 2012 2012 2012 2012 - 2012 2012 2012 2012 2018 -Large Utah SCPC (600 MW) 2017 2018 2018 2018 2013 - 2018 2017 2018 2018 2018 2018Wyoming SCPC 1 (750 MW) 2013 2013 2015 2013 2013 - 2014 2014 2017 2017 2015 2016Wyoming SCPC 2 (750 MW) 2018 2018 2018 2018 2018 - 2018 2018 - - 2018 2018West IGCC (200 MW) 2016 2017 2017 2016 2018 2016 2017 2018 2018 2018 2018 2018West IGCC (<strong>30</strong>0 MW) 2018 2017 2018 2017 2018 2018 2017 2018 2018 2018 2018 2018Wyoming IGCC 1 (497 MW) - - - - 2014 2016 - - 2013 2013 2014 2014Wyoming IGCC 2 (497 MW) - - - - - 2017 - - 2016 2016 - -Utah IGCC 1 (497 MW) - - - - - 2018 - - - - - -Utah IGCC 2 (497 MW) - - - - - 2018 - - - - - -GasWest SCCT Frame (332 MW) 2012 2012 2012 2012 2012 2013 2012 - - 2012 2012 2012West CCCT F 2x1 w/DF (602 MW) - 2012 - - 2012 - 2012 - - - - -West CCCT G 1x1 w/DF (392 MW) - - - 2012 - - - - - - - -East SCCT Frame (<strong>30</strong>2 MW) - 2012 2012 2012 2012 2012 2012 2012 - - 2012 2012East CCCT F 2x1 w/DF (548 MW) - 2012 - - 2012 2012 2012 - - - - -East CCCT G 1x1 w/DF (357 MW) - - - 2012 - - - - - - - -Front Office TransactionsAve Annual MW, 2012-20161,063 - 1,005 - - 1,024 - 1,000 1,115 1,097 1,009 863<strong>Plan</strong>ning Reserve Margin 15% 15% 15% 12% 15% 15% 15% 12% 12% 15% 15% 12%Transmission Project RA1 RA2 RA3 RA4 RA5 RA6 RA7 RA8 RA9 RA10 RA11 RA12West Main-Walla Walla2012 2012 2012 2012 2012 2012 2012 2012 2012 2012 2012 2012(6<strong>30</strong> MW)Walla Walla-Yakima B(400 MW)Mona-Utah North(500 MW increments)Jim Bridger-Ben Lomond(500 MW increments)Utah North-West Main(500 MW increments)Wyoming-Bridger(500 MW increments)Path-C Upgrade B 57(600 MW)2012 2012 2012 2012 2012 2012 2012 2012 2012 2012 2012 20122012x12015x22018x12018x12016x22018x1- -2012x12016x22018x12018x12018x12016x22018x1-2018x12014x22014x12018x12018x12014x12018x12018x12014x22018x12018x12016x22018x1- - -2018x12015x22017x12018x32012x22016x22017x12015x1- -2015x22018x12018x1- - - - - 2018 - - - - - -2016x32018x12018x1STOCHASTIC SIMULATION RESULTS – GROUP 1 PORTFOLIOSThe 12 risk analysis portfolios were run in stochastic simulation mode with varying loads, thermaloutages, hydro availability, and electricity and natural gas wholesale prices across 100 itera-57 The original Path C upgrade and the Craig Hayden - Utah North transmission projects were treated as fixed assumptionsin the CEM.161
<strong>PacifiCorp</strong> – <strong>2007</strong> IRPChapter 7 – Modeling andtions. The sections below show how the portfolios compare to one another on the basis of thestochastic cost, risk, reliability, and emissions measures. The section concludes with a summaryportfolio performance assessment, as well as resource selection conclusions that informed thedevelopment of the second group of risk analysis portfolios.Stochastic Mean CostTable 7.18 reports the stochastic mean PVRR for each of the portfolios by CO 2 adder cases, andshows the portfolio rankings based on the PVRR average across the five adder cases. PortfolioRA1 has the lowest average PVRR, followed by RA7 and RA3. In contrast, RA5 and RA6 havethe highest average PVRRs.Table 7.18 – Portfolio Cost by CO 2 Adder CaseStochastic Mean PVRR (Million $)ID$0 Adder(2008$)$8 Adder(2008$)$15 Adder(2008$)$38 Adder(2008$)$61 Adder(2008$) Average RankRA1 21,016 21,346 21,614 21,865 21,706 21,509 1RA2 21,183 21,514 21,758 21,893 21,601 21,590 4RA3 21,269 21,515 21,740 21,827 21,482 21,567 3RA4 21,140 21,489 21,753 21,975 21,789 21,629 5RA5 21,921 22,238 22,496 22,583 22,225 22,292 11RA6 22,042 22,313 22,548 22,658 22,411 22,394 12RA7 21,414 21,642 21,829 21,732 21,200 21,563 2RA8 21,140 21,472 21,758 22,072 22,018 21,692 6RA9 21,663 21,964 22,242 22,510 22,423 22,160 10RA10 21,573 21,882 22,158 22,392 22,244 22,050 9RA11 21,529 21,769 22,019 22,139 21,827 21,857 8RA12 21,505 21,754 21,999 22,143 21,881 21,856 7Figure 7.9 shows the progression of each portfolio’s stochastic cost as the CO 2 adder increases.For most of the portfolios, the cost peaks at the $38 adder level, and then declines at the $61 adderlevel. This cost behavior is driven by the influence of CO 2 allowance trading activity in thestudies’ out-years, where a significant amount of allowance credits are realized.162
<strong>PacifiCorp</strong> – <strong>2007</strong> IRPChapter 7 – Modeling andFigure 7.9 – Stochastic Mean Cost by CO 2 Adder Case23,000Stochastic Mean PVRR (Million $)22,50022,00021,50021,00020,500$0 Adder$8 Adder$15 Adder$38 Adder$61 Adder20,000RA1RA2RA3RA4RA5RA6RA7RA8RA9RA10RA11RA12It is noteworthy that the CEM’s deterministic portfolio solution without resource restrictions—Portfolio RA1—also has the lowest stochastic cost. Table 7.19 summarizes the cost impact ofconstraining CEM-selected resources in the reference portfolio according to the resource strategiesdefined for the other portfolios. The average PVRRs for the five CO 2 adder cases is used asthe cost impact measure.Table 7.19 – Cost Impact of Portfolio <strong>Resource</strong> StrategiesCost Impact Relative to PortfolioRA1ID <strong>Resource</strong> Strategy Modeled in the CEMAve. Stochastic Mean PVRR forCO 2 adder cases( Million $)RA1 Reference Case: no resource constraints (FOT capped at 1200 MW) -RA2 Remove FOT as a resource option after 2011 81RA3 Additional wind 57RA4 <strong>Plan</strong> to a 12% PRM and remove FOT after 2011 120RA5 Early SCPC and force IGCC in 2014 783RA6 Remove SCPC as a resource option 885RA7 Additional wind and remove FOT after 2011 54RA8 <strong>Plan</strong> to a 12% PRM 183RA9 Force IGCC in 2013 and 2016 651RA10 Force IGCC in 2013 and 2016; plan to 12% PRM 540RA11 Additional wind; exclude SCPC for 2012-13 and force IGCC in 2014 348RA12 Same as RA11 but plan to a 12% PRM 347163
<strong>PacifiCorp</strong> – <strong>2007</strong> IRPChapter 7 – Modeling andAs shown in the table, constraining the coal resources has the largest impact. Removing supercriticalpulverized coal increases portfolio cost by $885 million relative to the RA1 portfolio.Portfolios with a 15 percent planning reserve margin that involved restricting the CEM to selectIGCC in certain years (RA5, RA10, and RA11) averaged $557 million higher. The average costincrease for all the portfolios relative to RA1 was $368 million.Other observations concerning the relationship between portfolio cost and resource mix and timinginclude the following.● Building coal resources earlier or later than recommended by the CEM increases stochasticcost.● Lowering the planning reserve margin increases stochastic PVRR due to the costs associatedwith higher Energy Not Served. Rather than reducing investment in base load plants to meetthe lower load obligation, the CEM chooses to defer them.● Acquiring the additional 600 megawatts of wind increases stochastic cost, although theamount is smaller than for the other resource strategies.● Removing front office transactions after 2011 increases stochastic cost.Customer Rate ImpactFigure 7.10 shows the customer rate impact of each portfolio. 58 The rate impact measure is thechange in the customer dollar-per-megawatt-hour price from 2008 through 2026 due to the portfolioresources, expressed on a levelized net present value basis. As indicated, RA1 has thesmallest rate change at $3.08/MWh. RA6, which has no pulverized coal plants, has the highest at$3.31/MWh.Figure 7.10 – Customer Rate ImpactStochastic mean price change from 2008 through 2026,Levelized Net Present Value basis$3.50$3.25$3.08 $3.11 $3.11 $3.11$3.23$3.31$3.13$3.11$3.23$3.20$3.17$3.18$/MWh$3.00$2.75$2.50RA1 RA2 RA3 RA4 RA5 RA6 RA7 RA8 RA9 RA10 RA11 RA1258 The revenue requirement calculated by the CEM uses a real levelized capital charge.164
<strong>PacifiCorp</strong> – <strong>2007</strong> IRPChapter 7 – Modeling andEmissions Externality Cost<strong>PacifiCorp</strong> calculates the emissions externality cost as the increase in stochastic mean PVRRrelative to the $0 adder case for each CO 2 adder level. This externality cost measure captures (1)the increased variable operating costs for fossil fuel generation, (2) the system re-dispatch impactattributable to the cost adders, and (2) the net present value of the sum of the annual CO 2 allowancetrading balances for <strong>2007</strong>–2026. The externality costs are reported in Table 7.20 along withportfolio rankings based on the average of the incremental costs for the four adder levels. Thesecost estimates assume a cap-and-trade compliance strategy.Portfolio RA7 performs the best with an average externality cost of $187 million. RA8 had thehighest cost at $690 million. All the portfolios that included the extra wind—RA3, RA7, RA11,and RA12—had the lowest costs. In contrast, portfolios built according to the lower 12-percentplanning reserve margin had the highest externality costs (RA8 and RA9). The lower reservemargin results in higher coal resource utilization to keep the system balanced.Table 7.20 – Portfolio Emissions Externality Cost by CO 2 Adder LevelIncremental Stochastic Mean PVRR by CO 2 Adder (Million $)CO 2 Adder Level (2008$)ID $0 $8 $15 $38 $61 Average RankRA1 - 3<strong>30</strong> 598 849 690 617 10RA2 - 331 575 710 417 508 7RA3 - 246 471 558 213 372 2RA4 - 349 613 835 649 612 9RA5 - 317 575 662 <strong>30</strong>4 465 6RA6 - 271 506 616 369 441 5RA7 - 228 415 318 -214 187 1RA8 - 332 618 932 878 690 12RA9 - <strong>30</strong>1 579 847 760 622 11RA10 - <strong>30</strong>9 585 819 672 596 8RA11 - 240 490 610 298 410 3RA12 - 249 494 638 375 439 4Capital CostFigure 7.11 shows the total capital cost for each portfolio, expressed on a net present value of thesum of all capital costs accrued for <strong>2007</strong>–2026. As expected, RA5 with its relatively larger coalplant investment schedule and earlier in-service dates exceeds all others at $6.78 billion. In contrastRA6—with no coal resources until 2016—has the lowest capital cost at $5.08 billion. Theaverage capital for all portfolios is $5.83 billion.165
<strong>PacifiCorp</strong> – <strong>2007</strong> IRPChapter 7 – Modeling andFigure 7.11 – Total Capital Cost by PortfolioGeneration and Transmission Capital Cost, Net Present Value7.006.786.506.406.37Billion $6.005.505.445.725.945.565.085.195.665.806.015.004.504.00RA1 RA2 RA3 RA4 RA5 RA6 RA7 RA8 RA9 RA10 RA11 RA12Stochastic Risk MeasuresTables 7.21 and 7.22 report the stochastic risk results for each of the 12 risk analysis portfolios.Table 7.21 shows risk exposure and standard deviation (production cost) averaged across the fiveCO 2 adder cases, as well as the portfolio rankings for these two measures. Table 7.22 shows thedetailed statistics for each CO 2 adder case, and also includes fifth-percentile PVRR and ninetyfifth-percentilePVRR results.Table 7.21 – Average Risk Exposure and Standard Deviation for CO 2 Adder CasesRiskExposure(Million $)StandardDeviation(Million $)RankRankIDAverage Across CO 2 Adder CasesRA1 41,928 6 13,246 6RA2 41,217 4 13,015 4RA3 41,690 5 13,149 5RA4 42,245 7 13,324 7RA5 36,706 1 11,891 1RA6 47,588 12 14,666 12RA7 39,856 2 12,658 2RA8 43,287 11 13,581 11RA9 42,784 9 13,503 9166
<strong>PacifiCorp</strong> – <strong>2007</strong> IRPChapter 7 – Modeling andRiskExposure(Million $)StandardDeviation(Million $)RankRankIDAverage Across CO 2 Adder CasesRA10 42,247 8 13,337 8RA11 39,950 3 12,771 3RA12 42,952 10 13,576 10Table 7.22 – Risk Measure Results by CO 2 Adder Case (Million $)IDRiskExposureStandardDeviation5thPercentile95thPercentileUpper-TailMean$0 CO 2 Adder (2008$)RA1 34,879 9,837 14,258 34,111 55,894RA2 34,096 9,608 14,504 33,989 55,279RA3 34,654 9,753 14,553 34,404 55,923RA4 35,063 9,886 14,355 34,358 56,203RA5 29,837 8,544 15,819 33,286 51,758RA6 39,971 11,060 14,221 36,155 62,013RA7 32,900 9,313 14,968 34,007 54,315RA8 36,192 10,154 14,014 34,725 57,332RA9 35,783 10,097 14,699 35,608 57,445RA10 35,210 9,939 14,862 35,075 56,783RA11 33,101 9,411 14,988 34,596 54,6<strong>30</strong>RA12 35,860 10,1<strong>30</strong> 14,588 35,370 57,366$8 CO 2 Adder (2008$)RA1 37,651 10,690 12,770 35,895 58,997RA2 36,957 10,484 12,974 35,812 58,471RA3 37,419 10,602 12,900 36,099 58,934RA4 37,923 10,761 12,691 36,176 59,412RA5 32,538 9,377 13,987 35,148 54,776RA6 43,026 11,992 12,892 37,837 65,339RA7 35,683 10,166 13,061 35,7<strong>30</strong> 57,326RA8 38,949 11,008 12,824 36,481 60,420RA9 38,493 10,936 13,501 37,326 60,457RA10 37,974 10,787 13,313 36,817 59,856RA11 35,759 10,236 13,264 36,279 57,258RA12 38,638 10,984 13,001 37,029 60,391$15 CO 2 Adder (2008$)RA1 39,161 13,006 12,185 37,049 60,775RA2 38,449 12,737 12,340 36,953 60,207RA3 38,920 12,899 12,328 37,208 60,660RA4 39,432 13,053 12,232 37,327 61,186RA5 33,965 11,628 13,575 36,329 56,461RA6 44,615 14,400 12,701 38,9<strong>30</strong> 67,163RA7 37,149 12,394 12,688 36,822 58,978167
<strong>PacifiCorp</strong> – <strong>2007</strong> IRPChapter 7 – Modeling andIDRiskExposureStandardDeviation5thPercentile95thPercentileUpper-TailMeanRA8 40,469 13,332 12,361 37,624 62,226RA9 39,980 13,270 12,990 38,470 62,221RA10 39,479 13,103 12,800 37,967 61,637RA11 37,215 12,541 12,953 37,428 59,234RA12 40,127 13,340 12,544 38,142 62,126$38 CO 2 Adder (2008$)RA1 45,344 15,106 10,<strong>30</strong>4 40,944 67,209RA2 44,675 14,873 10,218 40,799 66,568RA3 45,113 15,004 10,315 40,962 66,940RA4 45,733 15,202 10,249 41,207 67,708RA5 40,037 13,728 11,554 39,967 62,620RA6 51,296 16,633 9,933 42,604 73,953RA7 43,247 14,487 10,371 40,489 64,979RA8 46,741 15,455 10,211 41,521 68,813RA9 46,206 15,369 10,878 42,278 68,716RA10 45,674 15,193 10,975 41,781 68,066RA11 43,311 14,616 11,019 41,334 65,451RA12 46,418 15,465 10,586 41,935 68,561$61 CO 2 Adder (2008$)RA1 52,604 17,593 6,398 44,741 74,310RA2 51,911 17,372 6,453 44,526 73,511RA3 52,345 17,487 6,203 44,627 73,826RA4 53,076 17,720 6,267 44,987 74,865RA5 47,152 16,176 7,941 43,024 69,377RA6 59,029 19,245 6,505 46,249 81,440RA7 50,298 16,931 6,105 43,972 71,498RA8 54,084 17,956 6,452 45,323 76,102RA9 53,459 17,843 7,121 45,995 75,883RA10 52,896 17,663 7,112 45,514 75,141RA11 50,365 17,052 6,989 45,086 72,193RA12 53,717 17,963 6,559 45,628 75,597Portfolio RA5 has the smallest average risk exposure due to the early addition of coal capacity.Other resource strategies that lower risk exposure include (1) increasing wind capacity, (2)eliminating or reducing reliance on market purchases, and (3) planning to a 15% reserve marginrather than 12%. For example, by comparing RA3 with RA1, the 600 megawatts of additionalwind is shown to reduce risk exposure by an average of $238 million across the five CO 2 adderscenarios. The risk reduction benefit increases at successfully higher CO 2 adder levels ($224million under the $0 adder to $260 million under the $61 adder). The benefit of reducing relianceon front office transactions after 2011 is evident from comparing portfolio RA2 with RA1. Theaverage risk exposure decreases by an average of $711 million. Combining both extra wind andeliminating front office transactions after 2011 (RA7) decreases average risk exposure by $2.1168
<strong>PacifiCorp</strong> – <strong>2007</strong> IRPChapter 7 – Modeling andbillion. Changing the planning reserve margin strategy (RA8) has a large impact on risk exposure:going from a 12% to 15% margin reduces average risk exposure by $1.4 billion.In contrast to the risk exposure reduction strategies, removing pulverized coal as a resource option(RA5) increases average risk exposure by $5.7 billion. At the $61 CO 2 adder level, the riskexposure for RA6 reaches a high of $6.4 billion.Cost/Risk Tradeoff AnalysisThe three figures below are scatter plots of portfolio cost (PVRR) and risk exposure, and illustratethe tradeoff between the two performance measures. Figure 7.12 plots the average PVRRand risk exposure across the CO 2 adder cases. Figure 7.13 shows the cost-risk relationship for the$0 CO 2 adder case, while Figure 7.14 shows the relationship for the $61 CO 2 adder case (representingthe CO 2 scenario risk bookends).The figures show that when considering exposure to potential high-cost outcomes, RA5 has thelowest portfolio risk regardless of the CO 2 adder level. However, when considering the balancebetween risk and cost, RA7 and RA1—and RA2 and RA3 right behind—perform the best amongthis portfolio set. Under the high CO 2 adder case, portfolio RA7 dominates the others by a significantamount.Figure 7.12 – Average Stochastic Cost versus Risk Exposure50.00Average Across All CO2 Adder Cases($0, $8, $15, $38, $61/ton)Risk Exposure: Upper-Tail StochasticMean minus Overall Mean PVRR (Billion $)47.5045.0042.5040.0037.5035.00RA6RA8RA12RA9RA4RA3RA1RA10RA2RA11RA7RA521.4 21.6 21.8 22.0 22.2 22.4Stochastic Mean PVRR (Billion $)169
<strong>PacifiCorp</strong> – <strong>2007</strong> IRPChapter 7 – Modeling andFigure 7.13 – Stochastic Cost versus Risk Exposure for the $0 CO 2 Adder Case41.00$0 CO2 Adder CaseRisk Exposure: Upper-Tail StochasticMean minus Overall Mean PVRR (Billion $)39.0037.0035.0033.0031.0029.00RA6RA8RA12RA9RA4RA10RA1RA2RA3RA11RA7RA520.9 21.1 21.3 21.5 21.7 21.9 22.1Stochastic Mean PVRR (Billion $)Figure 7.14 – Stochastic Cost versus Risk Exposure for the $61 CO 2 Adder Case60.00$61 CO2 Adder CaseRisk Exposure: Upper-Tail Stochastic Meanminus Overall Mean PVRR (Billion $)58.0056.0054.0052.0050.0048.0046.00RA6RA8RA3RA1RA4RA10RA12RA9RA2RA11RA7RA521.1 21.3 21.5 21.7 21.9 22.1 22.3 22.5Stochastic Mean PVRR (Billion $)As far the resource strategies go, increasing wind capacity and reducing reliance on market purchasespromotes a better balance of portfolio cost and risk. In contrast, eliminating pulverizedcoal yields the worst cost-risk balance in all cases; this strategy yields a portfolio with bothhigher-risk and higher-cost resources.170
<strong>PacifiCorp</strong> – <strong>2007</strong> IRPChapter 7 – Modeling and<strong>Resource</strong> Strategy Risk ReductionAs described above, adding constraints to the reference portfolio results in a higher stochasticcost. Nevertheless, it can be desirable to choose portfolios or resource strategies that may be suboptimalon the basis of expected stochastic cost, but that reduce risk exposure.Several risk analysis portfolios were developed to evaluate the cost versus risk exposure implicationsof specific resource strategies. These resource strategies and the associated test portfoliosare summarized in Table 7.23.Table 7.23 – <strong>Resource</strong> Strategies and Test Portfolios for Cost-Risk Exposure<strong>Resource</strong> StrategyEliminate market purchases after 2012 to reduce electricity market price riskInclude additional wind (600 MW) to reduce CO 2 , fuel and market price risksLower the planning reserve margin from 15% to 12% to reduce portfolio investment costsRemove pulverized coal plants as an option and fill the capacity gap with other resourcesTest PortfolioRA2RA3RA8RA6At issue is whether the resource strategies increase or decrease risk exposure relative to the referenceportfolio, and by how much. If an extra dollar of PVRR spent on the resource strategytranslates into more than a dollar in risk exposure reduction, then the extra portfolio cost couldbe considered a worthwhile insurance investment for customers. Comparing the PVRR and riskexposure at the $61 CO 2 adder level in these terms yields the following conclusions:• Eliminate market purchases after 2012 (RA2) – this resource strategy lowers total riskexposure; the relative reduction is $4.15 for every additional PVRR dollar spent• Include an additional 600 megawatts of wind (RA3) – this resource strategy lowers totalrisk exposure marginally; the relative reduction is $1.03 for every additional PVRR dollarspent• Lower the planning reserve margin from 15% to 12% (RA8) – this resource strategyraises total risk exposure; the relative increase is $11.93 for every additional PVRR dollarspent• Remove pulverized coal plants as a resource option (RA6) – this resource strategy raisestotal risk exposure; the relative increase is $6.26 for every additional PVRR dollar spentCarbon Dioxide and Other EmissionsThe following tables and figures profile the CO 2 emissions footprint for the risk analysis portfolios,as well as for SO 2 , NO X , and mercury (Hg). For CO 2 emissions, results are shown by CO 2adder level and for two periods, <strong>2007</strong>–2016 and <strong>2007</strong>–2026. The tables also report the separateCO 2 contributions from generators and market purchases (existing long term purchases, frontoffice transactions and spot purchases). Figures 7.15 and 7.16 show how the cumulative CO 2emission for each portfolio decline as the cost adder is increased.The resource strategies had the following effect on generator CO 2 emissions relative to the referenceportfolio, RA1:171
<strong>PacifiCorp</strong> – <strong>2007</strong> IRPChapter 7 – Modeling and• Removing all pulverized coal plants had the highest emission reduction benefit, lowering thegenerator CO 2 footprint by 12 million tons for <strong>2007</strong>–2016 and 29 million tons for <strong>2007</strong>–2026on average• Reducing front office transactions had a negligible impact on generator emissions for the firstten years; for <strong>2007</strong>–2026, there was a decrease of 7 million tons• The additional 600 megawatts of wind decreased emissions by 8 million tons for <strong>2007</strong>–2016and 22 million tons for <strong>2007</strong>–2026• Reducing the planning reserve margin from 15% to 12% decreased emissions by 2.5 milliontons for <strong>2007</strong>–2016, but the overall reduction for <strong>2007</strong>–2026 was only 259,000 tons• The IGCC bridging strategy (RA11) reduced emissions by 9 million tons for <strong>2007</strong>–2016 and14 million tons for <strong>2007</strong>–2026Table 7.24 – Cumulative CO 2 Emissions by Cost Adder Level, <strong>2007</strong>-2016Generator CO 2 Emissions, <strong>2007</strong>-2016 (1000 Tons)ID $0 Adder $8 Adder $15 Adder $38 Adder $61 Adder Average RankRA1 520,275 498,032 494,673 488,422 483,805 497,041 9RA2 522,525 498,785 495,141 488,3<strong>30</strong> 483,052 497,567 10RA3 511,893 490,290 486,868 480,446 475,651 489,0<strong>30</strong> 4RA4 523,785 500,658 497,114 490,322 485,150 499,406 12RA5 526,226 501,006 497,079 488,500 481,903 498,943 11RA6 507,235 486,289 482,912 476,713 472,093 485,048 1RA7 515,681 492,0<strong>30</strong> 488,377 481,337 475,995 490,684 5RA8 516,988 495,680 492,322 486,088 481,439 494,503 8RA9 515,118 493,741 490,461 484,494 480,148 492,792 6RA10 517,046 495,287 491,936 485,756 481,329 494,271 7RA11 511,198 489,590 486,177 479,694 474,732 488,278 3RA12 509,825 488,734 485,389 479,087 474,398 487,487 2CO 2 Emissions from Market Purchases, <strong>2007</strong>-2016 (1000 Tons)ID $0 Adder $8 Adder $15 Adder $38 Adder $61 Adder Average RankRA1 77,798 85,510 86,358 87,255 87,488 84,882 8RA2 65,<strong>30</strong>1 73,831 74,758 75,742 76,068 73,140 4RA3 77,243 76,374 85,408 86,215 86,527 82,353 6RA4 65,133 73,603 74,517 75,581 75,909 72,949 3RA5 64,245 73,124 74,144 75,453 76,374 72,668 2RA6 80,586 87,870 88,673 89,468 89,673 87,254 12RA7 64,771 73,229 74,117 75,110 75,468 72,539 1RA8 78,715 86,342 87,195 88,136 88,605 85,799 9RA9 78,715 87,458 88,341 89,244 89,623 86,676 11RA10 79,001 86,627 87,511 88,348 88,461 85,990 10RA11 75,166 82,727 83,578 84,636 85,069 82,235 5RA12 76,470 83,904 84,761 85,768 86,233 83,427 7172
<strong>PacifiCorp</strong> – <strong>2007</strong> IRPChapter 7 – Modeling andTable 7.25 – Cumulative CO 2 Emissions by Cost Adder Level, <strong>2007</strong>-2026Generator CO 2 Emissions, <strong>2007</strong>-2026 (1000 Tons)ID $0 Adder $8 Adder $15 Adder $38 Adder $61 Adder Average RankRA1 1,121,716 1,071,110 1,051,661 1,005,991 983,131 1,046,722 11RA2 1,118,600 1,065,377 1,044,783 996,976 972,473 1,039,642 7RA3 1,100,779 1,050,767 1,0<strong>30</strong>,985 983,391 959,728 1,025,1<strong>30</strong> 3RA4 1,122,432 1,070,823 1,050,931 1,004,604 980,942 1,045,947 10RA5 1,122,352 1,066,931 1,045,768 993,546 966,702 1,039,060 6RA6 1,092,590 1,043,019 1,023,626 977,283 954,462 1,018,196 1RA7 1,098,664 1,045,400 1,024,659 976,320 951,671 1,019,343 2RA8 1,119,654 1,070,775 1,051,835 1,007,310 985,331 1,046,981 12RA9 1,117,852 1,068,445 1,049,168 1,004,509 983,189 1,044,632 8RA10 1,120,216 1,070,065 1,050,497 1,004,820 982,764 1,045,672 9RA11 1,109,142 1,058,370 1,038,568 990,992 967,452 1,032,905 5RA12 1,104,925 1,055,091 1,035,617 989,2<strong>30</strong> 966,425 1,0<strong>30</strong>,258 4CO 2 Emissions from Market Purchases, <strong>2007</strong>-2026 (1000 Tons)ID $0 Adder $8 Adder $15 Adder $38 Adder $61 Adder Average RankRA1 146,689 164,207 170,810 180,598 182,578 168,976 8RA2 134,276 153,061 160,118 170,663 173,411 158,<strong>30</strong>6 2RA3 147,<strong>30</strong>3 175,981 171,287 182,115 184,159 172,169 11RA4 136,267 154,743 161,760 172,140 174,792 159,940 4RA5 133,685 153,044 160,597 172,336 175,981 159,129 3RA6 152,525 169,071 175,514 184,348 187,453 173,782 12RA7 131,<strong>30</strong>7 149,820 156,751 167,235 170,350 155,093 1RA8 149,653 166,984 173,528 182,981 185,322 171,694 10RA9 149,653 165,141 171,773 182,117 185,321 170,801 9RA10 145,724 162,544 169,099 179,515 182,473 167,871 5RA11 145,021 162,764 169,618 180,874 183,689 168,393 6RA12 145,335 163,064 170,005 181,359 183,821 168,717 7173
<strong>PacifiCorp</strong> – <strong>2007</strong> IRPChapter 7 – Modeling andFigure 7.15 – Generator CO 2 Emissions by Cost Adder Level, Cumulative for <strong>2007</strong>-2016Total Cumulative CO2 Emissions from <strong>2007</strong> through 2016540,0005<strong>30</strong>,000520,0001000 Tons510,000500,000490,000480,000470,000460,000450,000$0 Adder$8 Adder$15 Adder$38 Adder$61 Adder440,000RA1 RA2 RA3 RA4 RA5 RA6 RA7 RA8 RA9 RA10 RA11 RA12Figure 7.16 – Generator CO 2 Emissions by Cost Adder Level, Cumulative for <strong>2007</strong>-2026Total Cumulative CO2 Emissions from <strong>2007</strong> through 20261,150,0001,100,0001000 Tons1,050,0001,000,000950,000$0 Adder$8 Adder$15 Adder$38 Adder$61 Adder900,000850,000RA1 RA2 RA3 RA4 RA5 RA6 RA7 RA8 RA9 RA10 RA11 RA12174
<strong>PacifiCorp</strong> – <strong>2007</strong> IRPChapter 7 – Modeling andTable 7.26 – System Generator Emissions Footprint, Cumulative Amount for <strong>2007</strong>–2026SO 2 NO X Hg CO 2 SO 2 NO X Hg CO 21000 Tons 1000 Tons Pounds 1000 Tons 1000 Tons 1000 Tons Pounds 1000 TonsID $0 Adder (2008$) $8 Adder (2008$)RA1 822 1,161 8,340 1,121,716 781 1,099 7,560 1,071,110RA2 814 1,149 8,3<strong>30</strong> 1,118,600 771 1,082 7,860 1,065,377RA3 817 1,156 8,228 1,100,779 775 1,093 8,060 1,050,767RA4 821 1,160 8,354 1,122,432 779 1,095 8,040 1,070,823RA5 796 1,122 8,293 1,122,352 749 1,049 7,953 1,066,931RA6 792 1,132 7,825 1,092,590 751 1,068 7,560 1,043,019RA7 805 1,135 8,228 1,098,664 762 1,068 7,985 1,045,400RA8 827 1,170 8,332 1,119,654 787 1,109 7,936 1,070,775RA9 805 1,138 8,1<strong>30</strong> 1,117,852 764 1,075 7,860 1,068,445RA10 804 1,138 8,140 1,120,216 763 1,074 7,867 1,070,065RA11 805 1,135 8,186 1,109,142 763 1,071 7,909 1,058,370RA12 808 1,143 8,152 1,104,925 767 1,080 7,880 1,055,091SO 2 NO X Hg CO 2 SO 2 NO X Hg CO 21000 Tons 1000 Tons Pounds 1000 Tons 1000 Tons 1000 Tons Pounds 1000 TonsID $15 Adder (2008$) $38 Adder (2008$)RA1 769 1,079 7,962 1,051,661 725 1,011 7,712 1,005,991RA2 758 1,061 7,938 1,044,783 712 990 7,674 996,976RA3 761 1,072 7,853 1,0<strong>30</strong>,985 711 998 7,593 983,391RA4 766 1,075 7,976 1,050,931 722 1,005 7,717 1,004,604RA5 735 1,027 7,890 1,045,768 680 944 7,610 993,546RA6 738 1,047 7,469 1,023,626 693 976 7,195 977,283RA7 749 1,047 7,834 1,024,659 703 975 7,567 976,320RA8 775 1,089 7,967 1,051,835 731 1,021 7,604 1,007,310RA9 752 1,056 7,766 1,049,168 711 990 7,506 1,004,509RA10 751 1,055 7,880 1,050,497 708 987 7,880 1,004,820RA11 750 1,052 7,812 1,038,568 701 979 7,549 990,992RA12 753 1,060 7,785 1,035,617 707 991 7,523 989,2<strong>30</strong>SO 2 NO X Hg CO 21000 Tons 1000 Tons Pounds 1000 TonsID $61 Adder (2008$)RA1 705 975 7,598 983,131RA2 690 952 7,546 972,473RA3 688 961 7,475 959,728RA4 701 968 7,593 980,942RA5 655 901 7,472 966,702RA6 673 942 7,056 954,462RA7 681 938 7,438 951,671RA8 711 987 7,604 985,331RA9 692 958 7,387 983,189175
<strong>PacifiCorp</strong> – <strong>2007</strong> IRPChapter 7 – Modeling andSO 2 NO X Hg CO 21000 Tons 1000 Tons Pounds 1000 TonsID $61 Adder (2008$)RA10 689 953 7,880 982,764RA11 678 943 7,428 967,452RA12 685 957 7,403 966,425Supply ReliabilityEnergy Not ServedFigures 7.17 and 7.18 below show, respectively, the average annual amount of Energy NotServed (ENS) and the upper-tail mean Energy Not Served for the $8 CO 2 adder case, a measureof high-end supply reliability risk. It is clear that the system reliability is generally reduced undera 12% planning reserve margin. Asset-based portfolios tended to have higher reliability thanportfolios that allowed short-term market purchases to meet firm requirements. RA6, which hadno pulverized coal resources, also had a somewhat reduced level of reliability likely due to thecombination of including front office transactions and a higher number of less reliable IGCCunits in the portfolio. From a reliability basis, measured by energy not served, Portfolio RA5 hasthe highest reliability.Figure 7.17 – Stochastic Average Annual Energy Not ServedEnergy Not Served, $8 CO2 Adder CaseAverage Annual Gigawatt-hours for <strong>2007</strong>-2026GWh240220200180160140120100163135150161110170132195218184151182806040200RA1 RA2 RA3 RA4(12%PRM)RA5 RA6 RA7 RA8(12%PRM)RA9(12%PRM)RA10 RA11 RA12(12%PRM)WestEast176
<strong>PacifiCorp</strong> – <strong>2007</strong> IRPChapter 7 – Modeling andFigure 7.18 – Upper-Tail Stochastic Mean Energy Not ServedUpper-Tail Mean Energy Not Served, $8 CO2 Adder CaseAverage Annual Gigawatt-hours for <strong>2007</strong>-2026GWh2,0001,7501,5001,2501,0001,3941,1061,<strong>30</strong>81,3109531,3951,0751,6631,8201,5251,<strong>30</strong>11,5297505002500RA1 RA2 RA3 RA4 RA5 RA6 RA7 RA8 RA9 RA10 RA11 RA12Loss of Load ProbabilityAs discussed in Chapter 6, the Loss of Load Probability (LOLP) parameter is best represented bythe probability of an occurrence of Energy Not Served (ENS). Table 7.27 displays the averageLoss of Load Probability for each of the risk analysis portfolios modeled using the $8 CO 2 addercase. The first block of data is the average LOLP for the first ten years of the study period. Thesecond block of data shows the same information calculated for the entire 20 years. The LOLPvalues in the second block are significantly higher than the first because the variability of therandom draws for the stochastic variable draws increases over time, causing greater extremes inthe out-years of the study period. The data is summarized against multiple levels of lost load,which shows the likelihood of losing various amounts of load in a single event.Table 7.27 – Average Loss of Load Probability During Summer PeakAverage for operating years <strong>2007</strong> through 2016Event Size(MWh) RA1 RA2 RA3 RA4 RA5 RA6 RA7 RA8 RA9 RA10 RA11 RA12> 0 37% 34% 36% 35% 34% 37% 34% 37% 39% 37% 36% 38%> 1,000 <strong>30</strong>% 26% 29% 27% 26% <strong>30</strong>% 26% <strong>30</strong>% 32% <strong>30</strong>% 29% 31%> 10,000 17% 13% 17% 14% 12% 17% 13% 17% 18% 17% 17% 18%> 25,000 13% 10% 13% 11% 8% 13% 10% 13% 14% 13% 12% 14%> 50,000 10% 7% 9% 7% 5% 10% 7% 10% 11% 10% 9% 10%> 100,000 7% 5% 6% 5% 3% 7% 4% 7% 8% 7% 7% 8%> 500,000 1% 0% 1% 0% 0% 1% 0% 1% 1% 1% 1% 1%> 1,000,000 0% 0% 0% 0% 0% 0% 0% 0% 0% 0% 0% 0%177
<strong>PacifiCorp</strong> – <strong>2007</strong> IRPChapter 7 – Modeling andAverage for operating years <strong>2007</strong> through 2026Event Size(MWh) RA1 RA2 RA3 RA4 RA5 RA6 RA7 RA8 RA9 RA10 RA11 RA12> 0 53% 52% 39% 54% 39% 52% 52% 54% 57% 55% 41% 43%> 1,000 44% 44% 33% 45% 33% 44% 43% 46% 49% 47% 35% 37%> 10,000 25% 24% 22% 26% 20% 26% 23% 27% 29% 27% 24% 26%> 25,000 20% 18% 18% 20% 15% 20% 18% 21% 23% 22% 19% 21%> 50,000 16% 14% 15% 15% 11% 16% 14% 17% 19% 18% 15% 17%> 100,000 12% 10% 11% 11% 8% 12% 10% 13% 14% 12% 11% 13%> 500,000 4% 3% 4% 4% 3% 4% 3% 4% 5% 4% 4% 4%> 1,000,000 2% 2% 2% 2% 1% 2% 2% 2% 2% 2% 2% 2%Table 7.28 displays the year-by-year results for the threshold value of 25,000 MWh. (As mentionedin Chapter 6, the 25,000 MWh case was selected as an example to show the annual LOLPas required in the Oregon Commission’s 2004 IRP acknowledgement order.) For each year, theLOLP value represents the proportion of the 100 iterations where the July ENS was greater than25,000 MWhs. This is the equivalent of 2,500 megawatts for 10 hours.Table 7.28 – Year-by-Year Loss of Load Probability(Probability of ENS Event > 25,000 MWh in July)Year RA1 RA2 RA3 RA4 RA5 RA6 RA7 RA8 RA9 RA10 RA11 RA12<strong>2007</strong> 3% 3% 3% 3% 3% 3% 3% 3% 3% 3% 3% 3%2008 4% 4% 4% 4% 4% 4% 4% 4% 4% 4% 4% 4%2009 15% 15% 15% 15% 15% 15% 15% 15% 15% 15% 15% 15%2010 13% 13% 13% 15% 13% 13% 13% 15% 15% 13% 13% 15%2011 17% 17% 17% 17% 17% 17% 17% 17% 17% 17% 17% 17%2012 9% 5% 9% 6% 5% 7% 5% 10% 12% 9% 9% 11%2013 13% 6% 13% 7% 4% 13% 10% 15% 15% 14% 14% 17%2014 14% 6% 17% 8% 3% 17% 6% 14% 15% 16% 15% 15%2015 22% 14% 18% 16% 5% 23% 11% 19% 23% 24% 18% 22%2016 19% 13% 16% 14% 6% 19% 13% 19% 21% 18% 16% 17%2017 24% 23% 23% 22% 12% 29% 22% 23% 21% 21% 24% 25%2018 22% 17% 19% 19% 17% 21% 17% 22% 22% 23% 19% 19%2019 16% 19% 13% 19% 19% 13% 19% 15% 15% 15% 20% 21%2020 23% 22% 18% 23% 21% 15% 22% 22% 23% 23% 22% 23%2021 27% 23% 20% 26% 20% 23% 23% 26% 27% 27% 23% 25%2022 35% 37% 33% 38% 31% 39% 37% 39% 40% 39% 36% 39%2023 24% 23% 23% 28% 19% 27% 23% <strong>30</strong>% <strong>30</strong>% 31% 23% 24%2024 40% 39% 31% 41% 26% 40% 39% 42% 43% 42% <strong>30</strong>% 38%2025 33% <strong>30</strong>% 31% 45% 29% 35% <strong>30</strong>% 46% 47% 43% <strong>30</strong>% 33%2026 31% 31% 31% <strong>30</strong>% 28% 33% 31% 32% 48% 48% 28% 36%178
<strong>PacifiCorp</strong> – <strong>2007</strong> IRPChapter 7 – Modeling andPortfolio <strong>Resource</strong> ConclusionsBased on the stochastic simulation results, the best strategy for achieving a low-cost, riskinformedportfolio for <strong>PacifiCorp</strong>’s customers is to include supercritical pulverized coal alongwith additional wind and natural gas to mitigate CO 2 cost risk. Although eliminating front officetransactions after 2011 was found to be beneficial for reducing risk exposure, it also increasedportfolio cost. On balance, <strong>PacifiCorp</strong> judges this resource type to be beneficial because it increasesplanning flexibility and resource diversity. Consequently, subsequent risk analysis portfoliodevelopment assumes that front office transactions will be available as a model option after2011.RISK ANALYSIS PORTFOLIO DEVELOPMENT – GROUP 2As mentioned above, <strong>PacifiCorp</strong> developed the Group 2 risk analysis portfolios to account forcurrent and expected resource policies in several of its state jurisdictions, and to address the newload forecast (See Chapter 4). Similar to the process used to derive the Group 1 portfolios, theCEM was allowed to optimize investment plans subject to certain resource constraints andstrategies.The CEM optimization process for the Group 2 portfolio was conducted in two phases. The firstphase consisted of a screening test to determine general resource selection patterns under a varietyof planning assumptions, including the new March <strong>2007</strong> load forecast. Model runs for thisphase were based on medium-case scenario conditions, and subject to the following resourceassumptions.Coal <strong>Resource</strong>s● At least two supercritical pulverized coal resources were included in all of the new portfolios.This decision reflects the following findings from the previous portfolio evaluation work:– For Group 1 risk analysis portfolio development, the CEM chose the small Utah resourceand the Wyoming resource for 2012–2014 in all portfolios for which the CEM was allowedto optimize their selection and timing.– The stochastic simulations indicated that removing or deferring these coal resourcesraised both portfolio cost and risk, even under the higher CO 2 adder cases.● The Wyoming supercritical pulverized coal resources were resized from 750 megawatts eachto 527 megawatts. This size change is intended to mitigate the customer rate and carbonfootprint impacts of new coal resources. Also, the large Utah SCPC resource was changedfrom 600 to 575 megawatts. These changes are consistent with the resource sizes assumedfor <strong>PacifiCorp</strong>’s 10-year Business <strong>Plan</strong>. 59● The second Utah and Wyoming supercritical pulverized coal units were removed as resourceoptions for all portfolios.59 Other resource assumption changes made to conform to the <strong>PacifiCorp</strong> Business <strong>Plan</strong> included (1) removing the100 MW Desert Power QF from the load and resource balance due to the project’s owner declaring bankruptcy, and(2) excluding the Blundell expansion project. (<strong>PacifiCorp</strong>’s economic evaluation of the Blundell project found it tonot be cost-effective. This report was filed in all six states in March <strong>2007</strong> to comply with a <strong>PacifiCorp</strong>-MEHC acquisitioncommitment.)179
<strong>PacifiCorp</strong> – <strong>2007</strong> IRPChapter 7 – Modeling and● The west IGCC resources were removed as options for all portfolios. These IGCC units werepatterned after the planned Pacific Mountain Energy Center IGCC project in Kalama,Washington. Reasons for exclusion included (1) regulatory uncertainties regarding siting ofcoal-based generation in Washington, (2) commercial uncertainties regarding capital costs,and (3) the unique project-specific characteristics (such as a proposed fuel supply thatincludes imported petroleum coke) that make it unsuitable as a generic IGCC resource.Wind <strong>Resource</strong>s● <strong>PacifiCorp</strong> developed and applied a new fixed wind investment schedule for all Group 2portfolios except for RA13, consisting of a total of 1,600 megawatts of wind resources beyondthe 400 megawatts already reflected in the load and resource balance. This schedule isbased on acquiring the 1,400 megawatts of wind by 2010 (reflecting an accelerated time tablerelative to the initial investment schedule developed for risk analysis portfolios) and the additional600 megawatts tested as a resource strategy in the Group 1 analysis. Table 7.29 showsthis new wind investment schedule for the 1,600 megawatts of wind, including the associatedcumulative capacity contributions. 60Table 7.29 – Wind <strong>Resource</strong> Additions Schedule for Risk Analysis PortfoliosYearAnnual Additions,NameplateCapacity(MW)LocationCumulativeWind NameplateCapacity(MW)Cumulative WindPeak CapacityContribution(MW)<strong>2007</strong> <strong>30</strong>0 Southeast Washington <strong>30</strong>0 142008 <strong>30</strong>0 Wyoming; Southeast Washington 600 382009 100 North Central Oregon 700 752010 <strong>30</strong>0 Wyoming; North Central Oregon 1,000 1192011 200 Wyoming 1,200 1272012 100 North Central Oregon 1,<strong>30</strong>0 1462013 <strong>30</strong>0 Wyoming 1,600 207● The capacity factor for southeast Wyoming wind resources was increased from 32% to 40%to reflect updated operational expectations for these wind sites.Gas <strong>Resource</strong>s● For initial CEM resource screening analysis, there were no restrictions placed on the type andtiming of gas resources.Front Office Transactions● The model is able to select front office transactions after 2011.Transmission <strong>Resource</strong>s● <strong>PacifiCorp</strong> incorporated the following set of transmission resources in all the Group 2 portfolios:60 The capacity contribution of this new investment schedule is smaller than the contribution for the previous schedule,even though there is more nameplate capacity added. This is due to the relocation of wind projects to areas forwhich incremental additions have less peak-hour load carrying capability.180
<strong>PacifiCorp</strong> – <strong>2007</strong> IRPChapter 7 – Modeling and– Path C Upgrade: Borah to Path-C South to Utah North– Utah - Desert Southwest (Includes Mona - Oquirrh) 61– Mona - Utah North– Craig-Hayden to Park City– Miners - Jim Bridger - Terminal– Jim Bridger - Terminal– Walla Walla - Yakima– West Main - Walla WallaThese resources are supported by previous portfolio analysis, and are consistent with both the<strong>PacifiCorp</strong> 10-year Business <strong>Plan</strong> and MEHC transmission commitments. Additionally, asmentioned in Chapter 2, these transmission resources represent proxies for future transmissionrequirements rather than specific projects.<strong>Plan</strong>ning Reserve Margin● Test portfolios with both a 12% and 15% planning reserve margin.The second CEM portfolio optimization phase consisted of the development of the risk analysisportfolios to be simulated with the PaR module. The results of the CEM screening runs wereused to inform the selection and timing of resources. Based on the resulting fixed generationresource investment schedule for each portfolio, a CEM run determined the front office transactionsneeded to meet the planning reserve margin. (See Figure 6.4 in Chapter 6 for a generic descriptionof this two-stage CEM optimization process.)Alternative <strong>Resource</strong> StrategiesHaving already determined a new wind investment schedule and the coal resources to include inthe Group 2 portfolios, <strong>PacifiCorp</strong> considered a relatively small set of alternative resource strategiesto be evaluated. These strategies focus on the timing of the two supercritical coal resourcesand the mix of gas resources. Specifically, the strategies test (1) whether the new resource assumptionsalter the CEM’s optimal timing for the two supercritical coal plants, (2) reliance ononly combined cycle combustion turbines versus a combination of CCCTs and non-base-load gasresources to meet the latest load growth projections, (3) the timing and type of resources neededto make up for the loss of the BPA peaking contract in August 2011 (i.e., determine the resourceselection impact of removing the contract in 2011 rather than 2012 to ensure that new resourcesare selected to meet load by August 2011), and (4) alternative planning reserve margins—12%and 15%. For the pulverized coal resources, the CEM was allowed to select the small Utah unitfor 2012 or 2013 only, while the Wyoming resource could be acquired in any year after 2013.The major conclusions obtained from the associated CEM screening runs include the following.● Coal resource timing – The Utah small supercritical coal resource was always selected in2012, while the Wyoming supercritical coal resource (527 megawatts) was always selected in2014.● Gas resource mix – When the CEM was allowed to optimize the selection and timing of gasresources, it chose a combination of CCCTs and SCCT frames; the west CCCT was always61 This resource was included in the 10-year <strong>PacifiCorp</strong> Business <strong>Plan</strong>.181
<strong>PacifiCorp</strong> – <strong>2007</strong> IRPChapter 7 – Modeling andselected in 2012. Restricting the model to choose only CCCTs resulted in just one east CCCTselected in 2012. (This is in addition to the west CCCT selected in 2012.)● Timing of resource acquisition to address expiration of the BPA peak contract – Removingthe BPA contract in 2011 (as opposed to 2012) had no effect on the timing of thewest CCCT assuming unlimited availability of front office transactions in 2011.● Alternative planning reserve margins – Under a 12% planning reserve margin, allowingthe model to choose its own gas resources resulted in two SCCT frames selected in 2012 –one in the east and one in the west; this is in addition to the west CCCT selected in 2012.Under a 15% planning reserve margin with no gas resource option restrictions, the CEMportfolio solution included about 200 megawatts of additional gas resources by 2016; eastSCCT frames were selected in 2010 and 2012 in addition to an east CCCT in 2012.Based on these results, <strong>PacifiCorp</strong> developed five portfolios for stochastic simulation. Theseportfolios are intended to compare CCCTs against reliance on the market to meet new forecastedloads under alternative planning reserve margin targets (12% and 15%). Combined cycle plantswere chosen as the proxy gas-fired resource type for two reasons. First, the PaR stochastic simulationcaptures extrinsic (or optionality) value of a resource, while the CEM does not. A CCCT isexpected to have a lower PVRR impact than a non-base-load gas resource with all else held constant.Second, the larger CCCT minimizes the number of gas resources added in a single year.In addition, all five risk analysis portfolios have a west CCCT added in 2011 to ensure that aresource is available to meet west-side load by August 2011. Finally, the amount of annual frontoffice transactions needed to balance the system is determined by CEM; no caps are placed onthe resources.Table 7.<strong>30</strong> outlines the specifications for the five risk analysis portfolios (labeled RA13 throughRA17), and presents the design rationale and common features for each.Table 7.<strong>30</strong> – Risk Analysis Portfolio Descriptions (Group 2)ID Description Design Rationale FeaturesRA13 An updated “Base Case”resource proposal that mirrorsthe original <strong>PacifiCorp</strong>Business <strong>Plan</strong>’s base loadThis portfolio serves as thereference portfolio forcomparison with the otherrisk analysis portfolios. It• Based on the revised load forecast(March <strong>2007</strong>)• Wind investment schedule assumedfor original Business <strong>Plan</strong>resources. This portfolio, based reflects a coal- and• All portfolios use the sameon a 12% planning reserve market- intensive resource transmission investment schedulemargin, includes fourstrategy.supercritical pulverized coalresources: the small UtahSCPC (2012), the WyomingSCPC (2014), the large UtahSCPC (2017), and the secondWyoming SCPC (2018).182
<strong>PacifiCorp</strong> – <strong>2007</strong> IRPChapter 7 – Modeling andID Description Design Rationale FeaturesRA14 This portfolio addresses thehigher east load forecast byadding two east CCCTs: one in2012 (2x1 F type) and one in2016 (1x1 G type).Tests the strategy ofmeeting east load growthwith CCCTs as opposed tothe market.RA15RA16RA17This portfolio addresses therevised east load forecast byadding just one east CCCT in2012. A 12% planning reservemargin is met with front officetransactions.RA14 based on a 15% planningreserve margin; the higherreserve margin is met withCCCT capacity and front officetransactionsThis portfolio addresses therevised load forecast by relyingon front office transactionsonly.Tests the strategy ofmeeting east load growthwith a mix of CCCTcapacity and the market.Tests the consequences ofmeeting the higherplanning reserve marginwith market resources.Tests the strategy of usingmarket purchases to meetthe increased forecastedload.• Based on the revised load forecast(March <strong>2007</strong>)• Small Utah SCPC plant acquired in2012• Wyoming SCPC acquired in 2014• West CCCT acquired in 2011• Revised wind investment schedule(1,400 MW by 2010; 600 MW by2013 – Total of 2,000 MW by 2013)• All portfolios use the sametransmission investment schedule• 12% <strong>Plan</strong>ning reserve margin exceptRA16Tables 7.31 through 7.35 present the detailed supply- and demand-side investment schedules foreach portfolio. Table 7.36 provides the common transmission investment schedule for all theGroup 2 portfolios.Table 7.31 – <strong>Resource</strong> Investment Schedule for Portfolio RA13Nameplate Capacity, MW<strong>Resource</strong> Type <strong>2007</strong> 2008 2009 2010 2011 2012 2013 2014 2015 2016 2017 2018E Utah pulverized coal Supercritical 340A Wyoming pulverized coal Supercritical 527S Utah pulverized coal Supercritical 575T Wyoming pulverized coal Supercritical 527Combined cycle CT 2x1 F class with duct firingCombined cycle CT 1x1 G class with duct firingCombined Heat and Power Generic east-wide 25Renewable Wind, Wyoming and Idaho 100 200 100 200 100 100Class 1 DSM* Load control, Sch. irrigation 26 25 18WESTFront office transactions** Heavy Load Hour, 3rd Qtr - - - 451 550 281 281 911 1,054 ,209 1,121 811Combined cycle CT 2x1 F Type with duct firingCombined Heat and Power Generic west-wide 75RenewableWind, SE WashingtonRenewable Wind, NC Oregon 200Class 1 DSM* Sch. irrigation 12 11 12Front office transactions** Flat annual product - - - 134 222 1,<strong>30</strong>0 1,350 513 413 551 663 840Annual Additions, Long Term <strong>Resource</strong>s <strong>30</strong>0 200 - 112 237 577 118 527 - - 575 527Annual Additions, Short Term <strong>Resource</strong>s - - - 585 772 1,581 1,631 1,424 1,467 1,760 1,784 1,651Total Annual Additions <strong>30</strong>0 200 0 697 1,009 2,158 1,749 1,951 1,467 1,760 2,359 2,178* DSM is scaled up by 10% to account for avoided line losses.** Front office transaction amounts reflect purchases made for the year, and are not additive.183
<strong>PacifiCorp</strong> – <strong>2007</strong> IRPChapter 7 – Modeling andTable 7.32 – <strong>Resource</strong> Investment Schedule for Portfolio RA14Nameplate Capacity, MW<strong>Resource</strong> Type <strong>2007</strong> 2008 2009 2010 2011 2012 2013 2014 2015 2016East Utah pulverized coal Supercritical 340Wyoming pulverized coal Supercritical 527Combined cycle CT 2x1 F class with duct firing 548Combined cycle CT 1x1 G class with duct firing 357Combined Heat and Power Generic east-wide 25Renewable Wind, Wyoming 200 200 200 <strong>30</strong>0Class 1 DSM* Load control, Sch. irrigation 26 25 18Front office transactions** Heavy Load Hour, 3rd Qtr - - - 393 272 97 3 149 192 165West CCCT 2x1 F Type with duct firing 602Combined Heat and Power Generic west-wide 75Renewable Wind, SE Washington <strong>30</strong>0 100Renewable Wind, NC Oregon 100 100 100Class 1 DSM* Load control, Sch. irrigation 12 11 12Front office transactions** Flat annual product - - - 219 64 555 657 247 246 249Annual Additions, Long Term <strong>Resource</strong>s <strong>30</strong>0 <strong>30</strong>0 100 312 839 1,125 318 527 - 357Annual Additions, Short Term <strong>Resource</strong>s - - - 612 336 652 660 396 438 414Total Annual Additions <strong>30</strong>0 <strong>30</strong>0 100 924 1,175 1,777 978 923 438 771* DSM is scaled up by 10% to account for avoided line losses.** Front office transaction amounts reflect purchases made for the year, and are not additive.Table 7.33 – <strong>Resource</strong> Investment Schedule for Portfolio RA15EastNameplate Capacity, MW<strong>Resource</strong> Type <strong>2007</strong> 2008 2009 2010 2011 2012 2013 2014 2015 2016Utah pulverized coal Supercritical 340Wyoming pulverized coal Supercritical 527Combined cycle CT 2x1 F class with duct firing 548Combined cycle CT 1x1 G class with duct firingCombined Heat and Power Generic east-wide 25Renewable Wind, Wyoming 200 200 200 <strong>30</strong>0Class 1 DSM* Load control, Sch. irrigation 26 25 18Front office transactions** Heavy Load Hour, 3rd Qtr - - - 393 272 97 3 149 192 349West Combined cycle CT 2x1 F Type with duct firing 602Combined Heat and Power Generic west-wide 75Renewable Wind, SE Washington <strong>30</strong>0 100Renewable Wind, NC Oregon 100 100 100Class 1 DSM* Load control, Sch. irrigation 12 11 12Front office transactions** Flat annual product - - - 219 64 555 657 247 246 384Annual Additions, Long Term <strong>Resource</strong>s <strong>30</strong>0 <strong>30</strong>0 100 312 839 1,125 318 527 - -Annual Additions, Short Term <strong>Resource</strong>s - - - 612 336 652 660 396 438 733Total Annual Additions <strong>30</strong>0 <strong>30</strong>0 100 924 1,175 1,777 978 923 438 733* DSM is scaled up by 10% to account for avoided line losses.** Front office transaction amounts reflect purchases made for the year, and are not additive.184
<strong>PacifiCorp</strong> – <strong>2007</strong> IRPChapter 7 – Modeling andTable 7.34 – <strong>Resource</strong> Investment Schedule for Portfolio RA16Nameplate Capacity, MW<strong>Resource</strong> Type <strong>2007</strong> 2008 2009 2010 2011 2012 2013 2014 2015 2016East Utah pulverized coal Supercritical 340Wyoming pulverized coal Supercritical 527Combined cycle CT 2x1 F class with duct firing 548Combined cycle CT 2x1 F class with duct firing 548Combined cycle CT 1x1 G class with duct firingCombined Heat and Power Generic east-wide 25Renewable Wind, Wyoming 200 200 200 <strong>30</strong>0Class 1 DSM* Load control, Sch. irrigation 26 25 18Front office transactions** Heavy Load Hour, 3rd Qtr - 108 111 553 103 73 - - - 272West Combined cycle CT 2x1 F Type with duct firing 602Combined Heat and Power Generic west-wide 75Renewable Wind, SE Washington <strong>30</strong>0 100Renewable Wind, NC Oregon 100 100 100Class 1 DSM* Load control, Sch. irrigation 12 11 12Front office transactions** Flat annual product - - - 289 - 366 533 261 260 263Annual Additions, Long Term <strong>Resource</strong>s <strong>30</strong>0 <strong>30</strong>0 100 312 1,387 1,125 318 527 - -Annual Additions, Short Term <strong>Resource</strong>s - 108 111 842 103 439 533 261 260 535Total Annual Additions <strong>30</strong>0 408 211 1,154 1,490 1,564 851 788 260 535* DSM is scaled up by 10% to account for avoided line losses.** Front office transaction amounts reflect purchases made for the year, and are not additive.Table 7.35 – <strong>Resource</strong> Investment Schedule for Portfolio RA17Nameplate Capacity, MW<strong>Resource</strong> Type <strong>2007</strong> 2008 2009 2010 2011 2012 2013 2014 2015 2016East Utah pulverized coal Supercritical 340Wyoming pulverized coal Supercritical 527Combined cycle CT 2x1 F class with duct firingCombined cycle CT 1x1 G class with duct firingCombined Heat and Power Generic east-wide 25Renewable Wind, Wyoming 200 200 200 <strong>30</strong>0Class 1 DSM* Load control, Sch. irrigation 26 25 18Front office transactions** Heavy Load Hour, 3rd Qtr - - - 393 272 281 255 394 616 706West Combined cycle CT 2x1 F Type with duct firing 602Combined Heat and Power Generic west-wide 75Renewable Wind, SE Washington <strong>30</strong>0 100Renewable Wind, NC Oregon 100 100 100Class 1 DSM* Load control, Sch. irrigation 12 11 12Front office transactions** Flat annual product - - - 219 64 861 894 492 312 517Annual Additions, Long Term <strong>Resource</strong>s <strong>30</strong>0 <strong>30</strong>0 100 312 839 577 318 527 - -Annual Additions, Short Term <strong>Resource</strong>s - - - 612 336 1,142 1,149 886 928 1,223Total Annual Additions <strong>30</strong>0 <strong>30</strong>0 100 924 1,175 1,719 1,467 1,413 928 1,223* DSM is scaled up by 10% to account for avoided line losses.** Front office transaction amounts reflect purchases made for the year, and are not additive.185
<strong>PacifiCorp</strong> – <strong>2007</strong> IRPChapter 7 – Modeling andTable 7.36 – Transmission <strong>Resource</strong> Investment Schedule for All Group 2 PortfoliosTransfer Capability, Megawatts<strong>Resource</strong> <strong>2007</strong> 2008 2009 2010 2011 2012 2013 2014 2015 2016East Path C Upgrade: Borah to Path-C South to Utah North <strong>30</strong>0Utah - Desert Southwest (Includes Mona - Oquirrh) 600Mona - Utah North 400Craig-Hayden to Park City 176Miners - Jim Bridger - Terminal 600Jim Bridger - Terminal 500West Walla Walla - Yakima 400West Main - Walla Walla 6<strong>30</strong>Total Annual Additions - - - 700 6<strong>30</strong> 1,776 - 500 - -STOCHASTIC SIMULATION RESULTSThe five Group 2 risk analysis portfolios were run in stochastic simulation mode to determinecost, risk, reliability, and emission performance results. The tables and charts below show howthe portfolios compare to one another on the basis of these results.Stochastic Mean CostTable 7.37 compares the stochastic mean PVRR for each portfolio across the CO 2 adder cases, aswell as by CO 2 compliance strategy (per-ton CO 2 tax and cap-and-trade). Portfolio RA14 (twoeast CCCTs) has the lowest stochastic cost at each adder level. RA17 (no east CCCTs) has thehighest cost under the $0, $8, $15, and $38 adder levels, while RA13 has the highest cost underthe $61 adder. The average cost deviation among the portfolios is about $200 million for the $0adder case, and increases to over $600 million at the $61 adder level.Table 7.37 – Stochastic Mean PVRR by CO 2 Adder CaseTax Strategy (Million $)$0 Adder $8 Adder $15 Adder $38 Adder $61 AdderID (2008$) (2008$) (2008$) (2008$) (2008$) Average RankRA13 22,917 26,9<strong>30</strong> 29,002 36,161 43,368 31,676 5RA14 22,570 26,478 28,401 35,008 41,634 <strong>30</strong>,818 1RA15 22,631 26,551 28,482 35,139 41,820 <strong>30</strong>,925 3RA16 22,645 26,544 28,454 35,021 41,854 <strong>30</strong>,850 2RA17 22,737 26,669 28,616 35,351 42,137 31,102 4Cap & Trade (Million $)$0 Adder $8 Adder $15 Adder $38 Adder $61 AdderID (2008$) (2008$) (2008$) (2008$) (2008$) Average RankRA13 21,606 22,010 22,282 22,673 22,716 22,257 5RA14 21,260 21,559 21,682 21,521 20,983 21,401 1RA15 21,322 21,632 21,763 21,652 21,168 21,507 3RA16 21,336 21,625 21,736 21,534 20,933 21,433 2RA17 21,427 21,750 21,897 21,864 21,486 21,685 4186
<strong>PacifiCorp</strong> – <strong>2007</strong> IRPChapter 7 – Modeling andCustomer Rate ImpactThe portfolio customer rate impact results for each CO 2 cost adder level are reported in Figure7.19, and are based on a CO 2 cap-and-trade compliance strategy. Portfolio RA14 has the smallestimpact across all the CO 2 adder levels. The difference between the lowest and highest impact(RA13) under the $0 adder case is $0.12/MWh, and increases to $0.40/MWh for the $61 addercase.Figure 7.19 – Customer Rate ImpactIncremental Customer Rate Impact for new <strong>Resource</strong> AdditionsLevelized Net Present Value from 2008 to 2026$3.75$3.50$/MWh$3.25$3.00$2.75$2.50RA13 RA14 RA15 RA16 RA17$0 CO2 $8 CO2 $15 CO2 $38 CO2 $61 CO2Emissions Externality CostFor the Group 2 portfolios, <strong>PacifiCorp</strong> estimated the emissions externality cost given two regulatorystrategies: cap-and-trade and a per-ton tax. For the tax strategy, each ton of emissions(pounds in the case of mercury) is assessed an emissions tax equivalent to the cost adder value.Table 7.38 shows the externality cost for each portfolio by CO 2 adder level and regulation type.Note that the portfolio rankings, based on the average externality cost across the CO 2 addercases, did not change from one regulatory strategy to other.Portfolio RA16 had the lowest externality cost, followed closely by RA14. In contrast, RA13 hadthe highest externality cost due to the two additional coal plants not included in the other portfolios.Nevertheless, the externality cost for RA13 under the tax basis is only six percent higherthan that for the best-performing portfolio, RA16. Of note is that under the cap-and-tradescheme, RA14 and RA16 have a negative externality cost under the $61 adder. This result is a187
<strong>PacifiCorp</strong> – <strong>2007</strong> IRPChapter 7 – Modeling andconsequence of large positive annual allowance balances that have accrued for part of the studyperiod as a result of the cap-and-trade modeling assumptions. Future modeling work is expectedto focus on alternative specifications for CO 2 compliance strategies.Table 7.38 – Portfolio Emissions Externality Cost by CO 2 Adder Level and RegulationTypeIncremental Stochastic Mean PVRR by CO 2 Adder (Tax Strategy), Million $CO 2 Adder Level (2008$)ID $0 $8 $15 $38 $61 Average RankRA13 - 4,013 6,085 13,244 20,451 10,948 5RA14 - 3,908 5,831 12,438 19,064 10,310 2RA15 - 3,920 5,850 12,507 19,188 10,366 3RA16 - 3,898 5,809 12,376 18,939 10,255 1RA17 - 3,933 5,879 12,614 19,400 10,457 4Incremental Stochastic Mean PVRR by CO 2 Adder (Cap and Trade Strategy), Million $CO 2 Adder Level (2008$)ID $0 $8 $15 $38 $61 Average RankRA13 - 404 676 1,067 1,110 814 5RA14 - 298 421 261 (278) 176 2RA15 - 310 441 3<strong>30</strong> (154) 232 3RA16 - 289 399 198 (403) 121 1RA17 - 323 470 437 59 322 4Capital CostFigure 7.20 shows the total capital cost for each portfolio, expressed on a net present value of thesum of all capital costs accrued for <strong>2007</strong>–2026. Portfolios RA14 and RA16 have the highestcapital cost on account of the three CCCT resources acquired in the 2012-2016 timeframe. RA13has the lowest capital cost—despite four coal plants—because of the lack of the east CCCT in2011 and the accelerated wind investment schedule, as well as the cost discount impact of twocoal resources acquired beyond 2016.188
<strong>PacifiCorp</strong> – <strong>2007</strong> IRPChapter 7 – Modeling andPortfolio Construction Cost Risk<strong>PacifiCorp</strong> calculated a measure of portfolio construction cost risk using its “high case” per-kilowatt capital costvalues. (These values are reported in Chapter 5, Tables 5.1 and 5.2.) The high capital cost ($/kW) estimates arecomprised of a standard project construction cost contingency (10%), as well as technology-specific contingenciesand “optimism” factors for first-of-a-kind technologies that account for the established tendency to underestimateactual costs (applicable to IGCC). The source for the technology cost contingency and optimism factors isthe U.S. Energy Information Administration (Assumptions to the Annual Energy Outlook 2006, DOE/EIA-0554(2006), March 2006).The risk value for each portfolio is the difference between the PVRR calculated with the high per-kW capitalcost and the PVRR calculated with the average per-kW capital cost. The table shows the results for the 17 riskanalysis portfolios. Portfolio RA9 had the lowest construction cost risk, while RA5 had the highest. AlthoughRA9 includes the more expensive IGCC plants (on a per-kW basis), the smaller capacity sizes of these units,combined with deferral and removal of the supercritical pulverized coal plants, results in a lower overall capitalcost.Construction Cost RiskBased on "high case" per-kW <strong>Resource</strong> Capital CostMillion $600500400<strong>30</strong>02001000Figure 7.20 – Total Capital Cost by PortfolioRA1RA2RA3RA4RA5RA6RA7RA8RA9RA10RA11Generation and Transmission Capital Cost, Net Present ValueRA12RA13RA14RA15RA16RA17$5.80$5.60$5.40$5.205.435.365.605.21Billion $$5.00$4.80$4.60$4.40$4.20$4.004.85RA13 RA14 RA15 RA16 (15% PRM) RA17189
<strong>PacifiCorp</strong> – <strong>2007</strong> IRPChapter 7 – Modeling andStochastic Risk MeasuresTable 7.39 reports the portfolio stochastic risk results for each of the CO 2 adder cases. Risk exposure,production cost standard deviation, fifth-percentile PVRR, ninety-fifth-percentile PVRR,and upper-tail PVRR are presented for the cap-and-trade compliance strategy. (Note that relativerisk measure rankings are the same under both CO 2 emissions compliance strategies.)Portfolio RA13, with four pulverized coal plants, performed the best overall on the risk measures,followed by RA16 with its two east CCCT resources and 15% planning reserve margin. Asexpected, RA17 has the highest risk due to its heavy reliance on the market. Interestingly, RA14performed the best on the basis of the 5 th percentile measure, indicating that it could be a goodperformer under a confluence of low-cost conditions.Table 7.39 – Stochastic Risk ResultsRisk Exposure(Upper-Tail PVRR minusMean PVRR)StandardDeviation5thPercentile95thPercentileUpper-Tail MeanID Million $ Rank$0 Adder (2008$)RA13 43,703 2 12,020 13,628 36,692 65,<strong>30</strong>9RA14 44,056 3 12,094 13,584 35,315 65,316RA15 44,718 4 12,296 13,518 35,918 66,040RA16 43,638 1 11,987 13,732 35,196 64,974RA17 45,339 5 12,460 13,464 36,198 66,766$8 Adder (2008$)RA13 46,984 1 13,016 11,846 38,652 68,994RA14 47,523 3 13,134 11,620 37,066 69,082RA15 48,198 4 13,339 11,576 37,665 69,8<strong>30</strong>RA16 47,128 2 13,034 11,693 36,970 68,753RA17 48,812 5 13,501 11,661 37,935 70,562$15 Adder (2008$)RA13 48,668 1 13,556 10,987 39,736 70,950RA14 49,195 3 13,666 10,725 38,038 70,977RA15 49,863 4 13,868 10,695 38,629 71,626RA16 48,775 2 13,560 10,840 37,933 70,510RA17 50,501 5 14,036 11,903 38,907 72,398$38 Adder (2008$)RA13 55,855 2 15,852 9,908 43,993 43,993RA14 56,258 3 15,927 8,226 41,426 41,426RA15 56,971 4 16,136 8,223 42,019 42,019RA16 55,835 1 15,827 8,264 41,311 41,311RA17 57,704 5 16,322 8,357 42,326 42,326$61 Adder (2008$)RA13 64,344 2 18,544 6,740 48,252 87,060RA14 64,614 3 18,584 4,562 44,875 85,596RA15 65,396 4 18,805 4,728 45,468 86,564RA16 64,159 1 18,482 4,481 44,719 85,093190
<strong>PacifiCorp</strong> – <strong>2007</strong> IRPChapter 7 – Modeling andRisk Exposure(Upper-Tail PVRR minusMean PVRR)StandardDeviation5thPercentile95thPercentileUpper-Tail MeanID Million $ RankRA17 66,238 5 19,010 5,611 45,870 87,724Average across Adder CasesRA13 51,911 2 14,598 10,622 41,465 74,168RA14 52,329 3 14,681 9,743 39,344 73,7<strong>30</strong>RA15 53,029 4 14,889 9,748 39,940 74,537RA16 51,907 1 14,578 9,802 39,226 73,340RA17 53,719 5 15,066 9,999 40,247 75,403Cost/Risk Tradeoff AnalysisThe three figures below are scatter plots of portfolio cost (PVRR) and risk exposure. Figure 7.21plots the average PVRR and risk exposure across the CO 2 adder cases. Figures 7.22 and 7.23show the cost-risk relationship for the $0 CO 2 adder case and the $61 CO 2 adder case, respectively.The figures indicate that RA14 has the best balance of cost and risk on an average basis acrossthe five CO 2 adder cases, as well as for adders greater than $0. Portfolio RA17 fares relativelypoorly, having both a higher cost and risk than the other portfolios.Figure 7.21 – Average Stochastic Cost versus Risk ExposureAverage Across All CO2 Adder CasesCO2 Cap and Trade BasisRisk Exposure: Upper-Tail Stochastic Meanminus Overall Mean PVRR (Billion $)54.0053.0052.0051.00RA17RA15RA14RA16RA1321.2 21.6 22.0 22.4 22.8 23.2Stochastic Mean PVRR (Billion $)191
<strong>PacifiCorp</strong> – <strong>2007</strong> IRPChapter 7 – Modeling andFigure 7.22 – Stochastic Cost versus Risk Exposure for the $0 CO 2 Adder Case$0 CO2 Adder CaseCO2 Cap and Trade Basis46.00Risk Exposure: Upper-Tail Stochastic Mean minusOverall Mean PVRR (Billion $)45.0044.00RA17RA15RA14RA16RA1343.0020.8 21.2 21.6 22.0 22.4 22.8Stochastic Mean PVRR (Billion $)Figure 7.23 – Stochastic Cost versus Risk Exposure for the $61 CO 2 Adder Case$61 CO2 Adder CaseCO2 Cap and Trade Basis67.00Risk Exposure: Upper-Tail Stochastic Meanminus Overall Mean PVRR (Billion $)66.0065.00RA14RA16RA15RA17RA1364.0020.8 21.2 21.6 22.0 22.4 22.8 23.2Stochastic Mean PVRR (Billion $)192
<strong>PacifiCorp</strong> – <strong>2007</strong> IRPChapter 7 – Modeling andCarbon Dioxide and Other EmissionsTable 7.40 reports for the portfolios the total system CO 2 emissions for the $8 adder and $61adder cases. Total emissions are presented as the contribution from direct sources (generators)plus indirect emissions from purchases less emissions attributed to wholesale sales 62 , and arereported for <strong>2007</strong>-to-2016 and <strong>2007</strong>-to-2026. Portfolio RA16 has the lowest CO 2 emissions forboth CO 2 adder levels, followed closely by RA14. For RA16, the early addition of a CCCT displacesfront office transactions, which have a slightly higher CO 2 emission rate than a CCCT.Portfolio RA13 has the highest CO 2 emissions because of the additional two coal plants.CO 2 Adder Breakeven Analysis for Coal versus Gas Combined Cycle<strong>PacifiCorp</strong> conducted a study to determine the CO 2 adder level that causes the CEM to select a combined cyclecombustion turbine over a supercritical pulverized coal plant. The model was executed at various CO 2 addersbetween $8/ton and $40/ton (in 2008 dollars) to converge on the breakeven point. The study was performed on aportfolio that had the 600 megawatts of extra wind and a Wyoming supercritical pulverized coal acquired in2016. The simulations were designed to hold all influences constant except for the substitution of one coal plantwith a CCCT. Study assumptions included the following:• The pulverized coal and CCCT test resources were both sized at 575 megawatts• The two resources were located in the same topology bubble (Utah South)• The CEM was required to select either the coal or CCCT resource in 2016, but not both (mutually exclusiveoptions)• Each simulation used a set of forward natural gas and wholesale electricity prices that were adjusted to accountfor the effect of the CO 2 adder level testedThe breakeven CO 2 adder level was found to be $38/ton; up to this level, the CEM selected the coal plant ratherthan the CCCT. Over the range of CO 2 adders tested, a $1/ton increase in the adder translated into an average$373 million increase in deterministic Present Value of Revenue Requirements. (Note that the CEM treats thecost adder as an emissions tax.)Table 7.40 – CO 2 Emissions by Adder Case and Time Period (1,000 Tons)Direct(Generationonly)$8 CO 2 Adder Case<strong>2007</strong> to 2016 <strong>2007</strong> to 2026Total Directand NetIndirectRank(Total Directand NetIndirect)Direct(Generationonly)Total Directand NetIndirectRank(TotalDirect andNetIndirect)ScenarioIDRA13 493,664 523,812 5 1,064,261 1,127,571 5RA14 495,099 507,807 2 1,019,946 1,064,710 2RA15 495,040 508,332 3 1,021,983 1,068,540 3RA16 493,225 503,148 1 1,017,187 1,057,885 1RA17 495,186 512,737 4 1,023,767 1,075,848 462 Emissions imputed to purchases are based on a survey of 2005 <strong>PacifiCorp</strong> historical purchases, at 0.565 tons CO 2 /MWh. Emissions imputed to sales are based on a year-by-year system weighted average rate: Thermal plus PurchasesCO2 (tons)/Total System Generation (MWh).193
<strong>PacifiCorp</strong> – <strong>2007</strong> IRPChapter 7 – Modeling andDirect(Generationonly)$61 CO 2 Adder Case<strong>2007</strong> to 2016 <strong>2007</strong> to 2026Total Directand NetIndirectRank(Total Directand NetIndirect)Direct(Generationonly)Rank(TotalDirect andNetIndirect)ScenarioIDTotal Directand IndirectRA13 478,176 515,380 5 972,566 1,085,311 5RA14 476,743 496,788 2 922,926 1,016,625 2RA15 477,038 497,663 3 926,375 1,022,002 3RA16 474,074 491,563 1 918,006 1,008,456 1RA17 478,560 503,290 4 931,329 1,031,967 4Figures 7.24 and 7.25 show the annual CO 2 emissions trend from <strong>2007</strong> through 2026 for the $8and $61 CO 2 adder cases, respectively. The impact of the wind and CCCT additions is evidentfrom the emissions drop from 2011 through 2012 for portfolios RA14, RA15, and RA16. Theincreasing annual emissions after this point are attributable to the addition of the Wyoming supercriticalpulverized coal resource in 2014 and an increase in front office transactions. The significantemissions drop in 2019 for all the portfolios is caused by the addition of CCCT-basedgrowth stations, which replace the acquisition of front office transactions.For the $61 adder case, the large CO 2 emission decreases in 2013 through 2015 are due to thephasing in of the adder, which starts in 2010 but ramps up significantly in 2014 and 2015.Figure 7.24 – Annual CO 2 Emission Trends, <strong>2007</strong>-2026, ($8 CO 2 Adder Case)(Generation plus the net indirect effect of wholesale purchases and sales)65,000$8/Ton CO 2 adder has a phase-inperiod from 2010-201260,00055,000(Tons 000)50,00045,00040,000<strong>2007</strong> 2008 2009 2010 2011 2012 2013 2014 2015 2016 2017 2018 2019 2020 2021 2022 2023 2024 2025 2026RA13 RA14 RA15 RA16 RA17194
<strong>PacifiCorp</strong> – <strong>2007</strong> IRPChapter 7 – Modeling andFigure 7.25 – Annual CO 2 Emission Trends, <strong>2007</strong>-2026, ($61 CO 2 Adder Case)(Generation plus the net indirect effect of wholesale purchases and sales)65,000$61/Ton CO 2 adder has a phase-inperiod from 2010-201660,000(Tons 000)55,00050,00045,00040,000<strong>2007</strong> 2008 2009 2010 2011 2012 2013 2014 2015 2016 2017 2018 2019 2020 2021 2022 2023 2024 2025 2026RA13 RA14 RA15 RA16 RA17Figures 7.26 through 7.29 show the annual system CO 2 emissions trends (generation plus net purchases)for <strong>2007</strong> through 2016 by CO 2 adder case, as well as the contributions from generatorsonly.Figure 7.26 – Annual CO 2 Emissions Trends, <strong>2007</strong>-2016 ($8 CO 2 Adder Case)(From generation only)55,00053,00051,000$8 CO2 adder starts in 2010 and phasesin through 201249,00047,000(Tons 000)45,00043,00041,00039,00037,00035,000<strong>2007</strong> 2008 2009 2010 2011 2012 2013 2014 2015 2016RRP01 RRP06 RRP05 RRP07 RRP02195
<strong>PacifiCorp</strong> – <strong>2007</strong> IRPChapter 7 – Modeling andFigure 7.27 – Annual CO 2 Emissions Trends, <strong>2007</strong>-2016 ($61 CO 2 Adder Case)(From generation only)55,00053,00051,000$61 CO 2 adder starts in 2010 and phasesin through 201649,00047,000(Tons 000)45,00043,00041,00039,00037,00035,000<strong>2007</strong> 2008 2009 2010 2011 2012 2013 2014 2015 2016RRP01 RRP06 RRP05 RRP07 RRP02Figure 7.28 – Annual CO 2 Emissions Trends, <strong>2007</strong>-2016 ($8 CO 2 Adder Case)(Generation plus the net indirect effect of wholesale purchases and sales)60,000$8/Ton CO 2 adder has a phase-inperiod from 2010-201255,000(Tons 000)50,00045,00040,000<strong>2007</strong> 2008 2009 2010 2011 2012 2013 2014 2015 2016RA13 RA14 RA15 RA16 RA17196
<strong>PacifiCorp</strong> – <strong>2007</strong> IRPChapter 7 – Modeling andFigure 7.29 – Annual CO 2 Emissions Trends, <strong>2007</strong>-2016 ($61 CO 2 Adder Case)(Generation plus the net indirect effect of wholesale purchases and sales)60,000$61/Ton CO 2 adder has a phase-inperiod from 2010-201655,000(Tons 000)50,00045,00040,000<strong>2007</strong> 2008 2009 2010 2011 2012 2013 2014 2015 2016RA13 RA14 RA15 RA16 RA17Table 7.41 shows the total portfolio emissions of SO 2 , NO X , mercury, and CO 2 from generatorsonly, by CO 2 adder case, for <strong>2007</strong> through 2026. Portfolio RA16 performed the best across theemission types for most of the CO 2 adder cases. RA2 performed nearly as well, coming in secondplace on SO 2 , NO X , and mercury emissions for all CO 2 adders except the $61 case.Table 7.41 – Total Emissions Footprint by CO 2 Adder Case(From system generation for <strong>2007</strong>-2026)Emission Type and UnitsSO 2 NO X Hg CO 2ID 1000 Tons 1000 Tons Pounds 1000 Tons$0 CO 2 Adder CaseRA13 844 1,196 8,325 1,118,625RA14 811 1,157 8,048 1,077,417RA15 814 1,162 8,053 1,079,015RA16 805 1,148 8,035 1,076,347RA17 820 1,170 8,056 1,079,240$8 CO 2 Adder CaseRA13 803 1,132 8,022 1,064,261RA14 766 1,088 7,729 1,019,946RA15 770 1,094 7,735 1,021,983RA16 759 1,077 7,742 1,017,187RA17 777 1,104 7,745 1,023,767$15 CO 2 Adder Case197
<strong>PacifiCorp</strong> – <strong>2007</strong> IRPChapter 7 – Modeling andEmission Type and UnitsSO 2 NO X Hg CO 2ID 1000 Tons 1000 Tons Pounds 1000 TonsRA13 790 1,111 7,913 1,043,467RA14 750 1,063 7,615 998,044RA15 754 1,070 7,623 1,000,419RA16 742 1,052 7,590 994,806RA17 762 1,081 7,635 1,002,900$38 CO 2 Adder CaseRA13 751 1,047 7,651 996,446RA14 708 999 7,335 948,247RA15 712 1,007 7,347 951,276RA16 699 986 7,<strong>30</strong>6 944,095RA17 722 1,020 7,367 955,222$61 CO 2 Adder CaseRA13 7<strong>30</strong> 1,011 7,529 972,566RA14 686 964 7,195 922,926RA15 691 972 7,210 926,375RA16 677 950 7,163 918,006RA17 702 987 7,236 931,329Supply ReliabilityEnergy Not Served (ENS)Figures 7.<strong>30</strong> and 7.31 show the average annual ENS and upper-tail ENS by portfolio for <strong>2007</strong>–2026, respectively. RA16 has the smallest ENS amount at 135 gigawatt hours, followed byRA14. Portfolios RA13 and RA17 have the highest ENS due to the heavier reliance on front officetransactions to meet the load obligation. The ENS was also tested for the $0/ton CO 2 and$61/ton CO 2 and the amount of ENS was the same for each portfolio.Figure 7.<strong>30</strong> – Energy Not Served for the $8 CO 2 Adder CaseStochastic Mean Energy Not Served, $8 CO2Average Annual GWh for <strong>2007</strong> - 2026aGWh-yr280260240220200180160140120100806040200257174162144135RA13 RA14 RA15 RA16 RA17WestEast198
<strong>PacifiCorp</strong> – <strong>2007</strong> IRPChapter 7 – Modeling andFigure 7.31 – Upper-Tail Mean Energy Not Served for the $8 CO 2 Adder CaseUpper Tail Mean Energy Not Served, $8 CO2 Adder CaseAverage Annual Gigawatt-hours for <strong>2007</strong> to 20262,0001,5001,6971,2991,4771,2201,549aGWh1,00050012%PRM12%PRM12%PRM15%PRM12%PRM0RA13 RA14 RA15 RA16 RA17Loss of Load ProbabilityTable 7.42 displays the average Loss of Load Probability for each of the risk analysis portfoliosmodeled using the $8 CO 2 adder case. The first block of data is the average LOLP for the firstten years of the study period. The second block of data shows the same information calculatedfor the entire 20 years. The data is summarized against multiple levels of lost load, which showsthe likelihood of losing various amounts of load in a single event.Table 7.42 – Average Loss of Load Probability During Summer Peak(Probability of ENS Event > 25,000 MWh in July)Average for operating years <strong>2007</strong> through 2016Event Size(MWh) RA13 RA14 RA15 RA16 RA17> 0 29% 24% 25% 23% 26%> 1,000 24% 22% 22% 20% 24%> 10,000 16% 14% 15% 13% 17%> 25,000 12% 11% 11% 9% 13%> 50,000 9% 8% 8% 6% 10%> 100,000 6% 5% 5% 4% 7%> 500,000 1% 1% 1% 0% 1%> 1,000,000 0% 0% 0% 0% 0%Average for operating years <strong>2007</strong> through 2026Event Size(MWh) RA13 RA14 RA15 RA16 RA17> 0 53% 38% 42% 36% 44%> 1,000 47% 33% 38% 32% 40%> 10,000 28% 22% 25% 22% 29%> 25,000 21% 18% 19% 18% 24%199
<strong>PacifiCorp</strong> – <strong>2007</strong> IRPChapter 7 – Modeling andAverage for operating years <strong>2007</strong> through 2026Event Size(MWh) RA13 RA14 RA15 RA16 RA17> 50,000 16% 15% 16% 14% 20%> 100,000 11% 11% 12% 11% 16%> 500,000 4% 3% 4% 3% 5%> 1,000,000 2% 2% 2% 2% 2%Table 7.43 displays the year-by-year results for the threshold value of 25,000 megawatt-hours.For each year, the LOLP value represents the proportion of the 100 iterations where the JulyENS was greater than 25,000 megawatt-hours. This is the equivalent of 2,500 megawatts for 10hours.Table 7.43 – Year-by-Year Loss of Load ProbabilityYear RA13 RA14 RA15 RA16 RA17<strong>2007</strong> 1% 2% 2% 2% 2%2008 3% 3% 3% 3% 3%2009 8% 10% 10% 10% 10%2010 13% 12% 12% 13% 12%2011 16% 16% 16% 10% 16%2012 7% 7% 7% 4% 9%2013 13% 12% 12% 8% 13%2014 15% 10% 10% 8% 16%2015 23% 18% 18% 15% 22%2016 20% 16% 20% 17% 26%2017 23% 26% 29% 25% <strong>30</strong>%2018 28% 26% <strong>30</strong>% 27% 39%2019 15% 18% 19% 20% <strong>30</strong>%2020 22% 23% 27% 25% 31%2021 24% 22% 25% 23% 33%2022 32% 29% 31% 34% 38%2023 28% 23% 28% 22% 36%2024 36% 25% 27% <strong>30</strong>% 36%2025 41% 28% 33% 32% 32%2026 49% 28% 28% 29% 37%STOCHASTIC SIMULATION SENSITIVITY ANALYSES<strong>PacifiCorp</strong> performed several stochastic simulation studies to test the stochastic cost, risk, andreliability impacts of planning reserve margin and resource type assumptions against a referenceportfolio. Table 7.44 lists the sensitivity analysis studies conducted and the reference portfoliosused. The study assumptions and results are summarized below.200
<strong>PacifiCorp</strong> – <strong>2007</strong> IRPChapter 7 – Modeling andTable 7.44 – Sensitivity Analysis Scenarios for Detailed Simulation Analysis# Name Reference Case<strong>Plan</strong> to a 12% capacity reserve margin, and include Class 3 DSM RA8 (Consistent with the portfolio developed1sufficient to eliminate ENSfor SAS01)2 <strong>Plan</strong> to 18% capacity reserve margin SAS02, "<strong>Plan</strong> to 18% capacity reserve margin"3 Replace a 2012 base load resource with front office transactions Risk Analysis Portfolio RA1Replace a base load pulverized coal resource with a carboncapture-readyIGCC resource4 Risk Analysis Portfolio RA1Substitute a base load resource with CHP and aggregated5dispatchable customer standby generationRisk Analysis Portfolio RA112-Percent <strong>Plan</strong>ning Reserve Margin with Class 3 Demand-side Management ProgramsFor this study, 106 megawatts of Class 3 demand side management programs were added to theRA8 risk analysis portfolio in 2009. This DSM quantity reflects the total available to the modelaccording to the base case proxy supply curve results reported by Quantec LLC, and includescapacity for curtailable rate, critical peak pricing, and demand buyback programs for both theeast and west sides of the system. The Class 3 DSM programs were modeled in the PaR moduleas a “take” component during super-peak hours and a “return” component for all other hours.The impact of the Class 3 DSM on portfolio performance was negligible. Compared to RA8,stochastic mean PVRR increased by $11 million, risk exposure decreased by $9 million, andEnergy Not Served decreased by 0.1 percent.<strong>Plan</strong> to an 18-Percent <strong>Plan</strong>ning Reserve Margin<strong>PacifiCorp</strong> modeled the CEM investment plan that resulted from planning to an 18-percent planningreserve margin (SAS02 study). The SAS02 study reflects the same scenario conditions asRA1 except for the 15-percent planning reserve margin. Relative to RA1, the SAS02 portfolioresulted in a $69 million increase in stochastic mean PVRR, while risk exposure decreased by$346 million. Energy Not Served also decreased by about 16 percent. The PVRR increase wasmainly attributable to the addition of an east SCCT frame resource.Replace a 2012 Base Load <strong>Resource</strong> with Front Office TransactionsUsing RA1 as the reference case, <strong>PacifiCorp</strong> replaced the small Utah pulverized coal resourceacquired in 2012 (340 megawatts) with a comparable amount of front office transactions acquiredat the Mona trading location (6x16 product over 3 month summer season) that continuedover the remaining study period.Compared to RA1, the new portfolio’s stochastic mean PVRR was $4 million lower, while therisk exposure increased by $3.4 billion. Energy Not Served increased by nine percent. Based onthis sensitivity study, <strong>PacifiCorp</strong> concluded that replacing a long-term asset outright with marketpurchases—holding other factors constant—is not a preferred east-side resource strategy giventhe cost-versus-risk tradeoff.Replace a Base Load Pulverized Coal <strong>Resource</strong> with a Carbon-Capture-Ready IGCCStarting with portfolio RA1, <strong>PacifiCorp</strong> replaced the 750-megawatt Wyoming supercritical pulverizedcoal resource with an equivalently sized IGCC plant that has minimum carbon capture201
<strong>PacifiCorp</strong> – <strong>2007</strong> IRPChapter 7 – Modeling andprovisions. The coal resource replacement resulted in a $687 million increase in stochastic meanPVRR and a $411 million increase in risk exposure. The risk exposure increase is due to the twopercentlower availability of the IGCC relative to the Wyoming SCPC resource.Replace a Base Load <strong>Resource</strong> with CHP and Dispatchable Customer Standby GenerationUsing portfolio RA1 as the starting point, <strong>PacifiCorp</strong> replaced the small Utah pulverized coalresource with 280 megawatts of gas-fired CHP resources and 60 megawatts of west-side customerstandby generation. (This sensitivity addresses an analysis requirement in the Oregon PublicUtility Commission’s 2004 <strong>Integrated</strong> <strong>Resource</strong> <strong>Plan</strong> acknowledgement order.) Table 7.45reports the sizes, locations, and number of units used for the study.Table 7.45 – Combined Heat and Power Replacement <strong>Resource</strong>sCHP <strong>Resource</strong> Type East Location West Location System TotalLarge industrial – 25 MW 75 MW (3 units) 150 MW (6 units) 225 MW (9 units)Small industrial/commercial – 5 MW 35 MW (7 units) 20 MW (4 units) 55 MW (11 Units)Total 110 MW 170 MW 280 MWComparing against portfolio RA1, the new portfolio with CHP and customer standby generationresources had a $168 million higher stochastic mean PVRR. Risk exposure was higher by $2.4billion, while Energy Not Served was higher by about 7 percent.PREFERRED PORTFOLIO SELECTION AND JUSTIFICATIONBased on the stochastic analysis results for the Group 2 risk analysis portfolios, the company haschosen RA14 as the preferred portfolio. Table 7.46 shows the resulting load and resource balancewith preferred portfolio resources and east-west transfers included.This portfolio reflects a robust resource strategy that accounts for the major resource risk factors(specifically the form and cost impact of CO 2 regulations, and price volatility for natural gasplants and market purchases) as well as evolving state resource policies that are currently notcoordinated with respect to <strong>PacifiCorp</strong>’s system-wide integrated resource planning mandate.Portfolio RA14 is viewed as the least-cost and least economically risky proposition for reliablymeeting <strong>PacifiCorp</strong>’s load obligation while accommodating different state policies and interests.In assessing the overall merits of this portfolio, <strong>PacifiCorp</strong> also concentrated on the value of thedifferent resource types for managing portfolio risks in the short term, mid term, and long term.For the short term, the acquisition of renewables, DSM and CHP increases portfolio diversityand lays the groundwork for a resource base that can comply with early RPS and CO 2 complianceschedules. For the mid term—2012 through 2014, which is a period marked by significantresource need and escalating regulatory risks—the preferred portfolio is constituted with a mixof proxy long-term assets with complementary risk profiles (supercritical pulverized coal andCCCT resources), supplemented by new front office transactions to increase planning flexibility.For the long term, the preferred portfolio includes flexible long-term assets with a small emissionsfootprint and a moderate reliance on front office transactions. This resource mix is most inline with the company strategy to reduce its long-term reliance on the market, which is discussedin more detail later in this chapter.202
<strong>PacifiCorp</strong> – <strong>2007</strong> IRPChapter 7 – Modeling and<strong>Plan</strong>ning Reserve Margin SelectionWhile Portfolio RA14 is based on a target planning reserve margin of 12 percent, <strong>PacifiCorp</strong> istargeting a reserve margin range of 12 to 15 percent to increase planning flexibility given a timeof rapid public policy evolution and wide uncertainty over the resulting down-stream cost impacts.While the portfolio analysis indicates that lowering the planning reserve margin increasesportfolio stochastic risk and reduces reliability, the decision on what margin to adopt is a subjectiveone that depends on balancing portfolio risk against cost. Given the expected pressure oncustomer rates due to state resource constraints, as well as the rapid pace of construction costincreases for all resource types, near-term affordability of a resource plan is a consideration guidingthe planning margin decision.<strong>PacifiCorp</strong>’s choice to adopt a 12 percent planning reserve margin is intended to keep the portfoliocost down while retaining the flexibility to adjust the margin upwards and acquire appropriateincremental resources. Market conditions, revised load growth projections, or new regional adequacystandards may prompt the company to increase the margin in response. Based on theGroup 2 portfolio analysis and the resource outlook developed for this IRP, a higher planningreserve margin would be met with a combination of gas generation and front office transactions,as can be seen in Portfolio RA16.An issue raised by public stakeholders is the impact of the planning reserve margin decision onsupply reliability. <strong>PacifiCorp</strong>’s view is that supply reliability is not materially impacted by aswing in the margin from 15 to 12 percent. The supply reliability analyses (Energy Not Servedand Loss of Load Probability) indicate that, with the exception of “all coal” portfolios such asRA13, there are no significant differences among the portfolios with respect to reliability. Asadditional evidence of this finding, comparing portfolio pairs intended to test the impact of a 15percent margin against a 12 percent margin (RA1 versus RA8, RA10 versus RA9, RA11 versusRA12, and RA16 versus RA14) yields small differences in average annual ENS of between 1.2MWa to 3.9 MWa.203
<strong>PacifiCorp</strong> – <strong>2007</strong> IRPChapter 7 – Modeling andTable 7.46 – Preferred Portfolio Capacity Load and <strong>Resource</strong> BalanceCalendar Year <strong>2007</strong> 2008 2009 2010 2011 2012 2013 2014 2015 2016EastThermal 6,134 5,941 5,941 5,941 5,941 5,941 5,941 5,941 5,941 5,941Hydro 135 135 135 135 135 135 135 135 135 135DSM 153 163 163 163 163 163 163 163 163 163Renewable 65 109 109 109 109 109 109 109 105 105Purchase 904 679 778 548 543 343 343 343 343 322QF 106 106 106 106 106 106 106 106 106 106Interruptible 233 233 <strong>30</strong>8 <strong>30</strong>8 <strong>30</strong>8 <strong>30</strong>8 <strong>30</strong>8 <strong>30</strong>8 <strong>30</strong>8 <strong>30</strong>8Transfers 534 797 731 898 1,162 955 1,111 597 701 777East Existing <strong>Resource</strong>s 8,264 8,163 8,271 8,208 8,467 8,060 8,216 7,702 7,802 7,857Wind 0 24 24 40 48 48 109 109 109 109DSM 0 0 0 0 0 15 63 63 63 63CHP 0 0 0 0 0 25 25 25 25 25Front Office Transactions 0 0 0 393 272 97 3 149 192 165Thermal 0 0 0 0 0 888 888 1,415 1,415 1,772East <strong>Plan</strong>ned <strong>Resource</strong>s 0 24 24 433 320 1,073 1,088 1,761 1,804 2,134East Total <strong>Resource</strong>s 8,264 8,187 8,295 8,641 8,787 9,133 9,<strong>30</strong>4 9,463 9,606 9,991Load 6,321 6,515 6,657 7,137 7,289 7,595 7,738 7,895 8,026 8,366Sale 849 811 702 666 631 595 595 595 595 595East Obligation 7,170 7,326 7,359 7,803 7,920 8,190 8,333 8,490 8,621 8,961<strong>Plan</strong>ning reserves (12%) 706 750 733 767 796 872 894 896 906 953Non-owned reserves 71 71 71 71 71 71 71 71 71 71East Reserves 776 821 804 837 867 942 965 966 977 1,023st Obligation + Reserves (12%) 7,946 8,147 8,163 8,641 8,787 9,132 9,298 9,456 9,598 9,984East Position 317 40 132 0 0 1 6 7 8 6East Reserve Margin 16% 13% 14% 12% 12% 12% 12% 12% 12% 12%WestThermal 2,046 2,046 2,046 2,046 2,046 2,046 2,046 2,046 2,046 2,046Hydro 1,421 1,421 1,414 1,328 1,357 1,225 1,249 1,243 1,244 1,242DSM 0 0 0 0 0 0 0 0 0 0Renewable 108 108 108 108 108 84 84 84 84 84Purchase 786 800 800 799 749 112 141 107 107 107QF 40 40 40 40 40 40 38 38 38 38Transfers (542) (804) (741) (907) (1,170) (964) (1,120) (606) (708) (786)West Existing <strong>Resource</strong>s 3,859 3,611 3,667 3,414 3,1<strong>30</strong> 2,542 2,438 2,913 2,811 2,732Wind 14 14 51 79 79 98 98 98 98 98DSM 0 0 0 0 0 32 32 32 32 32CHP 0 0 0 0 0 75 75 75 75 75Front Office Transactions 0 0 0 219 64 555 657 247 246 249Thermal 0 0 0 0 548 548 548 548 548 548West <strong>Plan</strong>ned <strong>Resource</strong>s 14 14 51 298 691 1,<strong>30</strong>8 1,410 1,000 999 1,002West Total <strong>Resource</strong>s 3,873 3,625 3,718 3,712 3,821 3,850 3,848 3,913 3,810 3,734Load 2,922 2,924 3,095 3,124 3,199 3,240 3,251 3,262 3,271 3,252Sale 299 299 299 290 290 258 258 258 158 108West Obligation 3,221 3,223 3,394 3,414 3,489 3,498 3,509 3,520 3,429 3,360<strong>Plan</strong>ning Reserves (12%) 292 291 311 287 321 336 322 376 365 357Non-owned reserves 7 7 7 7 7 7 7 7 7 7West Reserves 299 297 318 294 328 342 328 383 372 363West Obligation + Reserves 3,513 3,514 3,705 3,701 3,810 3,834 3,831 3,896 3,794 3,716West Position 360 111 12 11 11 16 17 17 16 18West Reserve Margin 23% 15% 12% 12% 12% 12% 12% 12% 12% 12%SystemTotal <strong>Resource</strong>s 12,137 11,811 12,013 12,353 12,608 12,983 13,152 13,376 13,416 13,725Obligation 10,391 10,549 10,753 11,217 11,409 11,688 11,842 12,010 12,050 12,321Reserves 1,075 1,118 1,122 1,131 1,194 1,285 1,293 1,349 1,348 1,386Obligation + Reserves 11,466 11,667 11,874 12,348 12,603 12,973 13,135 13,359 13,398 13,707System Position 671 144 138 5 5 10 17 17 18 18Reserve Margin 18% 13% 13% 12% 12% 12% 12% 12% 12% 12%204
<strong>PacifiCorp</strong> – <strong>2007</strong> IRPChapter 7 – Modeling andThe Role of Front Office Transactions and Market Availability ConsiderationsIn parallel with the decision on an appropriate planning reserve margin level, the degree to which<strong>PacifiCorp</strong> relies on firm market transactions is a decision that requires balancing portfolio costand risk. As demonstrated by comparing risk analysis portfolios with differing front office transactionassumptions, less reliance on front office transactions tends to reduce market price riskexposure, but can increase or decrease mean stochastic cost depending on the make-up of theportfolio. As mentioned earlier in this chapter, <strong>PacifiCorp</strong> believes that a limited amount of frontoffice transactions benefit the preferred portfolio by increasing planning flexibility and resourcediversity. Nevertheless, the company is concerned about long-term reliance on the market andexposure to market price risk, and therefore seeks to reduce that reliance as part of its overallresource management strategy. This concern stems from two sources of market price risk anduncertainty. The first source is the shifting resource mix outlook in the Western Interconnection,driven principally by new or expected state regulatory requirements. Specific trends include extensiveexpansion of renewable and gas-fired capacity and a counterpart reduction in coal capacitydevelopment. The second source of risk and uncertainty is the potential tightening of the regionalcapacity balance in the next decade due to planned resources not being built as more utilitiesrely on the market to meet their future needs. This is the time frame when a significantamount of base load capacity is needed by <strong>PacifiCorp</strong> and other utilities.The preferred portfolio is consistent with this strategic view on market reliance. The system-widefront office transaction amount in the preferred portfolio peaks at 660 megawatts in 2013, representingjust over 55 percent of the transactions amount included as a planned resource in Pacifi-Corp’s 2004 IRP (1,200 megawatts). Additionally, the company no longer plans for a fixed annualtarget amount of new firm market purchases in the load and resource balance as was donefor the previous IRP; rather, front office transactions are evaluated on a comparable basis withother resources and are subject to the company’s stochastic risk analysis. Finally, the reliance onfront office transactions drops off significantly after 2013, declining over one-third by 2016.Regarding market availability to support the level of front office transactions in the preferredportfolio, <strong>PacifiCorp</strong> points to purchase offer activity in response to recent periodic requests forproposals issued by the company’s commercial and trading department. Requests in <strong>2007</strong> forthird-quarter products for <strong>2007</strong>-2012 delivery yielded over 5,000 megawatts in offers.FUEL DIVERSITY PLANNINGPursuant to the Utah Public Service Commission’s order on the PURPA Fuel Source Standard(Docket no. 06-999-03, issued on March 13, <strong>2007</strong>), this section describes how fuel source diversityis addressed in the <strong>2007</strong> <strong>Integrated</strong> <strong>Resource</strong> <strong>Plan</strong>. 63The IRP standards and guidelines require <strong>PacifiCorp</strong> to evaluate all resource options on a consistentand comparable basis, which explicitly implies consideration of coal, natural gas, demandsidemanagement, and renewable resources (See Appendix I). In addition, the new Oregon Public63 As directed by the Utah Commission and agreed to by <strong>PacifiCorp</strong>, all future IRPs will include a section on fuelsource diversity to comply with the new fuel source standard under Title 1 Subtitle B of PURPA. See Chapter 3 formore details.205
<strong>PacifiCorp</strong> – <strong>2007</strong> IRPChapter 7 – Modeling andUtility Commission IRP guidelines issued in January <strong>2007</strong> require the company to consider “allknown resources for meeting the utility’s load”, as well as compare different fuel types. 64 Asdiscussed in Chapter 2, one of <strong>PacifiCorp</strong>’s planning principles is to seek a diversified, low-costmix of resources that minimizes risks for customers and the company. The company’s portfoliooptimization studies, using a range of planning scenarios, adhered to this planning principle.This IRP fulfills the PURPA requirement for a fuel diversity plan in the following ways:● <strong>PacifiCorp</strong> considered a comprehensive range of resource options for the IRP, includingtransmission resources. With the exception of Class 2 DSM, these resources were evaluatedon a comparable basis using the CEM model.● <strong>PacifiCorp</strong> conducted alternative future studies to derive optimal resource investment plansunder a wide range of conditions. As a result of these deterministic scenario studies, Pacifi-Corp selected a variety of DSM programs, wind, and CHP resources to be included in subsequentportfolio evaluations and the preferred portfolio.● To account for state resource policies in the areas of renewable generation and climatechange, the company evaluated portfolios with an additional 600 megawatts of nameplatewind capacity. Based on the associated stochastic modeling results, <strong>PacifiCorp</strong> decided to includethis additional wind capacity in its preferred portfolio. 65● <strong>PacifiCorp</strong> validated with its stochastic production cost modeling that a balanced mixture ofnew wind, gas, and coal resources is optimal from a cost and portfolio risk managementstandpoint.● Although the preferred portfolio includes 867 megawatts of supercritical pulverized coal capacity,the amount of natural gas-fired capacity added exceeds this amount (1,553 megawatts)as does the nameplate renewables capacity (2,000 megawatts).Figure 7.32 compares the resource energy mix for <strong>2007</strong> and 2016; the latter including preferredportfolio resources. The 2016 results are shown for generation under an $8/ton CO 2 adder andthe average generation across the five CO 2 adders modeled. The comparison highlights the largedecrease in coal-fired generation and the offsetting increase in renewable, gas-fired, and frontoffice transaction generation. (Note that only the system balancing purchases are shown; for example,under the $8/ton CO 2 adder case, accounting for system balancing sales results in a netsales amount of 9,843 gigawatt-hours in <strong>2007</strong> and a net purchase amount of 3,518 gigawatthoursin 2016.)Figure 7.33 provides a resource mix comparison on the basis of capacity for the $8/ton CO 2 addercase. For the renewables category, the capacity contribution of wind resources is used.64 Public Utility Commission of Oregon, “Investigation Into <strong>Integrated</strong> <strong>Resource</strong> <strong>Plan</strong>ning” UM 1056, Order No. 07-002, Appendix A, p. 7.65 The preferred portfolio was also tested to determine the cost and risk impact of removing the 600 MW of wind.Stochastic PVRR increased by $0.9 billion and risk exposure increased by $5.5 billion due to the increase in spotmarket purchases.206
<strong>PacifiCorp</strong> – <strong>2007</strong> IRPChapter 7 – Modeling andFigure 7.32 – Current and Projected <strong>PacifiCorp</strong> <strong>Resource</strong> Energy Mix<strong>2007</strong> <strong>Resource</strong> Energy Mix with Preferred Portfolio <strong>Resource</strong>s($8 CO2 Adder Case)Gas-CHP0.0%Hydroelectric9.6%Interruptible Class 1 DSM0.1%>0.0%Renewable3.6%Gas-SCCT0.2%Gas-CCCT8.5%System BalancingPurchases4.5%Existing Purchases8.7%Pulverized Coal64.8%2016 <strong>Resource</strong> Energy Mix with Preferred Portfolio <strong>Resource</strong>s($8 CO2 Adder Case)Hydroelectric6.9%Gas-CHP0.2%Gas-SCCT0.6%Interruptible0.1%Renewable8.4%Class 1 DSM>0.0%Gas-CCCT15.9%Pulverized Coal46.3%System BalancingPurchases13.1% Front Office Transactions2.9%Existing Purchases5.7%207
<strong>PacifiCorp</strong> – <strong>2007</strong> IRPChapter 7 – Modeling and2016 <strong>Resource</strong> Energy Mix with Preferred Portfolio <strong>Resource</strong>s(Average for five CO2 Adder Cases)Hydroelectric6.9%Interruptible0.1%Renewable8.5%Class 1 DSM>0.0%Gas-CHP0.2%Gas-SCCT0.7%Pulverized Coal43.4%Gas-CCCT17.4%System BalancingPurchases14.2%Front Office Transactions2.9%Existing Purchases5.7%Figure 7.33 – Current and Projected <strong>PacifiCorp</strong> <strong>Resource</strong> Capacity Mix<strong>2007</strong> <strong>Resource</strong> Capacity Mix, with Preferred Portfolio <strong>Resource</strong>s($8 CO2 Adder Case)Interruptible1.9%Renewable1.5% Class-1 DSM1.3%Hydroelectric12.8%Gas-CHP0.0%Gas-SCCT3.2%Gas-CCCT14.0%Pulverized Coal50.2%Existing Purchases15.1%208
<strong>PacifiCorp</strong> – <strong>2007</strong> IRPChapter 7 – Modeling and2016 <strong>Resource</strong> Capacity Mix, with Preferred Portfolio <strong>Resource</strong>s($8 CO2 Adder Case)Gas-CHP0.7%Gas-SCCT2.8%Interruptible2.2%Hydroelectric10.0%Renewable2.9%Class-1 DSM1.9%Gas-CCCT21.8%Pulverized Coal50.5%Existing Purchases4.2%Front Office Transactions3.0%FORECASTED FOSSIL FUEL GENERATOR HEAT RATE TRENDPursuant to the Utah Public Service Commission’s order on the PURPA Fuel Sources Standard(Docket no. 06-999-03), this section reports the forecasted average heat rate trend for the company’sfossil fuel generator fleet on an annual basis, accounting for new IRP resources and currentplanned retirements of existing resources. The fleet-wide heat rate represents the individualgenerator heat rates weighted by their annual generation. (Note that system dispatch accounts foran $8/ton CO 2 cost adder). For existing fossil fuel resources, four-year average historical heatrate curves are used, whereas new resources use expected heat rates accounting for degradationover time.Figure 7.34 shows the fleet weighted-average fossil fuel generator heat rate trend from <strong>2007</strong>through 2026, indicating the contributions from existing coal resources, existing gas resources,new coal resources, and new gas resources (including CHP). The average heat rate declines from10,255 to 9,082 Btu/kWh, a compounded average annual decrease of 0.6 percent. As indicated inFigure 7.34, the heat rate contribution of existing coal plants drops significantly, declining from91 percent of the system total in <strong>2007</strong> to only 53 percent by 2026. Also underlying the trend isincreasing reliance on generation from new gas and wind resources, the later displacing generationfrom existing coal plants.209
<strong>PacifiCorp</strong> – <strong>2007</strong> IRPChapter 7 – Modeling andFigure 7.34 – Fleet Average Fossil Fuel Heat Rate Annual Trend by Generator Type11,00010,255Average Annual Heat Rate, Btu/KWh10,0009,0008,0007,0006,0005,000New CoalNew GasExisting GasExisting Coal9,0824,000<strong>2007</strong>2008200920102011201220132014201520162017201820192020202120222023202420252026Existing Coal Existing Gas IRP-Gas IRP-CoalCLASS 2 DSM DECREMENT ANALYSISThis section presents the results of the Class 2 demand-side management decrement analysis. Forthis analysis, the preferred portfolio, RA14, was used to calculate the decrement value of varioustypes of Class 2 programs following the methodology described in Chapter 6. <strong>PacifiCorp</strong> willuse these decrement values when evaluating the cost-effectiveness of potential new programsbetween IRP cycles. Note that for the next IRP, the company intends to model Class 2 DSM programsas options in the CEM.Modeling ResultsTables 7.47 and 7.48 show the nominal results of the 12 decrement cases for each year of the 20-year study period. Although no resources were deferred or eliminated from the portfolio due tothe addition of Class 2 decrements, there is value in having to produce less generation to meet asmaller load. Consistent with the results for the 2004 IRP, the residential air conditioning decrementsproduce the highest value for both the east and west locations. The commercial lighting,residential lighting, and system load shapes provide the lowest avoided costs. Much of their enduse shapes reduce loads during a greater percentage of off-peak hours than the other shapes andduring all seasons, not just the summer.210
<strong>PacifiCorp</strong> – <strong>2007</strong> IRPChapter 7 – Modeling andTable 7.47 – Annual Nominal Avoided Costs for Decrements, 2010-2017ActualDecrement Values (Nominal $/MWh)LoadDecrement Name Factor 2010 2011 2012 2013 2014 2015 2016 2017EASTResidential Cooling 7% 113.38 108.78 87.59 102.59 93.54 103.99 109.84 125.48Residential Lighting 60% 68.98 71.73 59.68 62.57 59.64 64.99 70.69 79.62Residential Whole House 46% 70.15 72.66 59.42 62.88 60.20 65.45 70.96 80.75Commercial Cooling 16% 84.24 85.<strong>30</strong> 69.27 71.34 67.94 73.62 80.28 92.47Commercial Lighting 49% 68.54 71.97 58.73 61.46 58.68 63.41 69.75 78.65System Load Shape 65% 65.18 68.16 56.32 59.07 56.47 61.24 67.18 75.95WESTResidential Cooling 20% 53.78 51.87 46.99 48.02 53.67 61.06 64.64 71.75Residential Heating 28% 39.61 51.06 46.11 41.06 46.09 49.83 58.15 62.73Residential Lighting 60% 44.34 48.56 43.70 42.10 47.45 52.78 58.20 64.16Commercial Cooling 16% 51.66 51.53 46.13 45.39 50.85 56.96 61.81 68.73Commercial Lighting 49% 43.70 49.34 44.49 42.02 47.47 53.32 59.31 64.67System Load Shape 67% 43.<strong>30</strong> 47.26 42.03 40.37 45.83 50.94 56.26 61.72Table 7.48 – Annual Nominal Avoided Costs for Decrements, 2018-2026Decrement Values (Nominal $/MWh)Decrement Name 2018 2019 2020 2021 2022 2023 2024 2025 2026EASTResidential Cooling 159.57 126.86 134.61 143.92 156.62. 162.45 179.23 163.99 169.83Residential Lighting 89.48 79.87 84.65 94.16 101.92 107.82 114.58 109.87 114.15Residential Whole House 92.15 80.99 86.70 96.72 104.36 109.46 115.60 110.67 115.<strong>30</strong>Commercial Cooling 112.19 94.43 101.17 112.70 120.17 127.26 134.85 125.33 1<strong>30</strong>.80Commercial Lighting 88.24 79.76 84.34 93.77 102.27 107.34 112.81 108.90 113.99System Load Shape 85.11 76.64 81.36 91.08 98.25 103.65 109.32 106.14 110.51WESTResidential Cooling 82.31 84.03 81.81 84.23 88.84 92.96 92.68 101.82 106.02Residential Heating 64.95 74.27 73.25 75.52 77.45 83.09 83.53 87.11 90.81Residential Lighting 69.12 75.11 74.60 77.29 80.09 83.49 84.27 90.13 92.83Commercial Cooling 79.65 81.63 79.24 82.88 85.36 89.09 89.94 99.11 102.64Commercial Lighting 69.44 76.45 75.28 78.62 81.44 85.47 86.40 91.81 94.13System Load Shape 66.44 73.25 72.82 75.55 77.92 81.97 82.64 87.95 90.18Figures 7.35 and 7.36 show the decrement costs for each end use along with the average annualforward market price for that location: Palo Verde (PV) for the east and Mid-Columbia (Mid-C)for the west.211
<strong>PacifiCorp</strong> – <strong>2007</strong> IRPChapter 7 – Modeling andFigure 7.35 – East Decrement Price Trends180.00170.00160.00150.00140.001<strong>30</strong>.00120.00$/MWh110.00100.0090.0080.0070.0060.0050.0040.00<strong>30</strong>.002010 2011 2012 2013 2014 2015 2016 2017 2018 2019 2020 2021 2022 2023 2024 2025 20267% 60% 46% 16% 49% 65% Palo Verde - FlatFigure 7.36 – West Decrement Price Trends110.00105.00100.0095.0090.0085.0080.0075.00$/MWh70.0065.0060.0055.0050.0045.0040.0035.00<strong>30</strong>.002010 2011 2012 2013 2014 2015 2016 2017 2018 2019 2020 2021 2022 2023 2024 2025 202620% 28% 60% 16% 49% 67% Mid Columbia Flat212
<strong>PacifiCorp</strong> – <strong>2007</strong> IRPChapter 7 – Modeling andREGULATORY SCENARIO RISK ANALYSIS – GREENHOUSE GAS EMISSIONSPERFORMANCE STANDARDSChapter 2 identified CO 2 regulation as an important scenario risk facing the company. In additionto the CO 2 externality cost scenarios investigated for this IRP, <strong>PacifiCorp</strong> also conducted aportfolio scenario study using the CEM and PaR models where a generator-based greenhouse gasemissions performance standard, such as the one in place in California, is instituted in all of<strong>PacifiCorp</strong>’s service territory. The purpose of the study was to determine the comparative stochasticcost, risk, and CO 2 emission impacts of a portfolio that meets performance standard requirementsas modeled using the CEM. This section first outlines the study approach and thenpresents comparative results with respect to the preferred portfolio (RA14) and the other Group 2portfolios.Scenario Study ApproachFor this study, <strong>PacifiCorp</strong> first used the CEM to determine a deterministically optimized portfolioon the basis of GHG performance standard constraints, and then manually constrained theCEM resources to yield a portfolio with an improved cost and risk profile as determined by stochasticPaR model runs. This process is similar to the one used to develop the risk analysis portfolios.The CEM was allowed to optimize resource selection and timing subject to assumptions designedto restrict resources to those that can comply with a CO 2 emission performance standard(a per-ton emissions amount comparable or less than a CCCT). The specific CEM portfolio assumptionsfor the study are as follows:• <strong>Resource</strong>s available for selection by the CEM include CCCT (F and G types with ductfiring), IGCC with carbon capture and sequestration (CCS), renewables, DSM (bothClass 1 and Class 3), and combined heat and power; pulverized coal was excluded as aresource option.• No constraints were placed on resource amounts, timing, or location, except for earliestavailable in-service dates.• A total of 3,700 megawatts of renewables was made available for selection.• Renewable portfolio standards for California, Oregon, and Washington were assumed tobe in place. The RPS requirements were handled as state contributions to a gross percentageon system retail loads—the same method used for previous RPS portfolio modeling.The percentages were updated based on the March <strong>2007</strong> load forecast.• The quantity of front office transactions was limited to 1,200 megawatts after 2011 (700in the east and 500 megawatts in the west).• A 12 percent planning reserve margin and $8/ton CO 2 cost adder were assumed.Table 7.49 shows the cumulative capacity by resource type and simulation period for the resultingCEM portfolio solution.213
<strong>PacifiCorp</strong> – <strong>2007</strong> IRPChapter 7 – Modeling andTable 7.49 – Capacity Additions for the Initial CEM GHG Emissions Performance StandardPortfolioCumulative NameplateCapacity by Period (MW)<strong>Resource</strong> <strong>2007</strong>-2016 <strong>2007</strong>-2026Gas - CCCT 1,507 6,410Renewables 1,900 3,100DSM 137 156IGCC with CCS - -As noted above, the CEM was not constrained to select certain resource amounts in certain yearsor areas. One consequence of this model set-up is that the resulting CEM portfolio does not reflectan investment schedule that is advantageous from a stochastic cost and risk standpoint. Anotherconsequence is that the model’s wind investment pattern differs significantly from whatwas identified in <strong>PacifiCorp</strong>’s preferred portfolio. For example, the model did not recognizegeographical RPS requirements in placing renewable resources; all wind resources were added inthe east side until 2018. Additionally, the CEM included more renewables in <strong>2007</strong> than the preferredportfolio (700 megawatts versus 400 megawatts in the preferred portfolio), which is notpractical from a procurement perspective.To address these two issues, <strong>PacifiCorp</strong> first subjected this portfolio to stochastic simulation tocreate baseline stochastic results. Then, the CEM was executed again after applying resourceconstraints to the portfolio. These constraints include (1) limiting renewables to <strong>30</strong>0 megawattsin <strong>2007</strong> 66 , (2) adding an east-side CCCT in 2011 to replace a portion of front office transactions,and (3) fixing the east-side CCCT resource selected in 2011. The resulting CEM portfolio wassimulated with the PaR model, and stochastic results compared against those of the originalCEM portfolio. These resource constraints reduced stochastic mean PVRR by $144 million, riskexposure by $671 million, and upper-tail risk by $816 million. Table 7.50 shows the resourceadditions for the final GHG emission performance standard portfolio from <strong>2007</strong> through 2026.As with the other risk analysis portfolios, load growth and capacity reserve requirements are metwith CCCT growth stations after 2018.Stochastic Cost and Risk ResultsTable 7.51 provides the stochastic cost and risk results for the GHG emission performance standardportfolio by CO 2 cost adder case. Results are shown for both the CO 2 tax and cap-and-tradecompliance scenarios. Figures 7.37 through 7.39 show the cost-versus-risk trade-off of the portfolioin relation to the other Group 2 risk analysis portfolios assuming the CO 2 cap-and-tradescenario. Figure 7.37 is a scatter plot of the cost and risk measures based on the average of thefive CO 2 adder cases, while Figures 7.38 and 7.39 show the cost and risk results for the $0 and$61 CO 2 adder cases, respectively.66 The remainder of the renewables investment schedule was not altered in order to minimize manual portfoliochanges.214
<strong>PacifiCorp</strong> – <strong>2007</strong> IRP Chapter 7 – Modeling and Portfolio Selection ResultsTable 7.50 – <strong>Resource</strong> Investment Schedule for the Final GHG Emissions Performance Standard PortfolioNameplate Capacity, MWEastWest<strong>Resource</strong> <strong>2007</strong> 2008 2009 2010 2011 2012 2013 2014 2015 2016 2017 2018 2019 2020 2021 2022 2023 2024 2025 2026CCCT, 2 x 1 F Class - - - - 548 548 - - - - 548 - 1,096 - - 548 - - - 548Renewables, SE ID 200 - - - - - - - - 200 - - - - - - - - - -Renewables, WY 100 700 - 200 - 100 - - 200 - - - - - - - - - - -Renewables, NV - - - - - - - - - - 200 200 - - - - - - - -DSM, Class 1 and 3 - - - - - 7 7 7 - - 52 52 52 - - - - - - -Front office transactions - - - 486 550 158 1<strong>30</strong> 563 98 700 505 556 - - - - - - - -CCCT, 2 x 1 F Class - - - - - 602 - - - - - - 602 - - - 602 - 602 -CCCT, 1x1 G Class - - - - - - - - - - 392 - - - - - - - - -Renewables, SE WA - - - - - - - - - - 200 - - - - - - - - -Renewables, MT - - - - - - - - - - - 400 - - - - - - - -Renewables, NC OR - - - - - - 100 - - - - <strong>30</strong>0 - - - - - - - -DSM, Class 1 and 3 - - - - - 3 3 3 - - 19 19 20 - - - - - - -Front office transactions - - - 69 311 400 500 250 250 416 250 250 - - - - - - - -Total Annual Additions <strong>30</strong>0 700 - 755 1,409 1,818 740 823 1,048 1,316 2,167 1,778 1,770 - - 548 602 - 602 548Table 7.51 – Stochastic Cost and Risk Results for the Final GHG Emissions Performance Standard PortfolioCO2 CostAdder Case(2008 $)Stochastic MeanPVRRStochastic Results (Million $) – CO2 Tax Basis5thPercentile95thPercentileUpper-TailMeanRiskExposureStandardDeviation$0 23,2<strong>30</strong> 14,637 37,387 70,858 47,628 13,046$8 26,950 16,244 42,547 78,253 51,<strong>30</strong>3 14,152$15 28,731 17,754 45,152 81,756 53,026 14,695$38 34,956 21,172 54,802 95,420 60,465 17,063$61 41,227 24,484 64,948 110,445 69,218 19,823Stochastic Results (Million $) – CO2 Cap and Trade BasisCO2 CostAdder Case(2008 $)Stochastic MeanPVRR5thPercentile95thPercentileUpper-TailMeanRiskExposureStandardDeviation$0 21,922 13,3<strong>30</strong> 36,080 69,550 47,628 13,046$8 22,033 11,327 37,6<strong>30</strong> 73,336 51,<strong>30</strong>3 14,152$15 22,014 11,037 38,435 75,039 53,026 14,695$38 21,470 7,687 41,316 81,935 60,465 17,063$61 20,577 3,834 44,298 89,795 69,218 19,823215
<strong>PacifiCorp</strong> – <strong>2007</strong> IRPChapter 7 – Modeling and Portfolio Selection ResultsFigure 7.37 – Average Stochastic Cost versus Risk Exposure Across All CO 2 Adder CasesAverage Across All CO2 Adder CasesCO2 Cap and Trade BasisRisk Exposure: Upper-TailStochastic Mean minus Overall MeanPVRR (Billion $)57.00GHG Perf.Std.56.0055.0054.00RA17RA1553.00RA1452.00RA16RA1351.0021.2 21.6 22.0 22.4 22.8 23.2Stochastic Mean PVRR (Billion $)Figure 7.38 – Stochastic Cost versus Risk Exposure for the $0 CO 2 Adder CaseRisk Exposure: Upper-TailStochastic Mean minus OverallMean PVRR (Billion $)49.0048.0047.0046.0045.0044.0043.00RA15RA14RA16RA17$0 CO2 Adder CaseCO2 Cap-and-Trade BasisRA13GHG Perf. Std.42.0021.0 21.5 22.0 22.5 23.0Stochastic Mean PVRR (Billion $)216
<strong>PacifiCorp</strong> – <strong>2007</strong> IRPChapter 7 – Modeling and Portfolio Selection ResultsFigure 7.39 – Stochastic Cost versus Risk Exposure for the $61 CO 2 Adder Case$61 CO2 Adder CaseCO2 Cap and Trade BasisRisk Exposure: Upper-TailStochastic Mean minus OverallMean PVRR (Billion $)70.0069.0068.0067.0066.0065.0064.0063.0062.00GHG Perf. Std.RA16RA15RA14RA17RA1361.00RA1960.0020.50 21.00 21.50 22.00 22.50 23.00Stochastic Mean PVRR (Billion $)As can be seen from the figures, the stochastic cost ranking of the GHG emissions performancestandard portfolio relative to the Group 2 risk analysis portfolios is sensitive to the CO 2 cost adderlevel. Under the $0/ton CO 2 adder case, the stochastic PVRR of the GHG emissions performancestandard portfolio is $662 million higher than that of the preferred portfolio. In contrast,under the $61/ton CO 2 adder case, the preferred portfolio stochastic PVRR is $406 millionhigher. When averaging stochastic PVRR results across the CO 2 adder cases, the GHG emissionsperformance standard portfolio falls within the middle of the pack.The GHG emissions performance standard portfolio has the highest risk among the Group 2 portfoliosfor all CO 2 adder scenarios. In comparison to the preferred portfolio, risk is about $3.6billion higher under the $0/ton CO 2 adder and $4.6 billion higher under the $61/ton CO 2 adder.Carbon Dioxide Emissions ResultsAs expected, the GHG emissions performance standard portfolio has a smaller CO 2 footprintthan the other risk analysis portfolios due to the lack of new coal plants. Relative to the preferredportfolio, the GHG emissions performance standard portfolio emits about 49 million fewer tonsof CO 2 on a cumulative basis from <strong>2007</strong> through 2026 when averaged across the five CO 2 addercases.The annual CO 2 emissions impact of the adder can be seen by comparing Figures 7.40 and 7.41,which show emissions under the $0 and $61/ton CO 2 adders, respectively. (Annual emissionquantities are reported as the contribution from retail sales; that is, net of wholesale sales.) Figure7.42 shows annual CO 2 emission trends as the average of the results for the six portfolios.217
<strong>PacifiCorp</strong> – <strong>2007</strong> IRPChapter 7 – Modeling and Portfolio Selection ResultsFigure 7.40 – Annual CO 2 Emission Trends, <strong>2007</strong>-2026 ($0 CO 2 Adder Case)65,00060,00055,000(Tons 000)50,00045,00040,000<strong>2007</strong> 2008 2009 2010 2011 2012 2013 2014 2015 2016 2017 2018 2019 2020 2021 2022 2023 2024 2025 2026RA13 RA14 RA15 RA16 RA17 GHG Pref. Std.Figure 7.41 – Annual CO 2 Emission Trends, <strong>2007</strong>-2026 ($61 CO 2 Adder Case)65,000$61/Ton CO 2 adder has a phase-inperiod from 2010-201660,000(Tons 000)55,00050,00045,00040,000<strong>2007</strong> 2008 2009 2010 2011 2012 2013 2014 2015 2016 2017 2018 2019 2020 2021 2022 2023 2024 2025 2026RA13 RA14 RA15 RA16 RA17 GHG Pref. Std.218
<strong>PacifiCorp</strong> – <strong>2007</strong> IRPChapter 7 – Modeling and Portfolio Selection ResultsFigure 7.42 – Annual CO 2 Emission Trends, <strong>2007</strong>-2026 (Average for all CO 2 Adder Cases)65,00060,00055,000(Tons 000)50,00045,00040,000<strong>2007</strong> 2008 2009 2010 2011 2012 2013 2014 2015 2016 2017 2018 2019 2020 2021 2022 2023 2024 2025 2026RA13 RA14 RA15 RA16 RA17 GHG Pref. Std.219
<strong>PacifiCorp</strong> – <strong>2007</strong> IRPChapter 8 – Action <strong>Plan</strong>8. ACTION PLANChapter Highlights The company plans to accelerate its previous commitment to acquire 1,400 megawatts ofcost-effective renewable resources from 2015 to 2010, and increase this amount to 2,000megawatts of cost-effective renewable resources by 2013. The company will seek to add transmission infrastructure and flexible generating resources,such as natural gas, to integrate new wind resources since it is expected thatwind will comprise a large portion of the company’s accelerated and expanded renewableportfolio. The company will continue to run programs to acquire 250 average megawatts of costeffectiveenergy efficiency, and an additional 200 average megawatts if cost-effectiveinitiatives can be identified. The company plans to maintain and build upon the existing 150 megawatts of irrigationand air conditioning load control in Utah and Idaho, and add 100 megawatts of additionalirrigation load control split between system-East and system-West beginning in2010. The company will seek to leverage voluntary demand-side measures, such as demandbuyback, to improve system reliability during peak load hours. The company plans to acquire up to 1,700 megawatts of base load resources on the eastside of its system for the term 2012 through 2014, consistent with the filed request forproposal. The company plans to acquire 200 to 1,<strong>30</strong>0 megawatts of base load resource on the westside of its system in 2010 to 2014 through a mix of thermal resources and purchases. The company plans to expand its transmission system to allow the resources identified inthe preferred portfolio to serve customer loads in a cost-effective and reliable manner. The company will incorporate the results of the demand-side management potentialstudy into its business and into future integrated resource plans. The company will continue to take a leadership role in discussions on global climatechange and will continue to investigate carbon reduction technology, including nuclearpower. The company plans to enhance its integrated resource planning modeling to better addressemerging issues on renewable portfolio standards and carbon regulation. The company will continue to work with stakeholders on cost allocation issues in orderto achieve a portfolio that meets each state’s energy policy.221
<strong>PacifiCorp</strong> – <strong>2007</strong> IRPChapter 8 – Action <strong>Plan</strong>INTRODUCTIONThis chapter presents the company’s <strong>2007</strong> action plan, which identifies the steps the companywill take during the next two years to implement this plan. It is based on the guidance providedby the company’s analysis and results described in Chapters 1 through 7 of this document as wellas feedback from stakeholders. In large part, the action plan is used to map out the steps requiredto acquire the resources identified in the preferred portfolio and to identify ways to improve thecompany’s future integrated resource planning.To develop the action plan, the company used the preferred portfolio as shown in Table 8.1(Portfolio RA14) along with issues raised by stakeholders during the course of the <strong>2007</strong> integratedresource planning process.Table 8.1 – <strong>Resource</strong> Investment Schedule for Portfolio RA14Supply and Demand-side Proxy <strong>Resource</strong>sNameplate Capacity, MW<strong>Resource</strong> Type <strong>2007</strong> 2008 2009 2010 2011 2012 2013 2014 2015 2016East Utah pulverized coal Supercritical 340Wyoming pulverized coal Supercritical 527Combined cycle CT 2x1 F class with duct firing 548Combined cycle CT 1x1 G class with duct firing 357Combined Heat and Power Generic east-wide 25Renewable Wind, Wyoming 200 200 200 <strong>30</strong>0Class 1 DSM* Load control, Sch. irrigation 26 25 18Front office transactions** Heavy Load Hour, 3rd Qtr - - - 393 272 97 3 149 192 165West CCCT 2x1 F Type with duct firing 602Combined Heat and Power Generic west-wide 75Renewable Wind, SE Washington <strong>30</strong>0 100Renewable Wind, NC Oregon 100 100 100Class 1 DSM* Load control, Sch. irrigation 12 11 12Front office transactions** Flat annual product - - - 219 64 555 657 247 246 249Annual Additions, Long Term <strong>Resource</strong>s <strong>30</strong>0 <strong>30</strong>0 100 312 839 1,125 318 527 - 357Annual Additions, Short Term <strong>Resource</strong>s - - - 612 336 652 660 396 438 414Total Annual Additions <strong>30</strong>0 <strong>30</strong>0 100 924 1,175 1,777 978 923 438 771* DSM is scaled up by 10% to account for avoided line losses.** Front office transaction amounts reflect purchases made for the year, and are not additive.Transmission Proxy <strong>Resource</strong>s*Transfer Capability, Megawatts<strong>Resource</strong> <strong>2007</strong> 2008 2009 2010 2011 2012 2013 2014 2015 2016East Path C Upgrade: Borah to Path-C South to Utah North <strong>30</strong>0Utah - Desert Southwest (Includes Mona - Oquirrh) 600Mona - Utah North 400Craig-Hayden to Park City 176Miners - Jim Bridger - Terminal 600Jim Bridger - Terminal 500West Walla Walla - Yakima 400West Main - Walla Walla 6<strong>30</strong>Total Annual Additions - - - 700 6<strong>30</strong> 1,776 - 500 - -* Transmission resource proxies represent a range of possible procurement strategies, including new wheeling contractsor construction of transmission facilities by <strong>PacifiCorp</strong> or as a joint project with other parties.222
<strong>PacifiCorp</strong> – <strong>2007</strong> IRPChapter 8 – Action <strong>Plan</strong>THE INTEGRATED RESOURCE PLAN ACTION PLANThe IRP action plan, detailed in Table 8.2, provides the company with a road map for movingforward with new resource acquisitions over the next two years. The IRP action plan is basedupon the latest and most accurate information available at the time the integrated resource plan isfiled. The resources identified in the plan are proxy resources and act as a guide to resource procurement.As resources are acquired, the resource type, timing, size, and location may vary fromthe proxy resource identified in the plan. Evaluations will be conducted at the time of acquiringany resource to justify such acquisition.223
<strong>PacifiCorp</strong> – <strong>2007</strong> IRP Chapter 8 – Action <strong>Plan</strong>Table 8.2 – <strong>2007</strong> IRP Action <strong>Plan</strong>ActionItem Category Action Type1 Renewables2 DSM3 DSMNewRenewablesExisting andNew Class 2programsNew Class 1programsCalendar-YearTimingSize(rounded tothe nearest50 MW forgenerationresources) Location<strong>2007</strong> - 2013 2,000 System Wind<strong>2007</strong> - 2014 450 MWa System<strong>2007</strong> - 2014 100East - 50West - 50IRP Proxy <strong>Resource</strong>Modeled Action100 MW decrements atvarious load shapesEast and West irrigationload control, East summerloadsAcquire 2,000 MW of renewables by2013, including the 1,400 MW outlinedin the Renewable <strong>Plan</strong>. Seek to addtransmission infrastructure and flexiblegenerating resources, such as naturalgas, to integrate new wind resources.Use decrement values to assess costeffectivenessof new programproposals. Acquire the base DSM(<strong>PacifiCorp</strong> and ETO combined) of 250MWa and up to an additional 200 MWaif cost-effective initiatives can beidentified. Will reassess Class 2objectives upon completion of systemwideDSM potential study to becompleted by June <strong>2007</strong>. Willincorporate potentials study findingsinto the <strong>2007</strong> update and 2008integrated resource planning processes.Targets were established throughpotential study work performed for the<strong>2007</strong> IRP. A new potential study isexpected to be completed by June <strong>2007</strong>,and associated findings will beincorporated into the <strong>2007</strong> update andthe 2008 integrated resource planningprocesses.224
<strong>PacifiCorp</strong> – <strong>2007</strong> IRP Chapter 8 – Action <strong>Plan</strong>ActionItem Category Action Type4 DSM56DistributedGenerationDistributedGeneration7 Supply-Side8 Supply-Side9 Supply-SideExisting andNew Class 3programsCombinedHeat andPower (CHP)StandbyGeneratorsBase Load /IntermediateLoadBase Load /IntermediateLoadBase Load /IntermediateLoadCalendar-YearTiming<strong>2007</strong> - 2014Size(rounded tothe nearest50 MW forgenerationresources) LocationTo bedeterminedSystem<strong>2007</strong>-2014 100 System<strong>2007</strong>-2014To bedeterminedSystem2012 550 East2012 350 East2014 550 EastIRP Proxy <strong>Resource</strong>Modeled ActionClass 3: demand buy-back,hourly pricing, seasonalpricing, etc.Class 4: system messagingand education25 MW steam topping cycleCHP; 5 MW gascombustion turbine CHP60 MW of diesel enginecapacity on the west sideCCCT (Wet "F" 2X1) withduct firingSupercritical pulverizedcoal (340 MW Utah unit)Supercritical pulverizedcoal (527 MW Wyomingunit)Although not currently in the baseresource stack, the company will seekto leverage Class 3 and 4 resources toimprove system reliability during peakload hours. Will incorporate potentialstudy findings into the <strong>2007</strong> updateand/or 2008 integrated resourceplanning processes.Pursue at least 75 MW of CHPgeneration for the west-side and 25MW for the east-side, to includepurchase of CHP output pursuant toPURPA regulations and from supplysideRFP outcomes. The potential studyresults will be incorporated into the<strong>2007</strong> update and 2008 integratedresource planning processesWill incorporate potential studyfindings into the <strong>2007</strong> update and 2008integrated resource planning processesProcure a base load / intermediate loadresource in the east by the summer of2012. This is part of the requirementincluded in the Base Load RFPProcure a base load / intermediate loadresource in the east by the summer of2012. This is part of the requirementincluded in the Base Load RFPProcure a base load / intermediate loadresource in the east by the summer of2014. This is part of the requirementincluded in the Base Load RFP225
<strong>PacifiCorp</strong> – <strong>2007</strong> IRP Chapter 8 – Action <strong>Plan</strong>ActionItem Category Action Type10 Supply-Side11 Supply-Side12 Supply-SideBase Load /IntermediateLoadBase Load /IntermediateLoadBase Load /IntermediateLoad13 Transmission Transmission14 Climate Change15Carbon-ReducingTechnologyStrategy andPolicyStrategy andPolicyCalendar-YearTimingSize(rounded tothe nearest50 MW forgenerationresources) Location2016 350 East2011 600 West2010-2014 350-6502010 andbeyondOngoingOngoingEast /WestVarious SystemNotapplicableNotapplicableIRP Proxy <strong>Resource</strong>Modeled ActionCCCT (Wet "G" 1X1) withduct firingCCCT (Wet “F” 2X1) withduct firingFront office transactions:West - flat annual productsEast - 3 rd quarter productsPath C UpgradeUtah - Desert SouthwestMona - Utah NorthCraig Hayden - Utah NorthMiners - Utah NorthJim Bridger - Utah NorthWalla Walla - YakimaWalla Walla - West MainSystem Not applicableSystem Not applicableInvestigate a base load / intermediateload resource in the east by the summerof 2016. This is not part of therequirement included in the Base LoadRFPProcure a base load / intermediate loadresource in the west by the summer of2011 - 2012Procure base load / intermediate loadresource beginning in the summer of2010, use the Base Load RFP asappropriate to fill the need in the eastPursue the addition of transmissionfacilities or wheeling contracts asidentified in the IRP to cost-effectivelymeet retail load requirements, integratewind and provide system reliability.Work with other transmission providersto facilitate joint projects whereappropriateContinue to have dialogue withstakeholders on Global Climate ChangeissuesEvaluate technologies that can reducethe carbon dioxide emissions of thecompany's resource portfolio in a costeffectivemanner, including but notlimited to, clean coal, sequestration,and nuclear power226
<strong>PacifiCorp</strong> – <strong>2007</strong> IRP Chapter 8 – Action <strong>Plan</strong>ActionItem Category Action Type16 IRP <strong>Plan</strong>ning17 IRP <strong>Plan</strong>ning18IRPAcknowledgementModeling andAnalysisModeling andAnalysisPolicy and costrecoveryCalendar-YearTiming<strong>2007</strong>-2008<strong>2007</strong>-2008<strong>2007</strong>Size(rounded tothe nearest50 MW forgenerationresources) LocationNotapplicableNotapplicableNotapplicableIRP Proxy <strong>Resource</strong>Modeled ActionSystem Not applicableSystem Not applicableSystem Not applicableContinue to investigate implications ofintegrating at least 2,000 MW of windto <strong>PacifiCorp</strong>'s systemUpdate modeling tools and assumptionsto reflect policy changes in the area ofrenewable portfolio standards andcarbon dioxide emissionsWork with states to gainacknowledgement or acceptance of the<strong>2007</strong> integrated resource plan andaction plan. To the extent state policiesresult in different acknowledged plans,work with states to achieve state policygoals in a manner that results in fullcost recovery of prudently incurredcosts227
<strong>PacifiCorp</strong> – <strong>2007</strong> IRPChapter 8 – Action <strong>Plan</strong>RESOURCE PROCUREMENTOverall <strong>Resource</strong> Procurement StrategyTo implement resource decisions in the action plan, <strong>PacifiCorp</strong> intends to use a formal and transparentprocurement program in accordance with the then-current law, rules, and/or guidelines ineach of the states in which <strong>PacifiCorp</strong> operates. The IRP has determined the need for resourceswith considerable specificity and identified the desirable portfolio resource characteristics andtiming of need. The IRP has not identified specific resources to procure, or even determined apreference between asset ownership versus contracted resources. These decisions will be madesubsequently on a case-by-case basis with an evaluation of competing resource options includingupdated available information on technological, environmental and other external factors such aselectric and natural gas price projections. These options will be fully developed using competitivebidding with a request for proposal (RFP) process, or other procurement methods as appropriate.For demand-side resources, <strong>PacifiCorp</strong> uses a variety of business processes to implement DSMprograms. The outsourcing model is preferred where the supplier takes the performance risk forachieving DSM results (such as the Cool Keeper program). In other cases, <strong>PacifiCorp</strong> projectmanages the program and contracts out specific tasks (such as the Energy FinAnswer program).A third method is to operate the program completely in-house as was done with the Idaho IrrigationLoad Control program. The business process used for any given program is based on operationalexpertise, performance risk and cost-effectiveness. As with supply-side resources, thecompany may resort to competitive bidding with an RFP process to uncover new program opportunities.Renewable <strong>Resource</strong>sThe <strong>2007</strong> integrated resource plan identifies 2,000 megawatts of renewable resources to be acquiredby 2013. Under this plan, the company seeks to acquire 1,400 megawatts of new renewableresources by 2010, with an additional 600 megawatts in place by 2013. The 2,000 megawattsof renewable resources is inclusive of the 1,400 megawatts of cost-effective renewableresources identified in the company’s renewable plan. In order to fill this requirement, the companywill continue to aggressively pursue the acquisition of these resources through various approachesincluding new requests for proposals, bi-lateral negotiations, the Public Utilities RegulatoryPolicy Act, and self-development. While the company used wind for modeling purposes inthe integrated resource planning process, renewable generation includes other fuel sources suchas biomass and landfill gas. In addition, the company will actively seek to add transmission infrastructureand flexible generating resources, such as natural gas, to integrate new wind resourcesand work to continuously improve its understanding of how to integrate large amounts ofwind into its portfolio in a reliable and cost-effective manner.Demand-side ManagementThe company has a variety of ongoing programs and associations to procure energy efficiencymeasures (Class 2 demand-side resources) from industrial, commercial and residential customers.These programs will be leveraged, and company-offered programs extended to other states,229
<strong>PacifiCorp</strong> – <strong>2007</strong> IRPChapter 8 – Action <strong>Plan</strong>as the means to acquire the majority of the 250 average megawatts of Class 2 demand-side resourcesidentified in the <strong>2007</strong> integrated resource plan. The company will continue these programsas long as they are cost-effective, and will seek to add new cost-effective programs in orderto meet this target. The company will also continue to pursue an additional 200 averagemegawatts of energy efficiency measures if cost-effective.With regard to load control (Class 1 demand-side resources), the company is actively working toretain the existing customers and continue expanding participation in these programs to achieveand build upon the 150 megawatts currently identified in the <strong>2007</strong> plan as an existing resource.The company will pursue acquisition of an additional 100 megawatts of load control identified inthe preferred portfolio starting in 2010.The company plans to leverage voluntary load control programs (Class 3 demand-side resources)such as demand buyback, hourly pricing and seasonal pricing, as well as system messaging andeducation (Class 4 demand-side resources), to improve system reliability during peak load hours.Finally, the company will be completing a demand-side management potential study in June<strong>2007</strong>, which will provide updated information on the potential for acquiring cost-effective demand-sideresources across all major resource types (load management, energy efficiency, demandresponse and system messaging and education). Information learned from the demand-sidemanagement potential study will be incorporated in the company’s demand-side managementprograms and in future integrated resource plans.Combined Heat and PowerThe <strong>2007</strong> integrated resource plan includes 100 megawatts of new combined heat and power in2012. Combined heat and power facilities are allowed to bid into the company’s current east sidebase load request for proposal, and can become part of the company’s resource portfolio as qualifyingfacilities under the Public Utilities Regulatory Policy Act. Additional information on thepotential for combined heat and power will be available from the demand-side management potentialstudy and will be incorporated into the company’s future integrated resource plans.Distributed GenerationThe company investigated the potential of adding distributed generation on the east side of itssystem and was informed by the Utah Department of Air Quality that it was not feasible to relyon existing standby generators at customer sites due to air quality considerations. On the westside of the system, the company found using sensitivity analysis that replacing a new resourcewith combined heat and power and aggregated dispatchable customer-owned standby generatorsmarginally increased cost and risk. The company will have additional information on distributedgeneration potential as part of the demand-side management potential study. Based on this information,the company will determine what further steps to take with regard to distributed generation.Thermal Base Load/Intermediate Load <strong>Resource</strong>sThe company has an outstanding request for proposals that is aimed at acquiring up to 1,700megawatts of cost-effective base load resource by 2014 on the east side of its system. The <strong>2007</strong>integrated resource plan identifies 1,450 megawatts of base load / intermediate load thermal re-2<strong>30</strong>
<strong>PacifiCorp</strong> – <strong>2007</strong> IRPChapter 8 – Action <strong>Plan</strong>sources needed on the east side of the system during this time frame based on a 12 percent planningreserve margin. Another 357 megawatts of base load / intermediate resource are identifiedin 2016. The <strong>2007</strong> integrated resource plan fully supports the outstanding Base Load Request forProposal.The <strong>2007</strong> integrated resource plan identified the need for 677 megawatts of base load / intermediateload thermal resources for the west side. The thermal resources consist of a 602 megawattcombined cycle natural gas plant in 2011 and 75 megawatts of combined heat and power in2012. These proxy resources identified in the integrated resource plan will be used to guide theprocurement of resources for the west side of the system such that the company can meet itsdeficit in the 2011-to-2012 time frame in a manner that is cost-effective, adjusted for risk. Theactual mix and quantity of resources procured by the company to satisfy this need in the westmay differ from the proxy resources identified in the integrated resource plan. Consistent withstate guidelines for resource procurement, the company will perform updated analyses at the timenew resources are acquired.Front Office TransactionsThe <strong>2007</strong> integrated resource plan identified the annual need for 50 to 650 megawatts of frontoffice transactions on the west side of its system for 2010 to 2014. The front office transactionsare modeled as flat annual purchases 67 and serve as a proxy for base load / intermediate load resources.Acquisition of front office transactions in the west will be considered in the context ofthe overall base load / intermediate load resource need in the west.On the east side, the integrated resource plan identified the annual need for up to 400 megawattsof front office transactions for the 2010-to-2014 period. The need may be addressed using theBase Load Request for Proposals. Beyond this time frame, the annual need drops to no more than200 megawatts.Transmission ExpansionThe <strong>2007</strong> integrated resource plan has identified a need for additional transmission as part of thepreferred portfolio. In general, transmission additions reflect the need to meet retail load requirements,integrate wind and provide system reliability. Specific enhancements are required tointegrate both the Wyoming and southern Utah areas with the Wasatch front, create additionalintegration with markets in the desert southwest, and integrate new resources and front officetransactions with loads on the west side of the company’s system.The transmission additions identified in the preferred portfolio are proxy transmission additions.They are included as options that can be selected by the company’s integrated resource planningmodels on a comparable basis with supply-side and demand-side resources. The proxy transmissionadditions included in the preferred portfolio serve as a guide to the company’s transmissionplanners and may ultimately result in construction of new facilities by the company, partneringin regional transmission projects with others, or the execution of third party wheeling contracts.The timing and size of new transmission facilities may vary from the proxy transmission addi-67 Market purchases are assumed to be delivered at market hubs, primarily Mid-Columbia, and not at the load. Forfront office transactions to reach load, additional transmission is required.231
<strong>PacifiCorp</strong> – <strong>2007</strong> IRPChapter 8 – Action <strong>Plan</strong>tions included in the preferred portfolio due to specific siting, permitting and construction issuesassociated with a given project.OTHER ISSUESGlobal Climate ChangeAs discussed elsewhere in this IRP, one of the most challenging resource planning issues facingthe company is how to address risk associated with the regulation of greenhouse gas emissions.As new climate policies and laws are adopted by state legislatures, utility commissions or thefederal government to limit the utilization of higher carbon-emitting resources, <strong>PacifiCorp</strong> willadjust its capacity expansion model to account for those new policies.To address this challenge, <strong>PacifiCorp</strong> has formed a Global Climate Change Working Group toanalyze and discuss utility best practices in managing emissions of greenhouse gases and identifycost-effective opportunities to reduce greenhouse gas emissions within the respective states’regulatory framework. The company expects to have filed, with all six commissions, a preliminaryGlobal Climate Change Action <strong>Plan</strong> by the fourth quarter <strong>2007</strong>.<strong>PacifiCorp</strong> employees will continue to have dialogue with stakeholders on this issue, explainingthe various efforts already underway, and with stakeholder partners offering guidance and feedbackon how the company might improve upon the efforts identified within the Global ClimateChange Action <strong>Plan</strong>.Separately, <strong>PacifiCorp</strong> is engaged in several partnerships, such as the Big Sky Carbon SequestrationPartnership and the Electric Power Research Institute, to explore energy, climate change,economic growth and carbon sequestration opportunities. The company also continues to participatein groups organized at state government levels that are designed to develop global climatechange policy such as Oregon Docket UM 1<strong>30</strong>2 that is investigating the treatment of carbon dioxiderisk in integrated resource planning.Carbon Reducing TechnologiesSince the second quarter of 2006, the company has sponsored a workgroup to specifically investigateintegrated gasification combined cycle technology and carbon dioxide sequestration. Asthe company moves forward, it will expand its view to all feasible technologies that can potentiallyreduce carbon dioxide emissions in a cost-effective manner, including nuclear power. Forexample, the Wyoming Infrastructure Authority and <strong>PacifiCorp</strong> are pursuing joint project developmentactivities for an IGCC facility in Wyoming.Modeling ImprovementsWhile the <strong>2007</strong> integrated resource plan addresses renewable portfolio standards and carbon risk,it is becoming increasingly important to refine the modeling capabilities in this area. The companywill pursue enhancements to the integrated resource planning models to potentially incorporatemore sophisticated methods to address new resource portfolio standards and carbon regulations.232
<strong>PacifiCorp</strong> – <strong>2007</strong> IRPChapter 8 – Action <strong>Plan</strong>Cost Assignment and RecoveryThe preferred portfolio is based on the premise of a single integrated system with rolled-in costsfor new resources as prescribed under the Revised Protocol allocation methodology. Acknowledgementor acceptance of a single plan is a prerequisite for use of the Revised Protocol whenthe company is acquiring new resources. To the extent states acknowledge or accept differentplans, the company will work with the states to find ways to deliver different plans to differentstates, while maintaining the highest possible level of system integration benefits and assuringfull cost recovery of prudently incurred costs required to serve retail customers.ASSESSMENT OF OWNING ASSETS VERSUS PURCHASING POWERAs the company acquires new resources, it will need to determine whether it is better to own aresource or purchase power from another party. While the ultimate decision will be made at thetime resources are acquired, and will primarily be based on cost, there are other considerationsthat may be relevant.With owned resources, the company would be in a better position to control costs, make life extensionimprovements, use the site for additional resources in the future, change fueling strategiesor sources, efficiently address plant modifications that may be required as a result ofchanges in environmental or other laws and regulations, and utilize the plant at cost as long asthe it remains economic. In addition, by owning a plant, the company can hedge itself from theuncertainty of relying on purchasing power from others. On the negative side, owning a facilitysubjects the company and customers to the risk that the cost of ownership and operation exceedsexpectations, the cost of poor performance or early termination, fuel price risk, and the liabilityof reclamation at the end of the facilities life.Purchasing power from another party can help mitigate the risk of cost overruns during constructionand operation of the plant, can provide certainty of cost and performance, and can avoid anyliabilities associated with closure of the plant. Short-term purchased power contracts could allowthe company to forgo a long term decision for a period of time if it was deemed appropriate to doso. On the negative side, a purchase power contract could terminate prior to the end of the term,requiring the company to replace the output of the contract at then current market prices. In addition,the company and customers do not receive any of the savings that result from managementof the asset, nor do they receive any of the value that arise from the plant after the contract hasexpired.RESOURCE ACQUISITION PLAN PATH ANALYSISThe Utah Public Service Commission’s IRP standards and guidelines require that <strong>PacifiCorp</strong>’sIRP contain a “plan of different resource acquisition paths for different economic circumstanceswith a decision mechanism to select among and modify these paths as the future unfolds.”<strong>PacifiCorp</strong>’s resource acquisition path analysis plan for this IRP consists of the use of the IRPmodels for the Base Load Request For Proposals issued on April 5, <strong>2007</strong>. The modeling planentails evaluating bid resources on a portfolio basis similar to how portfolios were evaluated inthe <strong>2007</strong> IRP. The timing of the RFP, with a consequent refreshing of analysis inputs and inclu-233
<strong>PacifiCorp</strong> – <strong>2007</strong> IRPChapter 8 – Action <strong>Plan</strong>sion of <strong>PacifiCorp</strong>’s benchmark resources, represents a logical and efficient strategy to addressthis requirement.To formulate and analyze different resource acquisition paths, the RFP modeling process includestwo deterministic scenario analysis steps in which bid resources, including <strong>PacifiCorp</strong>benchmark resources, are evaluated with the Capacity Expansion Module under a range of scenarioassumptions. The scenarios capture a combination of alternative electricity/gas prices, CO 2cost adders, and planning reserve margins.The first scenario analysis step involves running the CEM with the full set of short-listed bidresources to assist in screening the resources. The second scenario analysis step occurs after stochasticsimulation has been used to select bid resource finalists. The portfolio of bid resourcefinalists is subjected to another round of CEM runs using the same scenario set applied to initiallyscreen the bid resources. In contrast to the first scenario analysis step, the bid resources arefixed, and CEM use is limited to just determining the dispatch solution and PVRR under differenteconomic conditions. This path analysis step is intended to help assure the company that thebid resource finalists are robust with respect to cost and cost variability under alternative economicand planning assumptions.234