PacifiCorp 2007 Integrated Resource Plan (May 30, 2007)
PacifiCorp 2007 Integrated Resource Plan (May 30, 2007)
PacifiCorp 2007 Integrated Resource Plan (May 30, 2007)
Create successful ePaper yourself
Turn your PDF publications into a flip-book with our unique Google optimized e-Paper software.
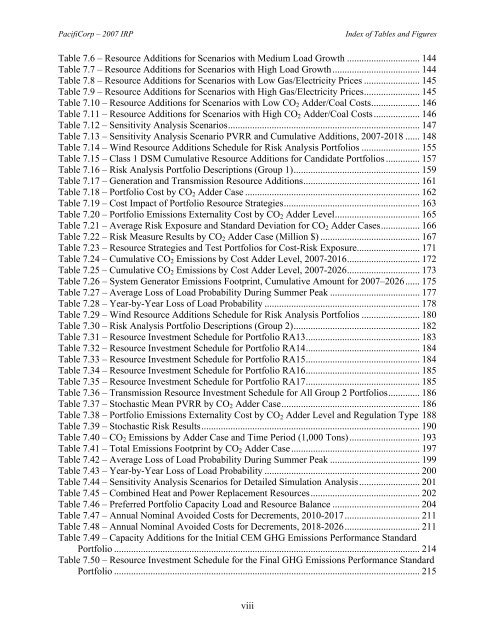
<strong>PacifiCorp</strong> – <strong>2007</strong> IRPIndex of Tables and FiguresTable 7.6 – <strong>Resource</strong> Additions for Scenarios with Medium Load Growth .............................. 144Table 7.7 – <strong>Resource</strong> Additions for Scenarios with High Load Growth.................................... 144Table 7.8 – <strong>Resource</strong> Additions for Scenarios with Low Gas/Electricity Prices ....................... 145Table 7.9 – <strong>Resource</strong> Additions for Scenarios with High Gas/Electricity Prices....................... 145Table 7.10 – <strong>Resource</strong> Additions for Scenarios with Low CO 2 Adder/Coal Costs.................... 146Table 7.11 – <strong>Resource</strong> Additions for Scenarios with High CO 2 Adder/Coal Costs................... 146Table 7.12 – Sensitivity Analysis Scenarios............................................................................... 147Table 7.13 – Sensitivity Analysis Scenario PVRR and Cumulative Additions, <strong>2007</strong>-2018 ...... 148Table 7.14 – Wind <strong>Resource</strong> Additions Schedule for Risk Analysis Portfolios ........................ 155Table 7.15 – Class 1 DSM Cumulative <strong>Resource</strong> Additions for Candidate Portfolios .............. 157Table 7.16 – Risk Analysis Portfolio Descriptions (Group 1).................................................... 159Table 7.17 – Generation and Transmission <strong>Resource</strong> Additions................................................ 161Table 7.18 – Portfolio Cost by CO 2 Adder Case ........................................................................ 162Table 7.19 – Cost Impact of Portfolio <strong>Resource</strong> Strategies........................................................ 163Table 7.20 – Portfolio Emissions Externality Cost by CO 2 Adder Level................................... 165Table 7.21 – Average Risk Exposure and Standard Deviation for CO 2 Adder Cases................ 166Table 7.22 – Risk Measure Results by CO 2 Adder Case (Million $) ......................................... 167Table 7.23 – <strong>Resource</strong> Strategies and Test Portfolios for Cost-Risk Exposure.......................... 171Table 7.24 – Cumulative CO 2 Emissions by Cost Adder Level, <strong>2007</strong>-2016.............................. 172Table 7.25 – Cumulative CO 2 Emissions by Cost Adder Level, <strong>2007</strong>-2026.............................. 173Table 7.26 – System Generator Emissions Footprint, Cumulative Amount for <strong>2007</strong>–2026...... 175Table 7.27 – Average Loss of Load Probability During Summer Peak ..................................... 177Table 7.28 – Year-by-Year Loss of Load Probability ................................................................ 178Table 7.29 – Wind <strong>Resource</strong> Additions Schedule for Risk Analysis Portfolios ........................ 180Table 7.<strong>30</strong> – Risk Analysis Portfolio Descriptions (Group 2).................................................... 182Table 7.31 – <strong>Resource</strong> Investment Schedule for Portfolio RA13............................................... 183Table 7.32 – <strong>Resource</strong> Investment Schedule for Portfolio RA14............................................... 184Table 7.33 – <strong>Resource</strong> Investment Schedule for Portfolio RA15............................................... 184Table 7.34 – <strong>Resource</strong> Investment Schedule for Portfolio RA16............................................... 185Table 7.35 – <strong>Resource</strong> Investment Schedule for Portfolio RA17............................................... 185Table 7.36 – Transmission <strong>Resource</strong> Investment Schedule for All Group 2 Portfolios............. 186Table 7.37 – Stochastic Mean PVRR by CO 2 Adder Case......................................................... 186Table 7.38 – Portfolio Emissions Externality Cost by CO 2 Adder Level and Regulation Type 188Table 7.39 – Stochastic Risk Results.......................................................................................... 190Table 7.40 – CO 2 Emissions by Adder Case and Time Period (1,000 Tons)............................. 193Table 7.41 – Total Emissions Footprint by CO 2 Adder Case..................................................... 197Table 7.42 – Average Loss of Load Probability During Summer Peak ..................................... 199Table 7.43 – Year-by-Year Loss of Load Probability ................................................................ 200Table 7.44 – Sensitivity Analysis Scenarios for Detailed Simulation Analysis......................... 201Table 7.45 – Combined Heat and Power Replacement <strong>Resource</strong>s............................................. 202Table 7.46 – Preferred Portfolio Capacity Load and <strong>Resource</strong> Balance .................................... 204Table 7.47 – Annual Nominal Avoided Costs for Decrements, 2010-2017............................... 211Table 7.48 – Annual Nominal Avoided Costs for Decrements, 2018-2026............................... 211Table 7.49 – Capacity Additions for the Initial CEM GHG Emissions Performance StandardPortfolio .............................................................................................................................. 214Table 7.50 – <strong>Resource</strong> Investment Schedule for the Final GHG Emissions Performance StandardPortfolio .............................................................................................................................. 215viii


