PacifiCorp 2007 Integrated Resource Plan (May 30, 2007)
PacifiCorp 2007 Integrated Resource Plan (May 30, 2007)
PacifiCorp 2007 Integrated Resource Plan (May 30, 2007)

You also want an ePaper? Increase the reach of your titles
YUMPU automatically turns print PDFs into web optimized ePapers that Google loves.
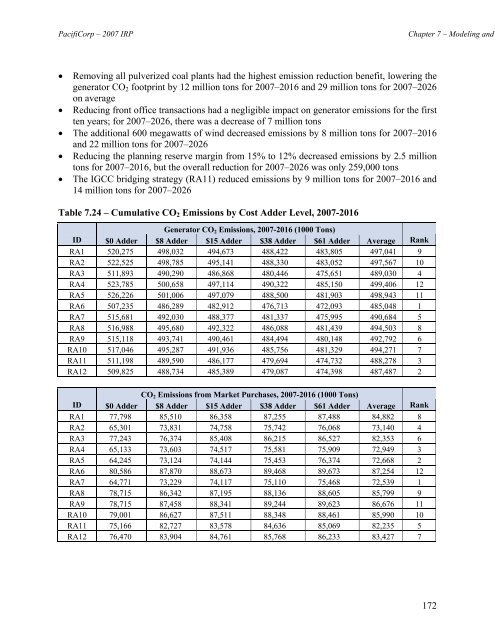
<strong>PacifiCorp</strong> – <strong>2007</strong> IRPChapter 7 – Modeling and• Removing all pulverized coal plants had the highest emission reduction benefit, lowering thegenerator CO 2 footprint by 12 million tons for <strong>2007</strong>–2016 and 29 million tons for <strong>2007</strong>–2026on average• Reducing front office transactions had a negligible impact on generator emissions for the firstten years; for <strong>2007</strong>–2026, there was a decrease of 7 million tons• The additional 600 megawatts of wind decreased emissions by 8 million tons for <strong>2007</strong>–2016and 22 million tons for <strong>2007</strong>–2026• Reducing the planning reserve margin from 15% to 12% decreased emissions by 2.5 milliontons for <strong>2007</strong>–2016, but the overall reduction for <strong>2007</strong>–2026 was only 259,000 tons• The IGCC bridging strategy (RA11) reduced emissions by 9 million tons for <strong>2007</strong>–2016 and14 million tons for <strong>2007</strong>–2026Table 7.24 – Cumulative CO 2 Emissions by Cost Adder Level, <strong>2007</strong>-2016Generator CO 2 Emissions, <strong>2007</strong>-2016 (1000 Tons)ID $0 Adder $8 Adder $15 Adder $38 Adder $61 Adder Average RankRA1 520,275 498,032 494,673 488,422 483,805 497,041 9RA2 522,525 498,785 495,141 488,3<strong>30</strong> 483,052 497,567 10RA3 511,893 490,290 486,868 480,446 475,651 489,0<strong>30</strong> 4RA4 523,785 500,658 497,114 490,322 485,150 499,406 12RA5 526,226 501,006 497,079 488,500 481,903 498,943 11RA6 507,235 486,289 482,912 476,713 472,093 485,048 1RA7 515,681 492,0<strong>30</strong> 488,377 481,337 475,995 490,684 5RA8 516,988 495,680 492,322 486,088 481,439 494,503 8RA9 515,118 493,741 490,461 484,494 480,148 492,792 6RA10 517,046 495,287 491,936 485,756 481,329 494,271 7RA11 511,198 489,590 486,177 479,694 474,732 488,278 3RA12 509,825 488,734 485,389 479,087 474,398 487,487 2CO 2 Emissions from Market Purchases, <strong>2007</strong>-2016 (1000 Tons)ID $0 Adder $8 Adder $15 Adder $38 Adder $61 Adder Average RankRA1 77,798 85,510 86,358 87,255 87,488 84,882 8RA2 65,<strong>30</strong>1 73,831 74,758 75,742 76,068 73,140 4RA3 77,243 76,374 85,408 86,215 86,527 82,353 6RA4 65,133 73,603 74,517 75,581 75,909 72,949 3RA5 64,245 73,124 74,144 75,453 76,374 72,668 2RA6 80,586 87,870 88,673 89,468 89,673 87,254 12RA7 64,771 73,229 74,117 75,110 75,468 72,539 1RA8 78,715 86,342 87,195 88,136 88,605 85,799 9RA9 78,715 87,458 88,341 89,244 89,623 86,676 11RA10 79,001 86,627 87,511 88,348 88,461 85,990 10RA11 75,166 82,727 83,578 84,636 85,069 82,235 5RA12 76,470 83,904 84,761 85,768 86,233 83,427 7172