PacifiCorp 2007 Integrated Resource Plan (May 30, 2007)
PacifiCorp 2007 Integrated Resource Plan (May 30, 2007)
PacifiCorp 2007 Integrated Resource Plan (May 30, 2007)
You also want an ePaper? Increase the reach of your titles
YUMPU automatically turns print PDFs into web optimized ePapers that Google loves.
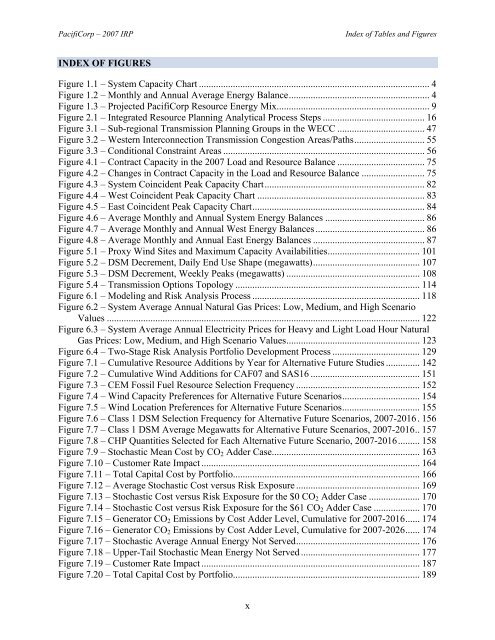
<strong>PacifiCorp</strong> – <strong>2007</strong> IRPIndex of Tables and FiguresINDEX OF FIGURESFigure 1.1 – System Capacity Chart ............................................................................................... 4Figure 1.2 – Monthly and Annual Average Energy Balance.......................................................... 4Figure 1.3 – Projected <strong>PacifiCorp</strong> <strong>Resource</strong> Energy Mix............................................................... 9Figure 2.1 – <strong>Integrated</strong> <strong>Resource</strong> <strong>Plan</strong>ning Analytical Process Steps .......................................... 16Figure 3.1 – Sub-regional Transmission <strong>Plan</strong>ning Groups in the WECC .................................... 47Figure 3.2 – Western Interconnection Transmission Congestion Areas/Paths............................. 55Figure 3.3 – Conditional Constraint Areas ................................................................................... 56Figure 4.1 – Contract Capacity in the <strong>2007</strong> Load and <strong>Resource</strong> Balance .................................... 75Figure 4.2 – Changes in Contract Capacity in the Load and <strong>Resource</strong> Balance .......................... 75Figure 4.3 – System Coincident Peak Capacity Chart.................................................................. 82Figure 4.4 – West Coincident Peak Capacity Chart ..................................................................... 83Figure 4.5 – East Coincident Peak Capacity Chart....................................................................... 84Figure 4.6 – Average Monthly and Annual System Energy Balances ......................................... 86Figure 4.7 – Average Monthly and Annual West Energy Balances............................................. 86Figure 4.8 – Average Monthly and Annual East Energy Balances .............................................. 87Figure 5.1 – Proxy Wind Sites and Maximum Capacity Availabilities...................................... 101Figure 5.2 – DSM Decrement, Daily End Use Shape (megawatts)............................................ 107Figure 5.3 – DSM Decrement, Weekly Peaks (megawatts) ....................................................... 108Figure 5.4 – Transmission Options Topology ............................................................................ 114Figure 6.1 – Modeling and Risk Analysis Process ..................................................................... 118Figure 6.2 – System Average Annual Natural Gas Prices: Low, Medium, and High ScenarioValues ................................................................................................................................. 122Figure 6.3 – System Average Annual Electricity Prices for Heavy and Light Load Hour NaturalGas Prices: Low, Medium, and High Scenario Values....................................................... 123Figure 6.4 – Two-Stage Risk Analysis Portfolio Development Process .................................... 129Figure 7.1 – Cumulative <strong>Resource</strong> Additions by Year for Alternative Future Studies .............. 142Figure 7.2 – Cumulative Wind Additions for CAF07 and SAS16 ............................................. 151Figure 7.3 – CEM Fossil Fuel <strong>Resource</strong> Selection Frequency ................................................... 152Figure 7.4 – Wind Capacity Preferences for Alternative Future Scenarios................................ 154Figure 7.5 – Wind Location Preferences for Alternative Future Scenarios................................ 155Figure 7.6 – Class 1 DSM Selection Frequency for Alternative Future Scenarios, <strong>2007</strong>-2016. 156Figure 7.7 – Class 1 DSM Average Megawatts for Alternative Future Scenarios, <strong>2007</strong>-2016.. 157Figure 7.8 – CHP Quantities Selected for Each Alternative Future Scenario, <strong>2007</strong>-2016......... 158Figure 7.9 – Stochastic Mean Cost by CO 2 Adder Case............................................................. 163Figure 7.10 – Customer Rate Impact .......................................................................................... 164Figure 7.11 – Total Capital Cost by Portfolio............................................................................. 166Figure 7.12 – Average Stochastic Cost versus Risk Exposure ................................................... 169Figure 7.13 – Stochastic Cost versus Risk Exposure for the $0 CO 2 Adder Case ..................... 170Figure 7.14 – Stochastic Cost versus Risk Exposure for the $61 CO 2 Adder Case ................... 170Figure 7.15 – Generator CO 2 Emissions by Cost Adder Level, Cumulative for <strong>2007</strong>-2016...... 174Figure 7.16 – Generator CO 2 Emissions by Cost Adder Level, Cumulative for <strong>2007</strong>-2026...... 174Figure 7.17 – Stochastic Average Annual Energy Not Served................................................... 176Figure 7.18 – Upper-Tail Stochastic Mean Energy Not Served ................................................. 177Figure 7.19 – Customer Rate Impact .......................................................................................... 187Figure 7.20 – Total Capital Cost by Portfolio............................................................................. 189x


