PacifiCorp 2007 Integrated Resource Plan (May 30, 2007)
PacifiCorp 2007 Integrated Resource Plan (May 30, 2007)
PacifiCorp 2007 Integrated Resource Plan (May 30, 2007)

You also want an ePaper? Increase the reach of your titles
YUMPU automatically turns print PDFs into web optimized ePapers that Google loves.
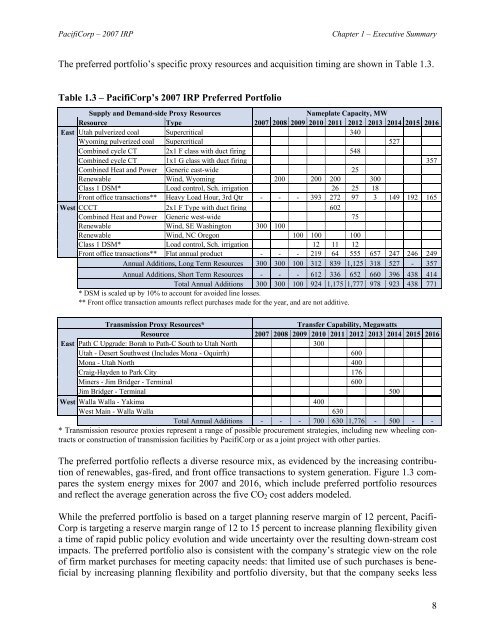
<strong>PacifiCorp</strong> – <strong>2007</strong> IRPChapter 1 – Executive SummaryThe preferred portfolio’s specific proxy resources and acquisition timing are shown in Table 1.3.Table 1.3 – <strong>PacifiCorp</strong>’s <strong>2007</strong> IRP Preferred PortfolioSupply and Demand-side Proxy <strong>Resource</strong>sNameplate Capacity, MW<strong>Resource</strong> Type <strong>2007</strong> 2008 2009 2010 2011 2012 2013 2014 2015 2016East Utah pulverized coal Supercritical 340Wyoming pulverized coal Supercritical 527Combined cycle CT 2x1 F class with duct firing 548Combined cycle CT 1x1 G class with duct firing 357Combined Heat and Power Generic east-wide 25Renewable Wind, Wyoming 200 200 200 <strong>30</strong>0Class 1 DSM* Load control, Sch. irrigation 26 25 18Front office transactions** Heavy Load Hour, 3rd Qtr - - - 393 272 97 3 149 192 165West CCCT 2x1 F Type with duct firing 602Combined Heat and Power Generic west-wide 75Renewable Wind, SE Washington <strong>30</strong>0 100Renewable Wind, NC Oregon 100 100 100Class 1 DSM* Load control, Sch. irrigation 12 11 12Front office transactions** Flat annual product - - - 219 64 555 657 247 246 249Annual Additions, Long Term <strong>Resource</strong>s <strong>30</strong>0 <strong>30</strong>0 100 312 839 1,125 318 527 - 357Annual Additions, Short Term <strong>Resource</strong>s - - - 612 336 652 660 396 438 414Total Annual Additions <strong>30</strong>0 <strong>30</strong>0 100 924 1,175 1,777 978 923 438 771* DSM is scaled up by 10% to account for avoided line losses.** Front office transaction amounts reflect purchases made for the year, and are not additive.Transmission Proxy <strong>Resource</strong>s*Transfer Capability, Megawatts<strong>Resource</strong> <strong>2007</strong> 2008 2009 2010 2011 2012 2013 2014 2015 2016East Path C Upgrade: Borah to Path-C South to Utah North <strong>30</strong>0Utah - Desert Southwest (Includes Mona - Oquirrh) 600Mona - Utah North 400Craig-Hayden to Park City 176Miners - Jim Bridger - Terminal 600Jim Bridger - Terminal 500West Walla Walla - Yakima 400West Main - Walla Walla 6<strong>30</strong>Total Annual Additions - - - 700 6<strong>30</strong> 1,776 - 500 - -* Transmission resource proxies represent a range of possible procurement strategies, including new wheeling contractsor construction of transmission facilities by <strong>PacifiCorp</strong> or as a joint project with other parties.The preferred portfolio reflects a diverse resource mix, as evidenced by the increasing contributionof renewables, gas-fired, and front office transactions to system generation. Figure 1.3 comparesthe system energy mixes for <strong>2007</strong> and 2016, which include preferred portfolio resourcesand reflect the average generation across the five CO 2 cost adders modeled.While the preferred portfolio is based on a target planning reserve margin of 12 percent, Pacifi-Corp is targeting a reserve margin range of 12 to 15 percent to increase planning flexibility givena time of rapid public policy evolution and wide uncertainty over the resulting down-stream costimpacts. The preferred portfolio also is consistent with the company’s strategic view on the roleof firm market purchases for meeting capacity needs: that limited use of such purchases is beneficialby increasing planning flexibility and portfolio diversity, but that the company seeks less8